Caruaru Airbnb Market Analysis 2026: Short Term Rental Data & Vacation Rental Statistics in Pernambuco, Brazil
Is Airbnb profitable in Caruaru in 2026? Explore comprehensive Airbnb analytics for Caruaru, Pernambuco, Brazil to uncover income potential. This 2026 STR market report for Caruaru, based on AirROI data from February 2025 to January 2026, reveals key trends in the market of 299 active listings.
Whether you're considering an Airbnb investment in Caruaru, optimizing your existing vacation rental, or exploring rental arbitrage opportunities, understanding the Caruaru Airbnb data is crucial. Leveraging the low regulation environment is key to maximizing your short term rental income potential. Let's dive into the specifics.
Key Caruaru Airbnb Performance Metrics Overview
Monthly Airbnb Revenue Variations & Income Potential in Caruaru (2026)
Understanding the monthly revenue variations for Airbnb listings in Caruaru is key to maximizing your short term rental income potential. Seasonality significantly impacts earnings. Our analysis, based on data from the past 12 months, shows that the peak revenue month for STRs in Caruaru is typically June, while February often presents the lowest earnings, highlighting opportunities for strategic pricing adjustments during shoulder and low seasons. Explore the typical Airbnb income in Caruaru across different performance tiers:
- Best-in-class properties (Top 10%) achieve $830+ monthly, often utilizing dynamic pricing and superior guest experiences.
- Strong performing properties (Top 25%) earn $563 or more, indicating effective management and desirable locations/amenities.
- Typical properties (Median) generate around $300 per month, representing the average market performance.
- Entry-level properties (Bottom 25%) see earnings around $142, often with potential for optimization.
Average Monthly Airbnb Earnings Trend in Caruaru
Caruaru Airbnb Occupancy Rate Trends (2026)
Maximize your bookings by understanding the Caruaru STR occupancy trends. Seasonal demand shifts significantly influence how often properties are booked. Typically, Junesees the highest demand (peak season occupancy), while May experiences the lowest (low season). Effective strategies, like adjusting minimum stays or offering promotions, can boost occupancy during slower periods. Here's how different property tiers perform in Caruaru:
- Best-in-class properties (Top 10%) achieve 69%+ occupancy, indicating high desirability and potentially optimized availability.
- Strong performing properties (Top 25%) maintain 47% or higher occupancy, suggesting good market fit and guest satisfaction.
- Typical properties (Median) have an occupancy rate around 26%.
- Entry-level properties (Bottom 25%) average 12% occupancy, potentially facing higher vacancy.
Average Monthly Occupancy Rate Trend in Caruaru
Average Daily Rate (ADR) Airbnb Trends in Caruaru (2026)
Effective short term rental pricing strategy in Caruaru involves understanding monthly ADR fluctuations. The Average Daily Rate (ADR) for Airbnb in Caruaru typically peaks in June and dips lowest during February. Leveraging Airbnb dynamic pricing tools or strategies based on this seasonality can significantly boost revenue. Here's a look at the typical nightly rates achieved:
- Best-in-class properties (Top 10%) command rates of $87+ per night, often due to premium features or locations.
- Strong performing properties (Top 25%) achieve nightly rates of $56 or more.
- Typical properties (Median) charge around $38 per night.
- Entry-level properties (Bottom 25%) earn around $26 per night.
Average Daily Rate (ADR) Trend by Month in Caruaru
Get Live Caruaru Market Intelligence 👇

Explore Real-time Analytics
Airbnb Seasonality Analysis & Trends in Caruaru (2026)
Peak Season (June, July, December)
- Revenue averages $593 per month
- Occupancy rates average 35.7%
- Daily rates average $56
Shoulder Season
- Revenue averages $349 per month
- Occupancy maintains around 30.2%
- Daily rates hold near $46
Low Season (January, February, April)
- Revenue drops to average $303 per month
- Occupancy decreases to average 31.3%
- Daily rates adjust to average $43
Seasonality Insights for Caruaru
- The Airbnb seasonality in Caruaru shows highly seasonal trends requiring careful strategy. While the sections above show seasonal averages, it's also insightful to look at the extremes:
- During the high season, the absolute peak month showcases Caruaru's highest earning potential, with monthly revenues capable of climbing to $870, occupancy reaching a high of 39.1%, and ADRs peaking at $72.
- Conversely, the slowest single month of the year, typically falling within the low season, marks the market's lowest point. In this month, revenue might dip to $293, occupancy could drop to 24.6%, and ADRs may adjust down to $41.
- Understanding both the seasonal averages and these monthly peaks and troughs in revenue, occupancy, and ADR is crucial for maximizing your Airbnb profit potential in Caruaru.
Seasonal Strategies for Maximizing Profit
- Peak Season: Maximize revenue through premium pricing and potentially longer minimum stays. Ensure high availability.
- Low Season: Offer competitive pricing, special promotions (e.g., extended stay discounts), and flexible cancellation policies. Target off-season travelers like remote workers or budget-conscious guests.
- Shoulder Seasons: Implement dynamic pricing that balances peak and low rates. Target weekend travelers or specific events. Offer slightly more flexible terms than peak season.
- Regularly analyze your own performance against these Caruaru seasonality benchmarks and adjust your pricing and availability strategy accordingly.
Best Areas for Airbnb Investment in Caruaru (2026)
Exploring the top neighborhoods for short-term rentals in Caruaru? This section highlights key areas, outlining why they are attractive for hosts and guests, along with notable local attractions. Consider these locations based on your target guest profile and investment strategy.
| Neighborhood / Area | Why Host Here? (Target Guests & Appeal) | Key Attractions & Landmarks |
|---|---|---|
| Centro | The historic center of Caruaru, full of cultural significance and a vibrant local market scene. It's ideal for tourists who want to experience the local life and traditions of the city. | Feira de Caruaru, Museu do Forró, Igreja de Nossa Senhora da Conceição, Pátio de Eventos Luiz Gonzaga, Teatro João Lyra |
| São João da Escócia | A residential area that has become popular with families and is close to schools and parks. It attracts guests looking for a quieter stay away from the hustle and bustle. | Parque José Pinto, Colégio Adventista, Shopping Caruaru, Cinemark, Supermercados |
| João Manta | Known for its beautiful views and close proximity to nature, this area is becoming a favorite for eco-tourism. Perfect for guests who appreciate outdoor activities and relaxation. | Represa do Brejo, Caminhos de Ferro, trails and nature parks, local artisan shops, weekly farmers market |
| Altiplano | An upscale neighborhood with modern amenities and easy access to main roads. It is popular among business travelers and those looking for a more luxurious experience. | Caruaru Shopping, good restaurants, fitness centers, nightlife options, event venues |
| Rendeiras | A developing area known for its artisan craftsmanship. It attracts tourists looking for unique local products and cultural experiences. | Centro Cultural, handcrafted markets, artisan workshops, local food stalls, event spaces |
| Além Paraíba | A suburban area with exploded housing development. Offers guests a variety of accommodation options while still being connected to the main city attractions. | community parks, shopping areas, local eateries, cultural centers, schools |
| Iputinga | An area known for its cultural events and local festivals throughout the year. It appeals to guests interested in experiencing Caruaru's lively culture. | Festival de Inverno, local music venues, theatre performances, artisan markets, carnival events |
| Bairro Novo | A family-friendly neighborhood that emphasizes community and local living. It appeals to visitors looking for a homey environment during their stay. | community parks, local bakeries, family-owned restaurants, farmer's markets, playgrounds |
Understanding Airbnb License Requirements & STR Laws in Caruaru (2026)
While Caruaru, Pernambuco, Brazil currently shows low STR regulations, specific Airbnb license requirements might still exist or change. Always verify the latest short term rental regulations and Airbnb license requirements directly with local government authorities for Caruaru to ensure full compliance before hosting.
(Source: AirROI data, 2026, based on 0% licensed listings)
Top Performing Airbnb Properties in Caruaru (2026)
Benchmark your potential! Explore examples of top-performing Airbnb properties in Caruarubased on Trailing Twelve Month (TTM) revenue. Analyze their characteristics, revenue, occupancy rate, and ADR to understand what drives success in this market.
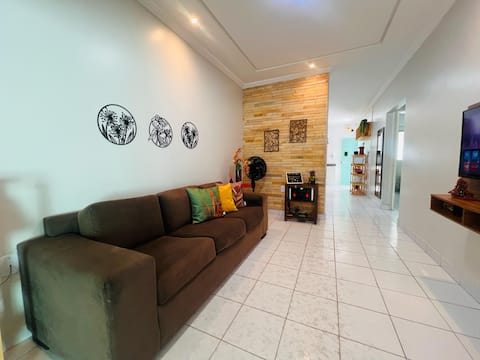
Estação 249 Caruaru / Seasonal house.
Entire Place • 2 bedrooms
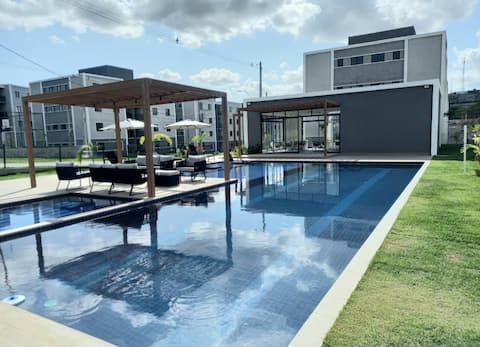
Complete apartment in Caruaru
Entire Place • 2 bedrooms
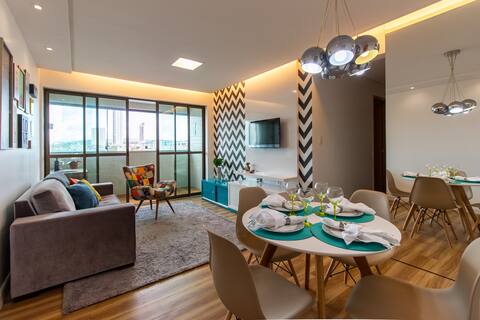
Modern and cozy in the capital of forró
Entire Place • 3 bedrooms
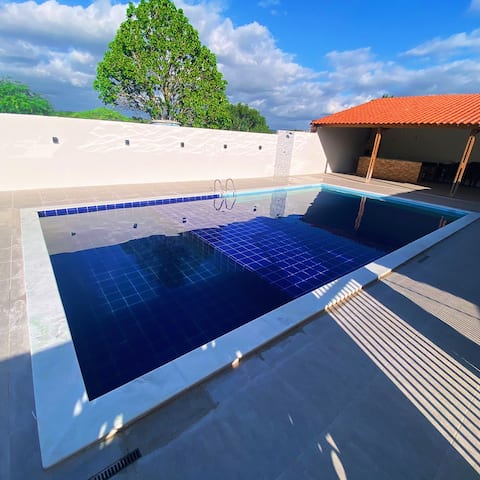
Farm with Leisure Area for 50 people
Entire Place • 3 bedrooms

Caruaru Raiz Flat
Entire Place • 1 bedroom
NEW apartment, near the mall
Entire Place • 2 bedrooms
Note: Performance varies based on location, size, amenities, seasonality, and management quality. Data reflects the past 12 months.
Top Performing Airbnb Hosts in Caruaru (2026)
Learn from the best! This table showcases top-performing Airbnb hosts in Caruaru based on the number of properties managed and estimated total revenue over the past year. Analyze their scale and performance metrics.
| Host Name | Properties | Grossing Revenue | Stay Reviews | Avg Rating |
|---|---|---|---|---|
| Alexandre | 18 | $35,621 | 650 | 4.66/5.0 |
| Fernanda Luiza (Villa Prime A | 5 | $27,644 | 231 | 4.88/5.0 |
| Cesar | 3 | $21,025 | 215 | 4.93/5.0 |
| Priscilla | 5 | $20,573 | 306 | 4.80/5.0 |
| Bauten Home Stay | 4 | $19,330 | 127 | 4.70/5.0 |
| Tiago | 4 | $16,058 | 85 | 4.75/5.0 |
| Erivaldo | 4 | $14,864 | 453 | 4.80/5.0 |
| Priscila Eveline | 2 | $14,739 | 216 | 4.90/5.0 |
| Dicilene | 2 | $14,128 | 54 | 4.66/5.0 |
| Viviane Mota | 1 | $13,851 | 57 | 4.98/5.0 |
Analyzing the strategies of top hosts, such as their property selection, pricing, and guest communication, can offer valuable lessons for optimizing your own Airbnb operations in Caruaru.
Dive Deeper: Advanced Caruaru STR Market Data (2026)
Ready to unlock more insights? AirROI provides access to advanced metrics and comprehensive Airbnb data for Caruaru. Explore detailed analytics beyond this report to refine your investment strategy, optimize pricing, and maximize your vacation rental profits.
Explore Advanced MetricsCaruaru Short-Term Rental Market Composition (2026): Property & Room Types
Room Type Distribution
Property Type Distribution
Market Composition Insights for Caruaru
- The Caruaru Airbnb market composition is heavily skewed towards Entire Home/Apt listings, which make up 79.9% of the 299 active rentals. This indicates strong guest preference for privacy and space.
- Looking at the property type distribution in Caruaru, Apartment/Condo properties are the most common (73.2%), reflecting the local real estate landscape.
- Houses represent a significant 16.4% portion, catering likely to families or larger groups.
- The presence of 9.4% Hotel/Boutique listings indicates integration with traditional hospitality.
- Smaller segments like others, outdoor/unique (combined 1.0%) offer potential for unique stay experiences.
Caruaru Airbnb Room Capacity Analysis (2026): Bedroom Distribution
Distribution of Listings by Number of Bedrooms
Room Capacity Insights for Caruaru
- The dominant room capacity in Caruaru is 2 bedrooms listings, making up 42.5% of the market. This suggests a strong demand for properties suitable for couples or solo travelers.
- Together, 2 bedrooms and 1 bedroom properties represent 77.6% of the active Airbnb listings in Caruaru, indicating a high concentration in these sizes.
- Listings with 3+ bedrooms (6.7%) represent a smaller niche, potentially indicating an underserved market for larger group accommodations in Caruaru.
Caruaru Vacation Rental Guest Capacity Trends (2026)
Distribution of Listings by Guest Capacity
Guest Capacity Insights for Caruaru
- The most common guest capacity trend in Caruaru vacation rentals is listings accommodating 4 guests (27.4%). This suggests the primary traveler segment is likely small families or groups.
- Properties designed for 4 guests and 2 guests dominate the Caruaru STR market, accounting for 41.1% of listings.
- 23.1% of properties accommodate 6+ guests, serving the market segment for larger families or group travel in Caruaru.
- On average, properties in Caruaru are equipped to host 3.7 guests.
Caruaru Airbnb Booking Patterns (2026): Available vs. Booked Days
Available Days Distribution
Booked Days Distribution
Booking Pattern Insights for Caruaru
- The most common availability pattern in Caruaru falls within the 271-366 days range, representing 77.9% of listings. This suggests many properties have significant open periods on their calendars.
- Approximately 92.6% of listings show high availability (181+ days open annually), indicating potential for increased bookings or specific owner usage patterns.
- For booked days, the 1-30 days range is most frequent in Caruaru (43.8%), reflecting common guest stay durations or potential owner blocking patterns.
- A notable 8.3% of properties secure long booking periods (181+ days booked per year), highlighting successful long-term rental strategies or significant owner usage.
Caruaru Airbnb Minimum Stay Requirements Analysis
Distribution of Listings by Minimum Night Requirement
1 Night
190 listings
63.5% of total
2 Nights
60 listings
20.1% of total
3 Nights
6 listings
2% of total
4-6 Nights
2 listings
0.7% of total
30+ Nights
41 listings
13.7% of total
Key Insights
- The most prevalent minimum stay requirement in Caruaru is 1 Night, adopted by 63.5% of listings. This highlights the market's preference for shorter, flexible bookings.
- A strong majority (83.6%) of the Caruaru Airbnb data shows acceptance of very short stays (1-2 nights), indicating a dynamic, high-turnover market.
- A significant segment (13.7%) caters to monthly stays (30+ nights) in Caruaru, pointing to opportunities in the extended-stay market.
Recommendations
- Align with the market by considering a 1 Night minimum stay, as 63.5% of Caruaru hosts use this setting.
- Explore offering discounts for stays of 30+ nights to attract the 13.7% of the market seeking extended stays.
- Adjust minimum nights based on seasonality – potentially shorter during low season and longer during peak demand periods in Caruaru.
Caruaru Airbnb Cancellation Policy Trends Analysis (2026)
Flexible
95 listings
32.1% of total
Moderate
86 listings
29.1% of total
Firm
83 listings
28% of total
Strict
32 listings
10.8% of total
Cancellation Policy Insights for Caruaru
- The prevailing Airbnb cancellation policy trend in Caruaru is Flexible, used by 32.1% of listings.
- There's a relatively balanced mix between guest-friendly (61.2%) and stricter (38.8%) policies, offering choices for different guest needs.
Recommendations for Hosts
- Consider adopting a Flexible policy to align with the 32.1% market standard in Caruaru.
- Using a Strict policy might deter some guests, as only 10.8% of listings use it. Evaluate if potential revenue protection outweighs possible lower booking rates.
- Regularly review your cancellation policy against competitors and market demand shifts in Caruaru.
Caruaru STR Booking Lead Time Analysis (2026)
Average Booking Lead Time by Month
Booking Lead Time Insights for Caruaru
- The overall average booking lead time for vacation rentals in Caruaru is 23 days.
- Guests book furthest in advance for stays during June (average 47 days), likely coinciding with peak travel demand or local events.
- The shortest booking windows occur for stays in February (average 11 days), indicating more last-minute travel plans during this time.
- Seasonally, Summer (25 days avg.) sees the longest lead times, while Fall (12 days avg.) has the shortest, reflecting typical travel planning cycles.
Recommendations for Hosts
- Use the overall average lead time (23 days) as a baseline for your pricing and availability strategy in Caruaru.
- For June stays, consider implementing length-of-stay discounts or slightly higher rates for bookings made less than 47 days out to capitalize on advance planning.
- During February, focus on last-minute booking availability and promotions, as guests book with very short notice (11 days avg.).
- Target marketing efforts for the Summer season well in advance (at least 25 days) to capture early planners.
- Monitor your own booking lead times against these Caruaru averages to identify opportunities for dynamic pricing adjustments.
Popular & Essential Airbnb Amenities in Caruaru (2026)
Amenity Prevalence
Amenity Insights for Caruaru
- Essential amenities in Caruaru that guests expect include: Wifi. Lacking these (this) could significantly impact bookings.
- Popular amenities like TV, Kitchen, Free parking on premises are common but not universal. Offering these can provide a competitive edge.
Recommendations for Hosts
- Ensure your listing includes all essential amenities for Caruaru: Wifi.
- Prioritize adding missing essentials: Wifi.
- Consider adding popular differentiators like TV or Kitchen to increase appeal.
- Highlight unique or less common amenities you offer (e.g., hot tub, dedicated workspace, EV charger) in your listing description and photos.
- Regularly check competitor amenities in Caruaru to stay competitive.
Caruaru Airbnb Guest Demographics & Profile Analysis (2026)
Guest Profile Summary for Caruaru
- The typical guest profile for Airbnb in Caruaru consists of primarily domestic travelers (98%), often arriving from nearby Pernambuco, typically belonging to the Post-2000s (Gen Z/Alpha) group (50%), primarily speaking Portuguese or English.
- Domestic travelers account for 97.7% of guests.
- Key international markets include Brazil (97.7%) and United States (0.4%).
- Top languages spoken are Portuguese (54.1%) followed by English (24.3%).
- A significant demographic segment is the Post-2000s (Gen Z/Alpha) group, representing 50% of guests.
Recommendations for Hosts
- Target domestic marketing efforts towards travelers from Pernambuco and Recife.
- Tailor amenities and listing descriptions to appeal to the dominant Post-2000s (Gen Z/Alpha) demographic (e.g., highlight fast WiFi, smart home features, local guides).
- Highlight unique local experiences or amenities relevant to the primary guest profile.
- Consider seasonal promotions aligned with peak travel times for key origin markets.
Nearby Short-Term Rental Market Comparison
How does the Caruaru Airbnb market stack up against its neighbors? Compare key performance metrics like average monthly revenue, ADR, and occupancy rates in surrounding areas to understand the broader regional STR landscape.
| Market | Active Properties | Monthly Revenue | Daily Rate | Avg. Occupancy |
|---|---|---|---|---|
| Passo de Camaragibe | 155 | $2,288 | $323.99 | 30% |
| Sirinhaém | 44 | $1,343 | $225.63 | 25% |
| Porto de Pedras | 434 | $1,180 | $167.35 | 31% |
| Japaratinga | 178 | $895 | $118.94 | 29% |
| Barra de São Miguel | 441 | $875 | $174.19 | 24% |
| Paripueira | 149 | $867 | $150.43 | 26% |
| Ipojuca | 4,298 | $847 | $118.24 | 35% |
| Tamandaré | 1,255 | $830 | $141.81 | 28% |
| São Miguel dos Milagres | 549 | $801 | $126.23 | 27% |
| Maragogi | 768 | $792 | $120.80 | 29% |