Bananeiras Airbnb Market Analysis 2026: Short Term Rental Data & Vacation Rental Statistics in Paraíba, Brazil
Is Airbnb profitable in Bananeiras in 2026? Explore comprehensive Airbnb analytics for Bananeiras, Paraíba, Brazil to uncover income potential. This 2026 STR market report for Bananeiras, based on AirROI data from February 2025 to January 2026, reveals key trends in the market of 228 active listings.
Whether you're considering an Airbnb investment in Bananeiras, optimizing your existing vacation rental, or exploring rental arbitrage opportunities, understanding the Bananeiras Airbnb data is crucial. Leveraging the low regulation environment is key to maximizing your short term rental income potential. Let's dive into the specifics.
Key Bananeiras Airbnb Performance Metrics Overview
Monthly Airbnb Revenue Variations & Income Potential in Bananeiras (2026)
Understanding the monthly revenue variations for Airbnb listings in Bananeiras is key to maximizing your short term rental income potential. Seasonality significantly impacts earnings. Our analysis, based on data from the past 12 months, shows that the peak revenue month for STRs in Bananeiras is typically June, while February often presents the lowest earnings, highlighting opportunities for strategic pricing adjustments during shoulder and low seasons. Explore the typical Airbnb income in Bananeiras across different performance tiers:
- Best-in-class properties (Top 10%) achieve $2,244+ monthly, often utilizing dynamic pricing and superior guest experiences.
- Strong performing properties (Top 25%) earn $1,309 or more, indicating effective management and desirable locations/amenities.
- Typical properties (Median) generate around $688 per month, representing the average market performance.
- Entry-level properties (Bottom 25%) see earnings around $348, often with potential for optimization.
Average Monthly Airbnb Earnings Trend in Bananeiras
Bananeiras Airbnb Occupancy Rate Trends (2026)
Maximize your bookings by understanding the Bananeiras STR occupancy trends. Seasonal demand shifts significantly influence how often properties are booked. Typically, Junesees the highest demand (peak season occupancy), while February experiences the lowest (low season). Effective strategies, like adjusting minimum stays or offering promotions, can boost occupancy during slower periods. Here's how different property tiers perform in Bananeiras:
- Best-in-class properties (Top 10%) achieve 53%+ occupancy, indicating high desirability and potentially optimized availability.
- Strong performing properties (Top 25%) maintain 36% or higher occupancy, suggesting good market fit and guest satisfaction.
- Typical properties (Median) have an occupancy rate around 21%.
- Entry-level properties (Bottom 25%) average 11% occupancy, potentially facing higher vacancy.
Average Monthly Occupancy Rate Trend in Bananeiras
Average Daily Rate (ADR) Airbnb Trends in Bananeiras (2026)
Effective short term rental pricing strategy in Bananeiras involves understanding monthly ADR fluctuations. The Average Daily Rate (ADR) for Airbnb in Bananeiras typically peaks in June and dips lowest during February. Leveraging Airbnb dynamic pricing tools or strategies based on this seasonality can significantly boost revenue. Here's a look at the typical nightly rates achieved:
- Best-in-class properties (Top 10%) command rates of $252+ per night, often due to premium features or locations.
- Strong performing properties (Top 25%) achieve nightly rates of $170 or more.
- Typical properties (Median) charge around $106 per night.
- Entry-level properties (Bottom 25%) earn around $70 per night.
Average Daily Rate (ADR) Trend by Month in Bananeiras
Get Live Bananeiras Market Intelligence 👇

Explore Real-time Analytics
Airbnb Seasonality Analysis & Trends in Bananeiras (2026)
Peak Season (June, July, December)
- Revenue averages $1,494 per month
- Occupancy rates average 32.1%
- Daily rates average $146
Shoulder Season
- Revenue averages $916 per month
- Occupancy maintains around 24.6%
- Daily rates hold near $127
Low Season (February, September, October)
- Revenue drops to average $743 per month
- Occupancy decreases to average 21.2%
- Daily rates adjust to average $123
Seasonality Insights for Bananeiras
- The Airbnb seasonality in Bananeiras shows highly seasonal trends requiring careful strategy. While the sections above show seasonal averages, it's also insightful to look at the extremes:
- During the high season, the absolute peak month showcases Bananeiras's highest earning potential, with monthly revenues capable of climbing to $1,991, occupancy reaching a high of 37.6%, and ADRs peaking at $168.
- Conversely, the slowest single month of the year, typically falling within the low season, marks the market's lowest point. In this month, revenue might dip to $664, occupancy could drop to 19.3%, and ADRs may adjust down to $114.
- Understanding both the seasonal averages and these monthly peaks and troughs in revenue, occupancy, and ADR is crucial for maximizing your Airbnb profit potential in Bananeiras.
Seasonal Strategies for Maximizing Profit
- Peak Season: Maximize revenue through premium pricing and potentially longer minimum stays. Ensure high availability.
- Low Season: Offer competitive pricing, special promotions (e.g., extended stay discounts), and flexible cancellation policies. Target off-season travelers like remote workers or budget-conscious guests.
- Shoulder Seasons: Implement dynamic pricing that balances peak and low rates. Target weekend travelers or specific events. Offer slightly more flexible terms than peak season.
- Regularly analyze your own performance against these Bananeiras seasonality benchmarks and adjust your pricing and availability strategy accordingly.
Best Areas for Airbnb Investment in Bananeiras (2026)
Exploring the top neighborhoods for short-term rentals in Bananeiras? This section highlights key areas, outlining why they are attractive for hosts and guests, along with notable local attractions. Consider these locations based on your target guest profile and investment strategy.
| Neighborhood / Area | Why Host Here? (Target Guests & Appeal) | Key Attractions & Landmarks |
|---|---|---|
| Centro de Bananeiras | The heart of the town, Centro offers a taste of local culture and easy access to amenities. It's ideal for travelers who want to experience the local lifestyle and historic architecture. | Igreja Matriz de Nossa Senhora do Livramento, Parque dos Pássaros, Casa do Teatro, feira livre, Caminho das Pedras |
| Serra da Jurema | This area is known for its natural beauty and tranquility, making it perfect for eco-tourists and those seeking relaxation in nature. | Cascata do Maracajá, trilhas na serra, mirante da serra, Caminhos do Campo, natureza exuberante |
| Caminho do Frio | A popular site for those seeking cooler weather and beautiful landscapes, great for mountain getaways, particularly in the winter months. | Mirante do Frio, Caminho do Frio festival, nature walks, gastronomia local, feiras de artesanato |
| Tremembé | A quaint neighborhood away from the hustle and bustle, offering a peaceful retreat and authentic Brazilian countryside experience. | trilhas e cachoeiras, agroturismo, cultura local, artesanato, comida típica |
| Barra de Guabiraba | A beautiful rural area known for its stunning landscapes and friendly locals, attracting visitors who appreciate nature and agriculture. | Vista para as montanhas, pastagens e plantações, cachoeiras, pontos de pesca, trilhas na mata |
| Rota do Frio | Famed for its scenic routes and picturesque views, perfect for road trippers and adventure seekers looking for off-the-beaten-path experiences. | Caminhos de fogueiras, pântano de Bananeiras, mini fazendas, propriedades rurais, atrações naturais |
| São José do Brejo do Cruz | A nearby community known for its local hospitality and agricultural tourism, providing a different perspective of the region. | mercado municipal, festas locais, praça central, gastronomia local, tradições culturais |
| Bairro São Bento | A vibrant neighborhood that showcases local life and culture, making it suitable for visitors who want to immerse themselves in the local scene. | parque local, cultura popular, artesanato, comida de rua, eventos comunitários |
Understanding Airbnb License Requirements & STR Laws in Bananeiras (2026)
While Bananeiras, Paraíba, Brazil currently shows low STR regulations, specific Airbnb license requirements might still exist or change. Always verify the latest short term rental regulations and Airbnb license requirements directly with local government authorities for Bananeiras to ensure full compliance before hosting.
(Source: AirROI data, 2026, finding no licensed listings among those analyzed)
Top Performing Airbnb Properties in Bananeiras (2026)
Benchmark your potential! Explore examples of top-performing Airbnb properties in Bananeirasbased on Trailing Twelve Month (TTM) revenue. Analyze their characteristics, revenue, occupancy rate, and ADR to understand what drives success in this market.
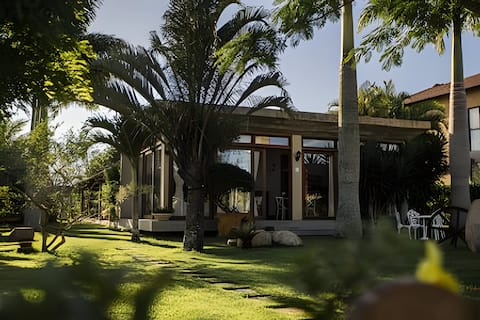
Charming getaway surrounded by greenery
Entire Place • 4 bedrooms
Águas da Serra in Bananeiras 5 suites, Casa Mary!
Entire Place • 5 bedrooms
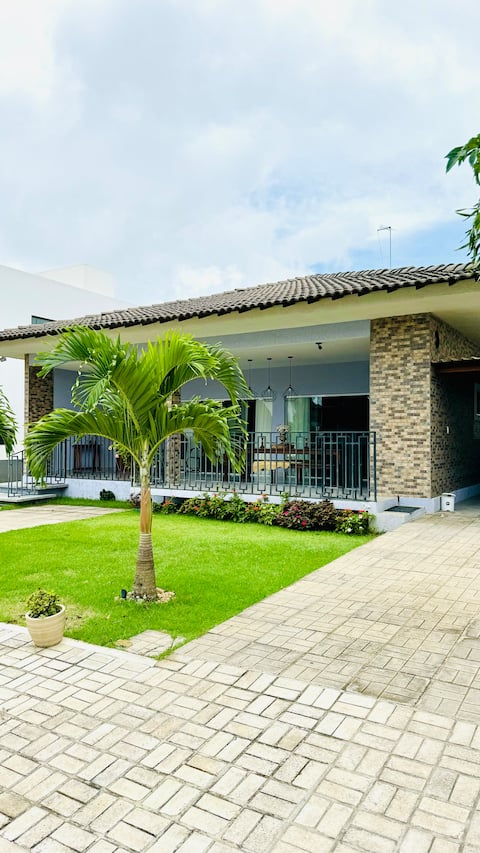
House in the Águas Da Serra condominium in Bananeiras.
Entire Place • 4 bedrooms

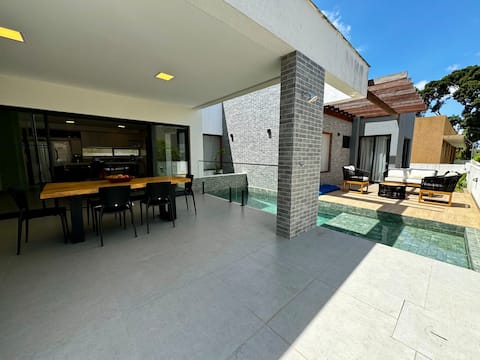
Cozy retreat with pool in Águas da Serra
Entire Place • 5 bedrooms
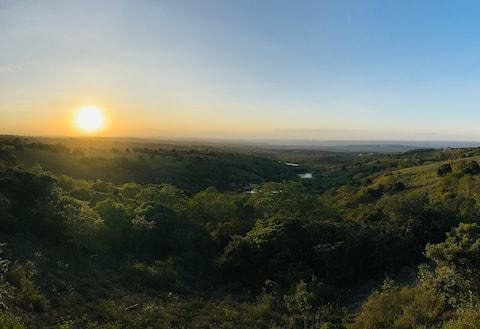
Nature, refinement and privacy
Entire Place • 1 bedroom
Spacious house in the Águas da Serra condominium
Entire Place • 4 bedrooms
Note: Performance varies based on location, size, amenities, seasonality, and management quality. Data reflects the past 12 months.
Top Performing Airbnb Hosts in Bananeiras (2026)
Learn from the best! This table showcases top-performing Airbnb hosts in Bananeiras based on the number of properties managed and estimated total revenue over the past year. Analyze their scale and performance metrics.
| Host Name | Properties | Grossing Revenue | Stay Reviews | Avg Rating |
|---|---|---|---|---|
| Refúgio Hospedagens | 3 | $112,161 | 33 | 4.90/5.0 |
| Kleber | 1 | $43,199 | 52 | 4.98/5.0 |
| Suelly | 1 | $41,739 | 21 | 5.00/5.0 |
| Bruno | 11 | $40,199 | 124 | 4.91/5.0 |
| Rafaela | 2 | $33,719 | 15 | 5.00/5.0 |
| Antonia De Oliveira Azevedo | 2 | $33,092 | 59 | 4.96/5.0 |
| Anny Karine | 3 | $33,058 | 143 | 4.70/5.0 |
| Ingrid | 1 | $31,100 | 4 | 4.75/5.0 |
| Nathalia | 1 | $30,928 | 79 | 4.90/5.0 |
| Luciana | 1 | $29,977 | 13 | 5.00/5.0 |
Analyzing the strategies of top hosts, such as their property selection, pricing, and guest communication, can offer valuable lessons for optimizing your own Airbnb operations in Bananeiras.
Dive Deeper: Advanced Bananeiras STR Market Data (2026)
Ready to unlock more insights? AirROI provides access to advanced metrics and comprehensive Airbnb data for Bananeiras. Explore detailed analytics beyond this report to refine your investment strategy, optimize pricing, and maximize your vacation rental profits.
Explore Advanced MetricsBananeiras Short-Term Rental Market Composition (2026): Property & Room Types
Room Type Distribution
Property Type Distribution
Market Composition Insights for Bananeiras
- The Bananeiras Airbnb market composition is heavily skewed towards Entire Home/Apt listings, which make up 96.1% of the 228 active rentals. This indicates strong guest preference for privacy and space.
- Looking at the property type distribution in Bananeiras, House properties are the most common (75%), reflecting the local real estate landscape.
- Houses represent a significant 75% portion, catering likely to families or larger groups.
- Smaller segments like hotel/boutique, outdoor/unique (combined 4.4%) offer potential for unique stay experiences.
Bananeiras Airbnb Room Capacity Analysis (2026): Bedroom Distribution
Distribution of Listings by Number of Bedrooms
Room Capacity Insights for Bananeiras
- The dominant room capacity in Bananeiras is 3 bedrooms listings, making up 30.7% of the market. This suggests a strong demand for properties suitable for families or small groups.
- Together, 3 bedrooms and 4 bedrooms properties represent 52.2% of the active Airbnb listings in Bananeiras, indicating a high concentration in these sizes.
- A significant 64.5% of listings offer 3+ bedrooms, catering to larger groups and families seeking more space in Bananeiras.
Bananeiras Vacation Rental Guest Capacity Trends (2026)
Distribution of Listings by Guest Capacity
Guest Capacity Insights for Bananeiras
- The most common guest capacity trend in Bananeiras vacation rentals is listings accommodating 8+ guests (60.5%). This suggests the primary traveler segment is likely larger groups.
- Properties designed for 8+ guests and 4 guests dominate the Bananeiras STR market, accounting for 75.9% of listings.
- 76.7% of properties accommodate 6+ guests, serving the market segment for larger families or group travel in Bananeiras.
- On average, properties in Bananeiras are equipped to host 6.7 guests.
Bananeiras Airbnb Booking Patterns (2026): Available vs. Booked Days
Available Days Distribution
Booked Days Distribution
Booking Pattern Insights for Bananeiras
- The most common availability pattern in Bananeiras falls within the 271-366 days range, representing 76.8% of listings. This suggests many properties have significant open periods on their calendars.
- Approximately 96.5% of listings show high availability (181+ days open annually), indicating potential for increased bookings or specific owner usage patterns.
- For booked days, the 31-90 days range is most frequent in Bananeiras (45.2%), reflecting common guest stay durations or potential owner blocking patterns.
- A notable 3.5% of properties secure long booking periods (181+ days booked per year), highlighting successful long-term rental strategies or significant owner usage.
Bananeiras Airbnb Minimum Stay Requirements Analysis
Distribution of Listings by Minimum Night Requirement
1 Night
58 listings
25.4% of total
2 Nights
108 listings
47.4% of total
3 Nights
2 listings
0.9% of total
30+ Nights
60 listings
26.3% of total
Key Insights
- The most prevalent minimum stay requirement in Bananeiras is 2 Nights, adopted by 47.4% of listings. This highlights the market's preference for shorter, flexible bookings.
- A strong majority (72.8%) of the Bananeiras Airbnb data shows acceptance of very short stays (1-2 nights), indicating a dynamic, high-turnover market.
- A significant segment (26.3%) caters to monthly stays (30+ nights) in Bananeiras, pointing to opportunities in the extended-stay market.
Recommendations
- Align with the market by considering a 2 Nights minimum stay, as 47.4% of Bananeiras hosts use this setting.
- If feasible, allowing 1-night stays, especially midweek or during low season, could capture last-minute bookings, as only 25.4% currently do.
- Explore offering discounts for stays of 30+ nights to attract the 26.3% of the market seeking extended stays.
- Adjust minimum nights based on seasonality – potentially shorter during low season and longer during peak demand periods in Bananeiras.
Bananeiras Airbnb Cancellation Policy Trends Analysis (2026)
Super Strict 60 Days
1 listings
0.4% of total
Flexible
73 listings
32.2% of total
Moderate
39 listings
17.2% of total
Firm
80 listings
35.2% of total
Strict
34 listings
15% of total
Cancellation Policy Insights for Bananeiras
- The prevailing Airbnb cancellation policy trend in Bananeiras is Firm, used by 35.2% of listings.
- A majority (50.2%) of hosts in Bananeiras utilize Firm or Strict policies, indicating a market where hosts prioritize booking security.
Recommendations for Hosts
- Consider adopting a Firm policy to align with the 35.2% market standard in Bananeiras.
- Regularly review your cancellation policy against competitors and market demand shifts in Bananeiras.
Bananeiras STR Booking Lead Time Analysis (2026)
Average Booking Lead Time by Month
Booking Lead Time Insights for Bananeiras
- The overall average booking lead time for vacation rentals in Bananeiras is 31 days.
- Guests book furthest in advance for stays during June (average 59 days), likely coinciding with peak travel demand or local events.
- The shortest booking windows occur for stays in March (average 16 days), indicating more last-minute travel plans during this time.
- Seasonally, Summer (41 days avg.) sees the longest lead times, while Spring (24 days avg.) has the shortest, reflecting typical travel planning cycles.
Recommendations for Hosts
- Use the overall average lead time (31 days) as a baseline for your pricing and availability strategy in Bananeiras.
- For June stays, consider implementing length-of-stay discounts or slightly higher rates for bookings made less than 59 days out to capitalize on advance planning.
- Target marketing efforts for the Summer season well in advance (at least 41 days) to capture early planners.
- Monitor your own booking lead times against these Bananeiras averages to identify opportunities for dynamic pricing adjustments.
Popular & Essential Airbnb Amenities in Bananeiras (2026)
Amenity Prevalence
Amenity Insights for Bananeiras
- Essential amenities in Bananeiras that guests expect include: Wifi, Kitchen. Lacking these (any) could significantly impact bookings.
- Popular amenities like TV, Free parking on premises, BBQ grill are common but not universal. Offering these can provide a competitive edge.
- A pool is a highly desired but not standard amenity, making it a key feature for attracting guests seeking leisure in Bananeiras.
Recommendations for Hosts
- Ensure your listing includes all essential amenities for Bananeiras: Wifi, Kitchen.
- Prioritize adding missing essentials: Wifi, Kitchen.
- Consider adding popular differentiators like TV or Free parking on premises to increase appeal.
- Highlight unique or less common amenities you offer (e.g., hot tub, dedicated workspace, EV charger) in your listing description and photos.
- Regularly check competitor amenities in Bananeiras to stay competitive.
Bananeiras Airbnb Guest Demographics & Profile Analysis (2026)
Guest Profile Summary for Bananeiras
- The typical guest profile for Airbnb in Bananeiras consists of primarily domestic travelers (97%), often arriving from nearby João Pessoa, typically belonging to the Post-2000s (Gen Z/Alpha) group (50%), primarily speaking Portuguese or English.
- Domestic travelers account for 96.7% of guests.
- Key international markets include Brazil (96.7%) and Paraíba (1.7%).
- Top languages spoken are Portuguese (58.5%) followed by English (23.6%).
- A significant demographic segment is the Post-2000s (Gen Z/Alpha) group, representing 50% of guests.
Recommendations for Hosts
- Target domestic marketing efforts towards travelers from João Pessoa and Natal.
- Tailor amenities and listing descriptions to appeal to the dominant Post-2000s (Gen Z/Alpha) demographic (e.g., highlight fast WiFi, smart home features, local guides).
- Highlight unique local experiences or amenities relevant to the primary guest profile.
- Consider seasonal promotions aligned with peak travel times for key origin markets.
Nearby Short-Term Rental Market Comparison
How does the Bananeiras Airbnb market stack up against its neighbors? Compare key performance metrics like average monthly revenue, ADR, and occupancy rates in surrounding areas to understand the broader regional STR landscape.
| Market | Active Properties | Monthly Revenue | Daily Rate | Avg. Occupancy |
|---|---|---|---|---|
| Ceará-Mirim | 33 | $1,211 | $232.73 | 23% |
| Tibau do Sul | 1,407 | $717 | $90.98 | 33% |
| Camaragibe | 28 | $680 | $118.56 | 27% |
| Areia | 25 | $576 | $80.31 | 27% |
| Extremoz | 40 | $547 | $131.07 | 23% |
| João Pessoa | 4,825 | $539 | $61.10 | 38% |
| Parnamirim | 317 | $513 | $87.28 | 28% |
| São Miguel do Gostoso | 280 | $502 | $98.86 | 24% |
| Touros | 96 | $458 | $111.03 | 22% |
| Conde | 354 | $451 | $83.76 | 25% |