Tibagi Airbnb Market Analysis 2025: Short Term Rental Data & Vacation Rental Statistics in Paraná, Brazil
Is Airbnb profitable in Tibagi in 2025? Explore comprehensive Airbnb analytics for Tibagi, Paraná, Brazil to uncover income potential. This 2025 STR market report for Tibagi, based on AirROI data from November 2024 to October 2025, reveals key trends in the niche market of 18 active listings.
Whether you're considering an Airbnb investment in Tibagi, optimizing your existing vacation rental, or exploring rental arbitrage opportunities, understanding the Tibagi Airbnb data is crucial. Leveraging the low regulation environment is key to maximizing your short term rental income potential. Let's dive into the specifics.
Key Tibagi Airbnb Performance Metrics Overview
Monthly Airbnb Revenue Variations & Income Potential in Tibagi (2025)
Understanding the monthly revenue variations for Airbnb listings in Tibagi is key to maximizing your short term rental income potential. Seasonality significantly impacts earnings. Our analysis, based on data from the past 12 months, shows that the peak revenue month for STRs in Tibagi is typically November, while May often presents the lowest earnings, highlighting opportunities for strategic pricing adjustments during shoulder and low seasons. Explore the typical Airbnb income in Tibagi across different performance tiers:
- Best-in-class properties (Top 10%) achieve $922+ monthly, often utilizing dynamic pricing and superior guest experiences.
- Strong performing properties (Top 25%) earn $530 or more, indicating effective management and desirable locations/amenities.
- Typical properties (Median) generate around $237 per month, representing the average market performance.
- Entry-level properties (Bottom 25%) see earnings around $88, often with potential for optimization.
Average Monthly Airbnb Earnings Trend in Tibagi
Tibagi Airbnb Occupancy Rate Trends (2025)
Maximize your bookings by understanding the Tibagi STR occupancy trends. Seasonal demand shifts significantly influence how often properties are booked. Typically, Marchsees the highest demand (peak season occupancy), while October experiences the lowest (low season). Effective strategies, like adjusting minimum stays or offering promotions, can boost occupancy during slower periods. Here's how different property tiers perform in Tibagi:
- Best-in-class properties (Top 10%) achieve 32%+ occupancy, indicating high desirability and potentially optimized availability.
- Strong performing properties (Top 25%) maintain 23% or higher occupancy, suggesting good market fit and guest satisfaction.
- Typical properties (Median) have an occupancy rate around 14%.
- Entry-level properties (Bottom 25%) average 8% occupancy, potentially facing higher vacancy.
Average Monthly Occupancy Rate Trend in Tibagi
Average Daily Rate (ADR) Airbnb Trends in Tibagi (2025)
Effective short term rental pricing strategy in Tibagi involves understanding monthly ADR fluctuations. The Average Daily Rate (ADR) for Airbnb in Tibagi typically peaks in June and dips lowest during February. Leveraging Airbnb dynamic pricing tools or strategies based on this seasonality can significantly boost revenue. Here's a look at the typical nightly rates achieved:
- Best-in-class properties (Top 10%) command rates of $127+ per night, often due to premium features or locations.
- Strong performing properties (Top 25%) achieve nightly rates of $71 or more.
- Typical properties (Median) charge around $30 per night.
- Entry-level properties (Bottom 25%) earn around $18 per night.
Average Daily Rate (ADR) Trend by Month in Tibagi
Get Live Tibagi Market Intelligence 👇

Explore Real-time Analytics
Airbnb Seasonality Analysis & Trends in Tibagi (2025)
Peak Season (November, March, January)
- Revenue averages $627 per month
- Occupancy rates average 24.6%
- Daily rates average $60
Shoulder Season
- Revenue averages $366 per month
- Occupancy maintains around 14.9%
- Daily rates hold near $61
Low Season (May, August, September)
- Revenue drops to average $265 per month
- Occupancy decreases to average 12.6%
- Daily rates adjust to average $62
Seasonality Insights for Tibagi
- The Airbnb seasonality in Tibagi shows highly seasonal trends requiring careful strategy. While the sections above show seasonal averages, it's also insightful to look at the extremes:
- During the high season, the absolute peak month showcases Tibagi's highest earning potential, with monthly revenues capable of climbing to $687, occupancy reaching a high of 27.8%, and ADRs peaking at $67.
- Conversely, the slowest single month of the year, typically falling within the low season, marks the market's lowest point. In this month, revenue might dip to $245, occupancy could drop to 9.7%, and ADRs may adjust down to $58.
- Understanding both the seasonal averages and these monthly peaks and troughs in revenue, occupancy, and ADR is crucial for maximizing your Airbnb profit potential in Tibagi.
Seasonal Strategies for Maximizing Profit
- Peak Season: Maximize revenue through premium pricing and potentially longer minimum stays. Ensure high availability.
- Low Season: Offer competitive pricing, special promotions (e.g., extended stay discounts), and flexible cancellation policies. Target off-season travelers like remote workers or budget-conscious guests.
- Shoulder Seasons: Implement dynamic pricing that balances peak and low rates. Target weekend travelers or specific events. Offer slightly more flexible terms than peak season.
- Regularly analyze your own performance against these Tibagi seasonality benchmarks and adjust your pricing and availability strategy accordingly.
Best Areas for Airbnb Investment in Tibagi (2025)
Exploring the top neighborhoods for short-term rentals in Tibagi? This section highlights key areas, outlining why they are attractive for hosts and guests, along with notable local attractions. Consider these locations based on your target guest profile and investment strategy.
| Neighborhood / Area | Why Host Here? (Target Guests & Appeal) | Key Attractions & Landmarks |
|---|---|---|
| Cachoeira do São Jorge | A stunning natural beauty spot famous for its waterfalls and lush landscapes, attracting nature lovers and adventure seekers. | Cachoeira do São Jorge, Trilha do Rio das Pedras, Parque Estadual Campos do Jordão, Cânion do Itambé |
| Centro de Tibagi | The vibrant heart of Tibagi, offering cultural experiences, local cuisine, and proximity to historical sites. Attracts travelers looking for an authentic city experience. | Igreja de São José, Cascata do Salto do Tigre, Museu Histórico de Tibagi, Praça da Liberdade |
| Represa do Rio Tibagi | An ideal location for water sports and outdoor activities, making it a favorite for families and groups seeking relaxation by the water. | Represa do Rio Tibagi, pesca esportiva, trilhas para caminhadas, praias fluviais |
| Estrada do Vinho | A scenic route known for its wineries and local produce. Visitors enjoy tastings and tours, perfect for culinary enthusiasts. | vinícolas locais, degustação de vinhos, Festa do Vinho, Caminho do Vinho |
| Serra do Mar | This mountainous region offers breathtaking views and hiking opportunities, attracting eco-tourists and those looking for a peaceful retreat. | Parque Nacional de Campos do Jordão, Trilhas de montanha, Mirantes, Observação de aves |
| Caminho do Ouro | Historically significant route known for its gold mining past, it attracts tourists interested in history and outdoor exploration. | Estrada Real, ruínas de garimpos, tradições locais, turismo cultural |
| Pico do Paraná | The highest peak in Paraná, it draws hiking enthusiasts and offers stunning vistas, making it ideal for adventure tourism. | trilhas desafiadoras, mirantes, natureza exuberante, escaladas |
| Serra do Tigre | A region known for its breathtaking landscapes and diverse fauna, attracting nature enthusiasts and those seeking tranquility away from the city. | parques naturais, observar a fauna, caminhadas, pontos de vista |
Understanding Airbnb License Requirements & STR Laws in Tibagi (2025)
While Tibagi, Paraná, Brazil currently shows low STR regulations, specific Airbnb license requirements might still exist or change. Always verify the latest short term rental regulations and Airbnb license requirements directly with local government authorities for Tibagi to ensure full compliance before hosting.
(Source: AirROI data, 2025, finding no licensed listings among those analyzed)
Top Performing Airbnb Properties in Tibagi (2025)
Benchmark your potential! Explore examples of top-performing Airbnb properties in Tibagibased on Trailing Twelve Month (TTM) revenue. Analyze their characteristics, revenue, occupancy rate, and ADR to understand what drives success in this market.
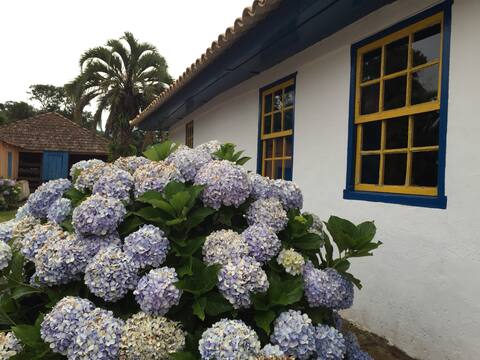
Ancient farmhouse next to Guartela Canyon
Entire Place • 5 bedrooms
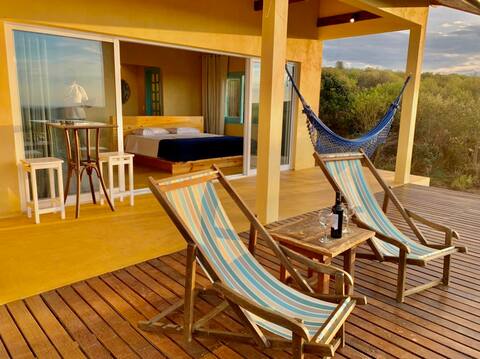
Cozy cottage overlooking Guartelá Canyon
Private Room • 1 bedroom
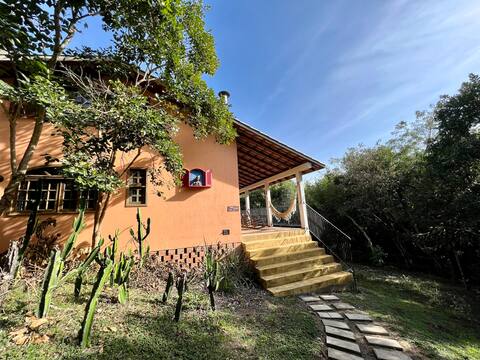
Chalé Curiango - Guartelá Canyon
Entire Place • 1 bedroom
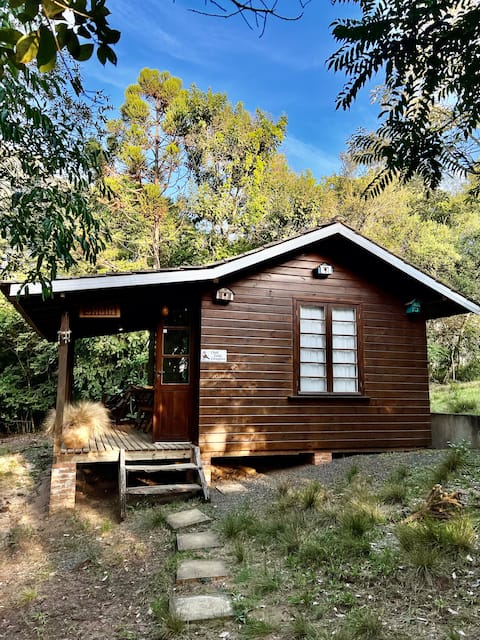
Chalé Sabiá - Guartelá Canyon
Entire Place • 1 bedroom
Chalé Pica-pau - Guartelá Canyon
Entire Place • 1 bedroom
Chalé Tangará - Guartelá Canyon
Entire Place • 1 bedroom
Note: Performance varies based on location, size, amenities, seasonality, and management quality. Data reflects the past 12 months.
Top Performing Airbnb Hosts in Tibagi (2025)
Learn from the best! This table showcases top-performing Airbnb hosts in Tibagi based on the number of properties managed and estimated total revenue over the past year. Analyze their scale and performance metrics.
| Host Name | Properties | Grossing Revenue | Stay Reviews | Avg Rating |
|---|---|---|---|---|
| Pousada Sítio Aguaraguazu | 5 | $25,997 | 8 | 5.00/5.0 |
| Maria Claudia | 1 | $15,083 | 1 | Not Rated |
| Patricia | 1 | $2,227 | 2 | Not Rated |
| Giulia Maria | 2 | $1,916 | 9 | 4.71/5.0 |
| Homero Jorge Davascio | 1 | $1,561 | 99 | 4.98/5.0 |
| Sirlene | 1 | $1,106 | 3 | 5.00/5.0 |
| Andreia | 2 | $990 | 53 | 4.75/5.0 |
| Andreia | 1 | $866 | 77 | 4.64/5.0 |
| Shaylon | 1 | $621 | 2 | Not Rated |
| Sueli | 3 | $464 | 33 | 4.47/5.0 |
Analyzing the strategies of top hosts, such as their property selection, pricing, and guest communication, can offer valuable lessons for optimizing your own Airbnb operations in Tibagi.
Dive Deeper: Advanced Tibagi STR Market Data (2025)
Ready to unlock more insights? AirROI provides access to advanced metrics and comprehensive Airbnb data for Tibagi. Explore detailed analytics beyond this report to refine your investment strategy, optimize pricing, and maximize your vacation rental profits.
Explore Advanced MetricsTibagi Short-Term Rental Market Composition (2025): Property & Room Types
Room Type Distribution
Property Type Distribution
Market Composition Insights for Tibagi
- The Tibagi Airbnb market composition is heavily skewed towards Private Room listings, which make up 61.1% of the 18 active rentals. This indicates strong guest preference for privacy and space.
- Looking at the property type distribution in Tibagi, Hotel/Boutique properties are the most common (33.3%), reflecting the local real estate landscape.
- Houses represent a significant 22.2% portion, catering likely to families or larger groups.
- The presence of 33.3% Hotel/Boutique listings indicates integration with traditional hospitality.
Tibagi Airbnb Room Capacity Analysis (2025): Bedroom Distribution
Distribution of Listings by Number of Bedrooms
Room Capacity Insights for Tibagi
- The dominant room capacity in Tibagi is 1 bedroom listings, making up 38.9% of the market. This suggests a strong demand for properties suitable for couples or solo travelers.
- Together, 1 bedroom and 5+ bedrooms properties represent 61.1% of the active Airbnb listings in Tibagi, indicating a high concentration in these sizes.
- A significant 27.8% of listings offer 3+ bedrooms, catering to larger groups and families seeking more space in Tibagi.
Tibagi Vacation Rental Guest Capacity Trends (2025)
Distribution of Listings by Guest Capacity
Guest Capacity Insights for Tibagi
- The most common guest capacity trend in Tibagi vacation rentals is listings accommodating 2 guests (33.3%). This suggests the primary traveler segment is likely couples or solo travelers.
- Properties designed for 2 guests and 8+ guests dominate the Tibagi STR market, accounting for 55.5% of listings.
- 27.8% of properties accommodate 6+ guests, serving the market segment for larger families or group travel in Tibagi.
- On average, properties in Tibagi are equipped to host 2.8 guests.
Tibagi Airbnb Booking Patterns (2025): Available vs. Booked Days
Available Days Distribution
Booked Days Distribution
Booking Pattern Insights for Tibagi
- The most common availability pattern in Tibagi falls within the 271-366 days range, representing 94.4% of listings. This suggests many properties have significant open periods on their calendars.
- Approximately 100.0% of listings show high availability (181+ days open annually), indicating potential for increased bookings or specific owner usage patterns.
- For booked days, the 1-30 days range is most frequent in Tibagi (50%), reflecting common guest stay durations or potential owner blocking patterns.
Tibagi Airbnb Minimum Stay Requirements Analysis
Distribution of Listings by Minimum Night Requirement
1 Night
11 listings
61.1% of total
2 Nights
2 listings
11.1% of total
30+ Nights
5 listings
27.8% of total
Key Insights
- The most prevalent minimum stay requirement in Tibagi is 1 Night, adopted by 61.1% of listings. This highlights the market's preference for shorter, flexible bookings.
- A strong majority (72.2%) of the Tibagi Airbnb data shows acceptance of very short stays (1-2 nights), indicating a dynamic, high-turnover market.
- A significant segment (27.8%) caters to monthly stays (30+ nights) in Tibagi, pointing to opportunities in the extended-stay market.
Recommendations
- Align with the market by considering a 1 Night minimum stay, as 61.1% of Tibagi hosts use this setting.
- Explore offering discounts for stays of 30+ nights to attract the 27.8% of the market seeking extended stays.
- Adjust minimum nights based on seasonality – potentially shorter during low season and longer during peak demand periods in Tibagi.
Tibagi Airbnb Cancellation Policy Trends Analysis (2025)
Flexible
11 listings
61.1% of total
Moderate
3 listings
16.7% of total
Firm
4 listings
22.2% of total
Cancellation Policy Insights for Tibagi
- The prevailing Airbnb cancellation policy trend in Tibagi is Flexible, used by 61.1% of listings.
- The market strongly favors guest-friendly terms, with 77.8% of listings offering Flexible or Moderate policies. This suggests guests in Tibagi may expect booking flexibility.
Recommendations for Hosts
- Consider adopting a Flexible policy to align with the 61.1% market standard in Tibagi.
- Given the high prevalence of Flexible policies (61.1%), offering this can enhance booking appeal, especially during shoulder seasons.
- Regularly review your cancellation policy against competitors and market demand shifts in Tibagi.
Tibagi STR Booking Lead Time Analysis (2025)
Average Booking Lead Time by Month
Booking Lead Time Insights for Tibagi
- The overall average booking lead time for vacation rentals in Tibagi is 20 days.
- Guests book furthest in advance for stays during June (average 45 days), likely coinciding with peak travel demand or local events.
- The shortest booking windows occur for stays in August (average 7 days), indicating more last-minute travel plans during this time.
- Seasonally, Fall (26 days avg.) sees the longest lead times, while Spring (16 days avg.) has the shortest, reflecting typical travel planning cycles.
Recommendations for Hosts
- Use the overall average lead time (20 days) as a baseline for your pricing and availability strategy in Tibagi.
- For June stays, consider implementing length-of-stay discounts or slightly higher rates for bookings made less than 45 days out to capitalize on advance planning.
- During August, focus on last-minute booking availability and promotions, as guests book with very short notice (7 days avg.).
- Target marketing efforts for the Fall season well in advance (at least 26 days) to capture early planners.
- Monitor your own booking lead times against these Tibagi averages to identify opportunities for dynamic pricing adjustments.
Popular & Essential Airbnb Amenities in Tibagi (2025)
Amenity Prevalence
Amenity Insights for Tibagi
- Popular amenities like Free parking on premises, Wifi, TV are common but not universal. Offering these can provide a competitive edge.
- Warning: Wifi is not universally provided but is considered essential globally. Ensure reliable Wifi is offered.
Recommendations for Hosts
- Consider adding popular differentiators like Free parking on premises or Wifi to increase appeal.
- Highlight unique or less common amenities you offer (e.g., hot tub, dedicated workspace, EV charger) in your listing description and photos.
- Regularly check competitor amenities in Tibagi to stay competitive.
Tibagi Airbnb Guest Demographics & Profile Analysis (2025)
Guest Profile Summary for Tibagi
- The typical guest profile for Airbnb in Tibagi consists of primarily domestic travelers (93%), often arriving from nearby Curitiba, typically belonging to the Post-2000s (Gen Z/Alpha) group (50%), primarily speaking Portuguese or English.
- Domestic travelers account for 92.9% of guests.
- Key international markets include Brazil (92.9%) and Netherlands (3.6%).
- Top languages spoken are Portuguese (47.6%) followed by English (23.8%).
- A significant demographic segment is the Post-2000s (Gen Z/Alpha) group, representing 50% of guests.
Recommendations for Hosts
- Target domestic marketing efforts towards travelers from Curitiba and Paraná.
- Tailor amenities and listing descriptions to appeal to the dominant Post-2000s (Gen Z/Alpha) demographic (e.g., highlight fast WiFi, smart home features, local guides).
- Highlight unique local experiences or amenities relevant to the primary guest profile.
- Consider seasonal promotions aligned with peak travel times for key origin markets.
Nearby Short-Term Rental Market Comparison
How does the Tibagi Airbnb market stack up against its neighbors? Compare key performance metrics like average monthly revenue, ADR, and occupancy rates in surrounding areas to understand the broader regional STR landscape.
| Market | Active Properties | Monthly Revenue | Daily Rate | Avg. Occupancy |
|---|---|---|---|---|
| Arandu | 37 | $1,727 | $270.80 | 27% |
| Itaí | 87 | $1,506 | $258.77 | 23% |
| Almirante Tamandaré | 16 | $1,341 | $118.94 | 40% |
| Campo Magro | 22 | $1,218 | $131.10 | 34% |
| Quatro Barras | 35 | $1,175 | $156.39 | 31% |
| Balsa Nova | 54 | $1,046 | $129.18 | 29% |
| Campo Largo | 62 | $977 | $146.21 | 38% |
| Campina Grande do Sul | 92 | $957 | $108.29 | 33% |
| Araucária | 12 | $850 | $68.02 | 43% |
| Carlópolis | 31 | $834 | $148.70 | 26% |