Pato Branco Airbnb Market Analysis 2026: Short Term Rental Data & Vacation Rental Statistics in Paraná, Brazil
Is Airbnb profitable in Pato Branco in 2026? Explore comprehensive Airbnb analytics for Pato Branco, Paraná, Brazil to uncover income potential. This 2026 STR market report for Pato Branco, based on AirROI data from February 2025 to January 2026, reveals key trends in the niche market of 87 active listings.
Whether you're considering an Airbnb investment in Pato Branco, optimizing your existing vacation rental, or exploring rental arbitrage opportunities, understanding the Pato Branco Airbnb data is crucial. Leveraging the low regulation environment is key to maximizing your short term rental income potential. Let's dive into the specifics.
Key Pato Branco Airbnb Performance Metrics Overview
Monthly Airbnb Revenue Variations & Income Potential in Pato Branco (2026)
Understanding the monthly revenue variations for Airbnb listings in Pato Branco is key to maximizing your short term rental income potential. Seasonality significantly impacts earnings. Our analysis, based on data from the past 12 months, shows that the peak revenue month for STRs in Pato Branco is typically December, while September often presents the lowest earnings, highlighting opportunities for strategic pricing adjustments during shoulder and low seasons. Explore the typical Airbnb income in Pato Branco across different performance tiers:
- Best-in-class properties (Top 10%) achieve $863+ monthly, often utilizing dynamic pricing and superior guest experiences.
- Strong performing properties (Top 25%) earn $593 or more, indicating effective management and desirable locations/amenities.
- Typical properties (Median) generate around $303 per month, representing the average market performance.
- Entry-level properties (Bottom 25%) see earnings around $122, often with potential for optimization.
Average Monthly Airbnb Earnings Trend in Pato Branco
Pato Branco Airbnb Occupancy Rate Trends (2026)
Maximize your bookings by understanding the Pato Branco STR occupancy trends. Seasonal demand shifts significantly influence how often properties are booked. Typically, Decembersees the highest demand (peak season occupancy), while May experiences the lowest (low season). Effective strategies, like adjusting minimum stays or offering promotions, can boost occupancy during slower periods. Here's how different property tiers perform in Pato Branco:
- Best-in-class properties (Top 10%) achieve 74%+ occupancy, indicating high desirability and potentially optimized availability.
- Strong performing properties (Top 25%) maintain 53% or higher occupancy, suggesting good market fit and guest satisfaction.
- Typical properties (Median) have an occupancy rate around 28%.
- Entry-level properties (Bottom 25%) average 13% occupancy, potentially facing higher vacancy.
Average Monthly Occupancy Rate Trend in Pato Branco
Average Daily Rate (ADR) Airbnb Trends in Pato Branco (2026)
Effective short term rental pricing strategy in Pato Branco involves understanding monthly ADR fluctuations. The Average Daily Rate (ADR) for Airbnb in Pato Branco typically peaks in October and dips lowest during February. Leveraging Airbnb dynamic pricing tools or strategies based on this seasonality can significantly boost revenue. Here's a look at the typical nightly rates achieved:
- Best-in-class properties (Top 10%) command rates of $53+ per night, often due to premium features or locations.
- Strong performing properties (Top 25%) achieve nightly rates of $38 or more.
- Typical properties (Median) charge around $32 per night.
- Entry-level properties (Bottom 25%) earn around $25 per night.
Average Daily Rate (ADR) Trend by Month in Pato Branco
Get Live Pato Branco Market Intelligence 👇

Explore Real-time Analytics
Airbnb Seasonality Analysis & Trends in Pato Branco (2026)
Peak Season (December, March, October)
- Revenue averages $469 per month
- Occupancy rates average 41.0%
- Daily rates average $36
Shoulder Season
- Revenue averages $395 per month
- Occupancy maintains around 35.3%
- Daily rates hold near $36
Low Season (January, May, September)
- Revenue drops to average $341 per month
- Occupancy decreases to average 29.7%
- Daily rates adjust to average $36
Seasonality Insights for Pato Branco
- The Airbnb seasonality in Pato Branco shows moderate seasonality with distinct peak and low periods. While the sections above show seasonal averages, it's also insightful to look at the extremes:
- During the high season, the absolute peak month showcases Pato Branco's highest earning potential, with monthly revenues capable of climbing to $515, occupancy reaching a high of 44.3%, and ADRs peaking at $37.
- Conversely, the slowest single month of the year, typically falling within the low season, marks the market's lowest point. In this month, revenue might dip to $320, occupancy could drop to 26.7%, and ADRs may adjust down to $34.
- Understanding both the seasonal averages and these monthly peaks and troughs in revenue, occupancy, and ADR is crucial for maximizing your Airbnb profit potential in Pato Branco.
Seasonal Strategies for Maximizing Profit
- Peak Season: Maximize revenue through premium pricing and potentially longer minimum stays. Ensure high availability.
- Low Season: Offer competitive pricing, special promotions (e.g., extended stay discounts), and flexible cancellation policies. Target off-season travelers like remote workers or budget-conscious guests.
- Shoulder Seasons: Implement dynamic pricing that balances peak and low rates. Target weekend travelers or specific events. Offer slightly more flexible terms than peak season.
- Regularly analyze your own performance against these Pato Branco seasonality benchmarks and adjust your pricing and availability strategy accordingly.
Best Areas for Airbnb Investment in Pato Branco (2026)
Exploring the top neighborhoods for short-term rentals in Pato Branco? This section highlights key areas, outlining why they are attractive for hosts and guests, along with notable local attractions. Consider these locations based on your target guest profile and investment strategy.
| Neighborhood / Area | Why Host Here? (Target Guests & Appeal) | Key Attractions & Landmarks |
|---|---|---|
| Centro | The heart of Pato Branco, offering easy access to shops, restaurants, and cultural sites. Ideal for tourists and locals alike. | Pato Branco Municipal Park, Igreja Matriz de Pato Branco, Casa da Cultura, Shopping Pato Branco, Museu Histórico de Pato Branco |
| Água Branca | A tranquil residential area with green spaces, perfect for families and those looking for a relaxing stay. | Parque das Aves, Cascata do Espelho, nature trails, Picnic areas |
| Jardim Primaveras | Known for its beautiful homes and gardens, this neighborhood attracts visitors looking for a peaceful retreat. | Local parks, flower gardens, community events |
| São João | A vibrant area with local markets and shops, showcasing the local lifestyle and culture of Pato Branco. | Local markets, cultural festivals, craft fairs |
| Bairro Planalto | Located near key urban amenities, this area appeals to investors looking for convenient access for travelers. | shopping centers, restaurants, parks |
| Bairro do Lago | A scenic neighborhood centered around a lake, providing opportunities for outdoor activities and relaxation. | Lago de Pato Branco, water sports, walking trails |
| Bairro São Pedro | This area is undergoing development and offers great potential for future growth and demand for accommodations. | new developments, local eateries, community parks |
| Zona Rural | For those interested in agritourism, this rural area offers a unique experience with farms and nature. | farm tours, nature experiences, local produce markets |
Understanding Airbnb License Requirements & STR Laws in Pato Branco (2026)
While Pato Branco, Paraná, Brazil currently shows low STR regulations, specific Airbnb license requirements might still exist or change. Always verify the latest short term rental regulations and Airbnb license requirements directly with local government authorities for Pato Branco to ensure full compliance before hosting.
(Source: AirROI data, 2026, based on 1% licensed listings)
Top Performing Airbnb Properties in Pato Branco (2026)
Benchmark your potential! Explore examples of top-performing Airbnb properties in Pato Brancobased on Trailing Twelve Month (TTM) revenue. Analyze their characteristics, revenue, occupancy rate, and ADR to understand what drives success in this market.

Luxury apartment, spacious with barbecue area
Entire Place • 3 bedrooms
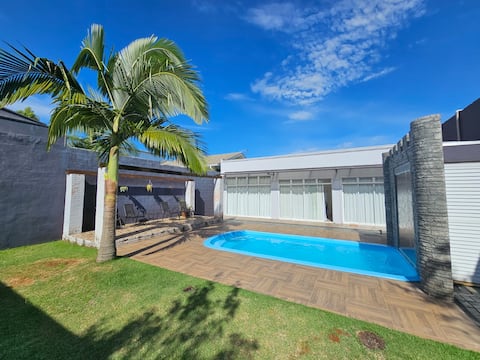
Large house with pool and perfect for rest.
Entire Place • 3 bedrooms

Central apartment near the Hospital
Entire Place • 3 bedrooms

Apartment 150 meters from the Policlinica hospital with 2 garages
Entire Place • 2 bedrooms
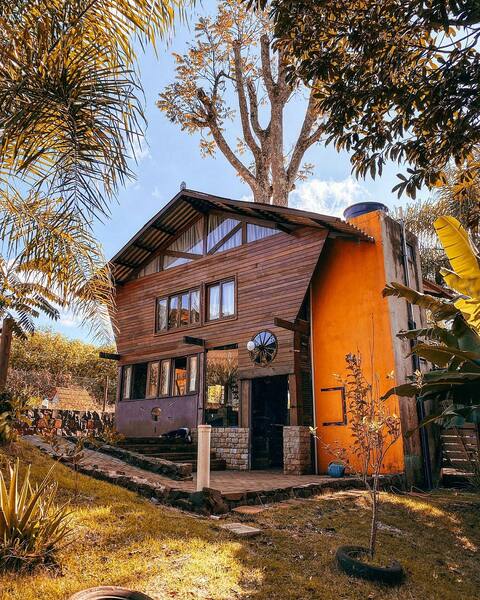
Treehouse Farm Waterfall Hydro Pool table Trail
Entire Place • N/A

House near the airport
Entire Place • 2 bedrooms
Note: Performance varies based on location, size, amenities, seasonality, and management quality. Data reflects the past 12 months.
Top Performing Airbnb Hosts in Pato Branco (2026)
Learn from the best! This table showcases top-performing Airbnb hosts in Pato Branco based on the number of properties managed and estimated total revenue over the past year. Analyze their scale and performance metrics.
| Host Name | Properties | Grossing Revenue | Stay Reviews | Avg Rating |
|---|---|---|---|---|
| Dani | 8 | $27,870 | 132 | 4.92/5.0 |
| Davi | 11 | $22,599 | 301 | 4.98/5.0 |
| Joseane Magda | 2 | $16,434 | 50 | 5.00/5.0 |
| Sandra Paula | 2 | $15,470 | 22 | 5.00/5.0 |
| Eloana Fátima | 11 | $14,957 | 190 | 4.72/5.0 |
| Simone Maria | 4 | $13,499 | 54 | 4.97/5.0 |
| Glaucia Lazzarini | 1 | $11,289 | 75 | 5.00/5.0 |
| Luisa | 3 | $10,390 | 110 | 4.90/5.0 |
| Denise | 12 | $9,370 | 59 | 4.90/5.0 |
| Fabiano | 2 | $8,572 | 81 | 4.96/5.0 |
Analyzing the strategies of top hosts, such as their property selection, pricing, and guest communication, can offer valuable lessons for optimizing your own Airbnb operations in Pato Branco.
Dive Deeper: Advanced Pato Branco STR Market Data (2026)
Ready to unlock more insights? AirROI provides access to advanced metrics and comprehensive Airbnb data for Pato Branco. Explore detailed analytics beyond this report to refine your investment strategy, optimize pricing, and maximize your vacation rental profits.
Explore Advanced MetricsPato Branco Short-Term Rental Market Composition (2026): Property & Room Types
Room Type Distribution
Property Type Distribution
Market Composition Insights for Pato Branco
- The Pato Branco Airbnb market composition is heavily skewed towards Entire Home/Apt listings, which make up 90.8% of the 87 active rentals. This indicates strong guest preference for privacy and space.
- Looking at the property type distribution in Pato Branco, Apartment/Condo properties are the most common (57.5%), reflecting the local real estate landscape.
- Houses represent a significant 40.2% portion, catering likely to families or larger groups.
- Smaller segments like unique stays, hotel/boutique (combined 2.2%) offer potential for unique stay experiences.
Pato Branco Airbnb Room Capacity Analysis (2026): Bedroom Distribution
Distribution of Listings by Number of Bedrooms
Room Capacity Insights for Pato Branco
- The dominant room capacity in Pato Branco is 1 bedroom listings, making up 39.1% of the market. This suggests a strong demand for properties suitable for couples or solo travelers.
- Together, 1 bedroom and 2 bedrooms properties represent 70.1% of the active Airbnb listings in Pato Branco, indicating a high concentration in these sizes.
Pato Branco Vacation Rental Guest Capacity Trends (2026)
Distribution of Listings by Guest Capacity
Guest Capacity Insights for Pato Branco
- The most common guest capacity trend in Pato Branco vacation rentals is listings accommodating 3 guests (24.1%). This suggests the primary traveler segment is likely small families or groups.
- Properties designed for 3 guests and 4 guests dominate the Pato Branco STR market, accounting for 42.5% of listings.
- 25.2% of properties accommodate 6+ guests, serving the market segment for larger families or group travel in Pato Branco.
- On average, properties in Pato Branco are equipped to host 3.9 guests.
Pato Branco Airbnb Booking Patterns (2026): Available vs. Booked Days
Available Days Distribution
Booked Days Distribution
Booking Pattern Insights for Pato Branco
- The most common availability pattern in Pato Branco falls within the 271-366 days range, representing 66.7% of listings. This suggests many properties have significant open periods on their calendars.
- Approximately 94.3% of listings show high availability (181+ days open annually), indicating potential for increased bookings or specific owner usage patterns.
- For booked days, the 31-90 days range is most frequent in Pato Branco (35.6%), reflecting common guest stay durations or potential owner blocking patterns.
- A notable 8.0% of properties secure long booking periods (181+ days booked per year), highlighting successful long-term rental strategies or significant owner usage.
Pato Branco Airbnb Minimum Stay Requirements Analysis
Distribution of Listings by Minimum Night Requirement
1 Night
38 listings
43.7% of total
2 Nights
20 listings
23% of total
3 Nights
5 listings
5.7% of total
4-6 Nights
1 listings
1.1% of total
30+ Nights
23 listings
26.4% of total
Key Insights
- The most prevalent minimum stay requirement in Pato Branco is 1 Night, adopted by 43.7% of listings. This highlights the market's preference for shorter, flexible bookings.
- A strong majority (66.7%) of the Pato Branco Airbnb data shows acceptance of very short stays (1-2 nights), indicating a dynamic, high-turnover market.
- A significant segment (26.4%) caters to monthly stays (30+ nights) in Pato Branco, pointing to opportunities in the extended-stay market.
Recommendations
- Align with the market by considering a 1 Night minimum stay, as 43.7% of Pato Branco hosts use this setting.
- Explore offering discounts for stays of 30+ nights to attract the 26.4% of the market seeking extended stays.
- Adjust minimum nights based on seasonality – potentially shorter during low season and longer during peak demand periods in Pato Branco.
Pato Branco Airbnb Cancellation Policy Trends Analysis (2026)
Flexible
38 listings
43.7% of total
Moderate
22 listings
25.3% of total
Firm
15 listings
17.2% of total
Strict
12 listings
13.8% of total
Cancellation Policy Insights for Pato Branco
- The prevailing Airbnb cancellation policy trend in Pato Branco is Flexible, used by 43.7% of listings.
- There's a relatively balanced mix between guest-friendly (69.0%) and stricter (31.0%) policies, offering choices for different guest needs.
Recommendations for Hosts
- Consider adopting a Flexible policy to align with the 43.7% market standard in Pato Branco.
- Using a Strict policy might deter some guests, as only 13.8% of listings use it. Evaluate if potential revenue protection outweighs possible lower booking rates.
- Regularly review your cancellation policy against competitors and market demand shifts in Pato Branco.
Pato Branco STR Booking Lead Time Analysis (2026)
Average Booking Lead Time by Month
Booking Lead Time Insights for Pato Branco
- The overall average booking lead time for vacation rentals in Pato Branco is 25 days.
- Guests book furthest in advance for stays during May (average 42 days), likely coinciding with peak travel demand or local events.
- The shortest booking windows occur for stays in February (average 7 days), indicating more last-minute travel plans during this time.
- Seasonally, Spring (29 days avg.) sees the longest lead times, while Summer (20 days avg.) has the shortest, reflecting typical travel planning cycles.
Recommendations for Hosts
- Use the overall average lead time (25 days) as a baseline for your pricing and availability strategy in Pato Branco.
- For May stays, consider implementing length-of-stay discounts or slightly higher rates for bookings made less than 42 days out to capitalize on advance planning.
- During February, focus on last-minute booking availability and promotions, as guests book with very short notice (7 days avg.).
- Target marketing efforts for the Spring season well in advance (at least 29 days) to capture early planners.
- Monitor your own booking lead times against these Pato Branco averages to identify opportunities for dynamic pricing adjustments.
Popular & Essential Airbnb Amenities in Pato Branco (2026)
Amenity Prevalence
Amenity Insights for Pato Branco
- Essential amenities in Pato Branco that guests expect include: Wifi. Lacking these (this) could significantly impact bookings.
- Popular amenities like Free parking on premises, Kitchen, TV are common but not universal. Offering these can provide a competitive edge.
Recommendations for Hosts
- Ensure your listing includes all essential amenities for Pato Branco: Wifi.
- Prioritize adding missing essentials: Wifi.
- Consider adding popular differentiators like Free parking on premises or Kitchen to increase appeal.
- Highlight unique or less common amenities you offer (e.g., hot tub, dedicated workspace, EV charger) in your listing description and photos.
- Regularly check competitor amenities in Pato Branco to stay competitive.
Pato Branco Airbnb Guest Demographics & Profile Analysis (2026)
Guest Profile Summary for Pato Branco
- The typical guest profile for Airbnb in Pato Branco consists of primarily domestic travelers (94%), often arriving from nearby Paraná, typically belonging to the Post-2000s (Gen Z/Alpha) group (50%), primarily speaking Portuguese or English.
- Domestic travelers account for 94.3% of guests.
- Key international markets include Brazil (94.3%) and Argentina (2.3%).
- Top languages spoken are Portuguese (52.4%) followed by English (27.7%).
- A significant demographic segment is the Post-2000s (Gen Z/Alpha) group, representing 50% of guests.
Recommendations for Hosts
- Target domestic marketing efforts towards travelers from Paraná and Curitiba.
- Tailor amenities and listing descriptions to appeal to the dominant Post-2000s (Gen Z/Alpha) demographic (e.g., highlight fast WiFi, smart home features, local guides).
- Highlight unique local experiences or amenities relevant to the primary guest profile.
- Consider seasonal promotions aligned with peak travel times for key origin markets.
Nearby Short-Term Rental Market Comparison
How does the Pato Branco Airbnb market stack up against its neighbors? Compare key performance metrics like average monthly revenue, ADR, and occupancy rates in surrounding areas to understand the broader regional STR landscape.
| Market | Active Properties | Monthly Revenue | Daily Rate | Avg. Occupancy |
|---|---|---|---|---|
| Itá | 12 | $923 | $122.67 | 27% |
| Boa Vista da Aparecida | 10 | $898 | $172.49 | 28% |
| Machadinho | 17 | $409 | $59.91 | 23% |
| Frederico Westphalen | 15 | $405 | $37.43 | 40% |
| Ametista do Sul | 34 | $351 | $68.33 | 25% |
| Videira | 16 | $321 | $37.11 | 37% |
| Chapecó | 274 | $299 | $33.39 | 37% |
| Três Passos | 12 | $291 | $55.98 | 17% |
| Erechim | 11 | $290 | $30.31 | 38% |
| Concórdia | 59 | $289 | $37.53 | 33% |