Paranaguá Airbnb Market Analysis 2026: Short Term Rental Data & Vacation Rental Statistics in Paraná, Brazil
Is Airbnb profitable in Paranaguá in 2026? Explore comprehensive Airbnb analytics for Paranaguá, Paraná, Brazil to uncover income potential. This 2026 STR market report for Paranaguá, based on AirROI data from February 2025 to January 2026, reveals key trends in the market of 232 active listings.
Whether you're considering an Airbnb investment in Paranaguá, optimizing your existing vacation rental, or exploring rental arbitrage opportunities, understanding the Paranaguá Airbnb data is crucial. Leveraging the low regulation environment is key to maximizing your short term rental income potential. Let's dive into the specifics.
Key Paranaguá Airbnb Performance Metrics Overview
Monthly Airbnb Revenue Variations & Income Potential in Paranaguá (2026)
Understanding the monthly revenue variations for Airbnb listings in Paranaguá is key to maximizing your short term rental income potential. Seasonality significantly impacts earnings. Our analysis, based on data from the past 12 months, shows that the peak revenue month for STRs in Paranaguá is typically March, while May often presents the lowest earnings, highlighting opportunities for strategic pricing adjustments during shoulder and low seasons. Explore the typical Airbnb income in Paranaguá across different performance tiers:
- Best-in-class properties (Top 10%) achieve $1,531+ monthly, often utilizing dynamic pricing and superior guest experiences.
- Strong performing properties (Top 25%) earn $842 or more, indicating effective management and desirable locations/amenities.
- Typical properties (Median) generate around $418 per month, representing the average market performance.
- Entry-level properties (Bottom 25%) see earnings around $195, often with potential for optimization.
Average Monthly Airbnb Earnings Trend in Paranaguá
Paranaguá Airbnb Occupancy Rate Trends (2026)
Maximize your bookings by understanding the Paranaguá STR occupancy trends. Seasonal demand shifts significantly influence how often properties are booked. Typically, Marchsees the highest demand (peak season occupancy), while September experiences the lowest (low season). Effective strategies, like adjusting minimum stays or offering promotions, can boost occupancy during slower periods. Here's how different property tiers perform in Paranaguá:
- Best-in-class properties (Top 10%) achieve 68%+ occupancy, indicating high desirability and potentially optimized availability.
- Strong performing properties (Top 25%) maintain 44% or higher occupancy, suggesting good market fit and guest satisfaction.
- Typical properties (Median) have an occupancy rate around 23%.
- Entry-level properties (Bottom 25%) average 12% occupancy, potentially facing higher vacancy.
Average Monthly Occupancy Rate Trend in Paranaguá
Average Daily Rate (ADR) Airbnb Trends in Paranaguá (2026)
Effective short term rental pricing strategy in Paranaguá involves understanding monthly ADR fluctuations. The Average Daily Rate (ADR) for Airbnb in Paranaguá typically peaks in January and dips lowest during September. Leveraging Airbnb dynamic pricing tools or strategies based on this seasonality can significantly boost revenue. Here's a look at the typical nightly rates achieved:
- Best-in-class properties (Top 10%) command rates of $176+ per night, often due to premium features or locations.
- Strong performing properties (Top 25%) achieve nightly rates of $97 or more.
- Typical properties (Median) charge around $51 per night.
- Entry-level properties (Bottom 25%) earn around $33 per night.
Average Daily Rate (ADR) Trend by Month in Paranaguá
Get Live Paranaguá Market Intelligence 👇

Explore Real-time Analytics
Airbnb Seasonality Analysis & Trends in Paranaguá (2026)
Peak Season (March, January, December)
- Revenue averages $908 per month
- Occupancy rates average 34.2%
- Daily rates average $88
Shoulder Season
- Revenue averages $673 per month
- Occupancy maintains around 31.1%
- Daily rates hold near $78
Low Season (May, June, September)
- Revenue drops to average $480 per month
- Occupancy decreases to average 25.4%
- Daily rates adjust to average $75
Seasonality Insights for Paranaguá
- The Airbnb seasonality in Paranaguá shows highly seasonal trends requiring careful strategy. While the sections above show seasonal averages, it's also insightful to look at the extremes:
- During the high season, the absolute peak month showcases Paranaguá's highest earning potential, with monthly revenues capable of climbing to $981, occupancy reaching a high of 39.1%, and ADRs peaking at $95.
- Conversely, the slowest single month of the year, typically falling within the low season, marks the market's lowest point. In this month, revenue might dip to $466, occupancy could drop to 24.5%, and ADRs may adjust down to $74.
- Understanding both the seasonal averages and these monthly peaks and troughs in revenue, occupancy, and ADR is crucial for maximizing your Airbnb profit potential in Paranaguá.
Seasonal Strategies for Maximizing Profit
- Peak Season: Maximize revenue through premium pricing and potentially longer minimum stays. Ensure high availability.
- Low Season: Offer competitive pricing, special promotions (e.g., extended stay discounts), and flexible cancellation policies. Target off-season travelers like remote workers or budget-conscious guests.
- Shoulder Seasons: Implement dynamic pricing that balances peak and low rates. Target weekend travelers or specific events. Offer slightly more flexible terms than peak season.
- Regularly analyze your own performance against these Paranaguá seasonality benchmarks and adjust your pricing and availability strategy accordingly.
Best Areas for Airbnb Investment in Paranaguá (2026)
Exploring the top neighborhoods for short-term rentals in Paranaguá? This section highlights key areas, outlining why they are attractive for hosts and guests, along with notable local attractions. Consider these locations based on your target guest profile and investment strategy.
| Neighborhood / Area | Why Host Here? (Target Guests & Appeal) | Key Attractions & Landmarks |
|---|---|---|
| Historic Center | The historic heart of Paranaguá, featuring colonial architecture and rich cultural heritage. A prime location for tourists interested in history and architecture, with access to museums and historical sites. | Museu de Arqueologia e Etnologia, Teatro Municipal, Igreja de Nossa Senhora do Rosário, Mercado do Artesanato, Caminho do Ouro |
| Saint Anthony Beach | A beautiful beach area known for its clear waters and scenic views. Popular with families and beachgoers looking for relaxation and water activities. | Praia de São Antônio, Water sports activities, Beachfront restaurants, Nature trails, Sunset views |
| Parque Estadual Ilha do Cardoso | A stunning natural park that offers ecotourism opportunities, making it attractive for guests looking for adventure and nature experiences. | Hiking trails, Wildlife watching, Eco-lodges, Kayaking, Beautiful beaches |
| Caiobá | A beach resort area known for its lively summer activities. A popular spot for tourists looking for beach fun, nightlife, and dining options. | Praia de Caiobá, Nightlife and bars, Water sports, Shopping centers, Restaurants |
| Pontal do Sul | A coastal area offering beautiful beaches and a laid-back atmosphere. Ideal for travelers looking for tranquility and beach leisure. | Praia de Pontal do Sul, Fishing and boating, Local seafood restaurants, Scenic viewpoints, Nature walks |
| Rocio | A charming residential area that appeals to both locals and tourists, offering a more authentic experience with local culture and cuisine. | Local markets, Cafes and bistros, Artisans' shops, Cultural festivals, Community events |
| Morretes | Close to Paranaguá, known for its historical significance and natural beauty. Ideal for tourists traveling for both adventure and history. | Caminho da Graciosa, Historical architecture, Local cuisine, Natural parks, River activities |
| Guaraqueçaba | A remote area known for its ecological preservation and beauty. Attracts eco-tourists and nature lovers. | Guanabara Bay, Hiking opportunities, Ecotourism tours, Boat trips, Wildlife spotting |
Understanding Airbnb License Requirements & STR Laws in Paranaguá (2026)
While Paranaguá, Paraná, Brazil currently shows low STR regulations, specific Airbnb license requirements might still exist or change. Always verify the latest short term rental regulations and Airbnb license requirements directly with local government authorities for Paranaguá to ensure full compliance before hosting.
(Source: AirROI data, 2026, based on 0% licensed listings)
Top Performing Airbnb Properties in Paranaguá (2026)
Benchmark your potential! Explore examples of top-performing Airbnb properties in Paranaguábased on Trailing Twelve Month (TTM) revenue. Analyze their characteristics, revenue, occupancy rate, and ADR to understand what drives success in this market.
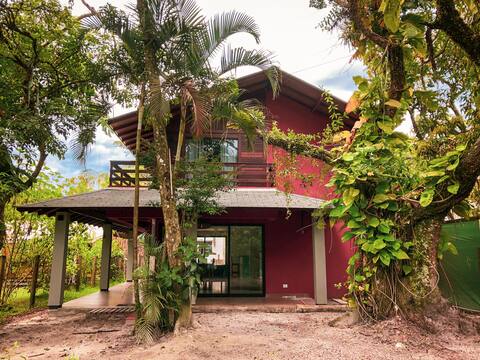
Anakena Beach House - new house 30 sec. from beach
Entire Place • 3 bedrooms
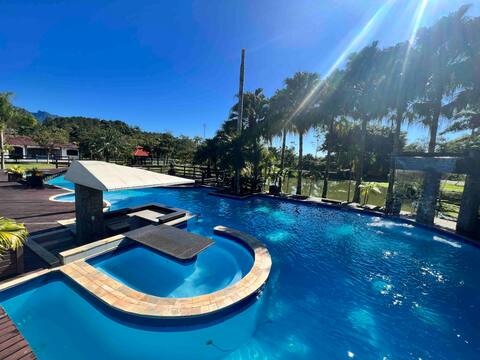
Chácara De La Croix
Entire Place • 6 bedrooms

Ale and Thiago's House - Ilha do Mel.
Entire Place • 4 bedrooms

Guapê - House with Sunset View on the Island
Entire Place • 4 bedrooms
House on Ilha do Mel
Entire Place • 4 bedrooms

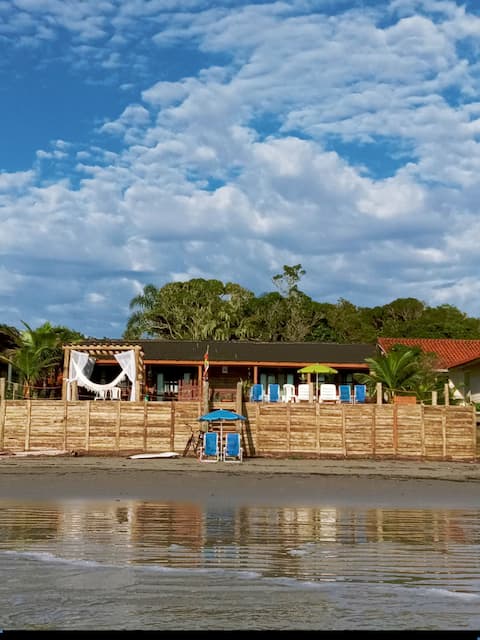
Fiji Time Beach House Honey Island
Entire Place • 4 bedrooms
Note: Performance varies based on location, size, amenities, seasonality, and management quality. Data reflects the past 12 months.
Top Performing Airbnb Hosts in Paranaguá (2026)
Learn from the best! This table showcases top-performing Airbnb hosts in Paranaguá based on the number of properties managed and estimated total revenue over the past year. Analyze their scale and performance metrics.
| Host Name | Properties | Grossing Revenue | Stay Reviews | Avg Rating |
|---|---|---|---|---|
| Daniele | 12 | $64,895 | 216 | 4.88/5.0 |
| Pousada Bella Sirena | 6 | $64,296 | 207 | 4.92/5.0 |
| Márcia | 10 | $55,297 | 1411 | 4.84/5.0 |
| Casa Da Ale E Do Thiago | 2 | $51,807 | 93 | 4.71/5.0 |
| Raiane | 6 | $49,017 | 317 | 4.55/5.0 |
| Rafael | 9 | $48,211 | 251 | 4.80/5.0 |
| Teca | 1 | $46,223 | 4 | 5.00/5.0 |
| Fernando | 9 | $45,750 | 396 | 4.72/5.0 |
| Marjorye | 1 | $45,460 | 9 | 5.00/5.0 |
| Multitemporada | 4 | $43,915 | 21 | 4.92/5.0 |
Analyzing the strategies of top hosts, such as their property selection, pricing, and guest communication, can offer valuable lessons for optimizing your own Airbnb operations in Paranaguá.
Dive Deeper: Advanced Paranaguá STR Market Data (2026)
Ready to unlock more insights? AirROI provides access to advanced metrics and comprehensive Airbnb data for Paranaguá. Explore detailed analytics beyond this report to refine your investment strategy, optimize pricing, and maximize your vacation rental profits.
Explore Advanced MetricsParanaguá Short-Term Rental Market Composition (2026): Property & Room Types
Room Type Distribution
Property Type Distribution
Market Composition Insights for Paranaguá
- The Paranaguá Airbnb market composition is heavily skewed towards Entire Home/Apt listings, which make up 57.8% of the 232 active rentals. This indicates strong guest preference for privacy and space.
- However, a notable 42.2% share for Private Rooms suggests opportunities for budget-conscious travelers or hosts renting out spare rooms.
- Looking at the property type distribution in Paranaguá, House properties are the most common (45.7%), reflecting the local real estate landscape.
- Houses represent a significant 45.7% portion, catering likely to families or larger groups.
- The presence of 26.7% Hotel/Boutique listings indicates integration with traditional hospitality.
- Smaller segments like outdoor/unique, others, unique stays (combined 7.3%) offer potential for unique stay experiences.
Paranaguá Airbnb Room Capacity Analysis (2026): Bedroom Distribution
Distribution of Listings by Number of Bedrooms
Room Capacity Insights for Paranaguá
- The dominant room capacity in Paranaguá is 1 bedroom listings, making up 40.9% of the market. This suggests a strong demand for properties suitable for couples or solo travelers.
- Together, 1 bedroom and 2 bedrooms properties represent 56.8% of the active Airbnb listings in Paranaguá, indicating a high concentration in these sizes.
Paranaguá Vacation Rental Guest Capacity Trends (2026)
Distribution of Listings by Guest Capacity
Guest Capacity Insights for Paranaguá
- The most common guest capacity trend in Paranaguá vacation rentals is listings accommodating 2 guests (17.7%). This suggests the primary traveler segment is likely couples or solo travelers.
- Properties designed for 2 guests and 4 guests dominate the Paranaguá STR market, accounting for 34.5% of listings.
- 23.8% of properties accommodate 6+ guests, serving the market segment for larger families or group travel in Paranaguá.
- On average, properties in Paranaguá are equipped to host 3.2 guests.
Paranaguá Airbnb Booking Patterns (2026): Available vs. Booked Days
Available Days Distribution
Booked Days Distribution
Booking Pattern Insights for Paranaguá
- The most common availability pattern in Paranaguá falls within the 271-366 days range, representing 65.5% of listings. This suggests many properties have significant open periods on their calendars.
- Approximately 93.5% of listings show high availability (181+ days open annually), indicating potential for increased bookings or specific owner usage patterns.
- For booked days, the 1-30 days range is most frequent in Paranaguá (32.8%), reflecting common guest stay durations or potential owner blocking patterns.
- A notable 7.3% of properties secure long booking periods (181+ days booked per year), highlighting successful long-term rental strategies or significant owner usage.
Paranaguá Airbnb Minimum Stay Requirements Analysis
Distribution of Listings by Minimum Night Requirement
1 Night
126 listings
54.3% of total
2 Nights
55 listings
23.7% of total
3 Nights
4 listings
1.7% of total
4-6 Nights
3 listings
1.3% of total
7-29 Nights
5 listings
2.2% of total
30+ Nights
39 listings
16.8% of total
Key Insights
- The most prevalent minimum stay requirement in Paranaguá is 1 Night, adopted by 54.3% of listings. This highlights the market's preference for shorter, flexible bookings.
- A strong majority (78.0%) of the Paranaguá Airbnb data shows acceptance of very short stays (1-2 nights), indicating a dynamic, high-turnover market.
- A significant segment (16.8%) caters to monthly stays (30+ nights) in Paranaguá, pointing to opportunities in the extended-stay market.
Recommendations
- Align with the market by considering a 1 Night minimum stay, as 54.3% of Paranaguá hosts use this setting.
- Explore offering discounts for stays of 30+ nights to attract the 16.8% of the market seeking extended stays.
- Adjust minimum nights based on seasonality – potentially shorter during low season and longer during peak demand periods in Paranaguá.
Paranaguá Airbnb Cancellation Policy Trends Analysis (2026)
Super Strict 30 Days
4 listings
1.7% of total
Limited
6 listings
2.6% of total
Refundable
1 listings
0.4% of total
Flexible
45 listings
19.5% of total
Moderate
49 listings
21.2% of total
Firm
94 listings
40.7% of total
Strict
32 listings
13.9% of total
Cancellation Policy Insights for Paranaguá
- The prevailing Airbnb cancellation policy trend in Paranaguá is Firm, used by 40.7% of listings.
- A majority (54.6%) of hosts in Paranaguá utilize Firm or Strict policies, indicating a market where hosts prioritize booking security.
Recommendations for Hosts
- Consider adopting a Firm policy to align with the 40.7% market standard in Paranaguá.
- Using a Strict policy might deter some guests, as only 13.9% of listings use it. Evaluate if potential revenue protection outweighs possible lower booking rates.
- Regularly review your cancellation policy against competitors and market demand shifts in Paranaguá.
Paranaguá STR Booking Lead Time Analysis (2026)
Average Booking Lead Time by Month
Booking Lead Time Insights for Paranaguá
- The overall average booking lead time for vacation rentals in Paranaguá is 35 days.
- Guests book furthest in advance for stays during December (average 60 days), likely coinciding with peak travel demand or local events.
- The shortest booking windows occur for stays in May (average 16 days), indicating more last-minute travel plans during this time.
- Seasonally, Winter (44 days avg.) sees the longest lead times, while Spring (26 days avg.) has the shortest, reflecting typical travel planning cycles.
Recommendations for Hosts
- Use the overall average lead time (35 days) as a baseline for your pricing and availability strategy in Paranaguá.
- For December stays, consider implementing length-of-stay discounts or slightly higher rates for bookings made less than 60 days out to capitalize on advance planning.
- Target marketing efforts for the Winter season well in advance (at least 44 days) to capture early planners.
- Monitor your own booking lead times against these Paranaguá averages to identify opportunities for dynamic pricing adjustments.
Popular & Essential Airbnb Amenities in Paranaguá (2026)
Amenity Prevalence
Amenity Insights for Paranaguá
- Popular amenities like Wifi, TV, Kitchen are common but not universal. Offering these can provide a competitive edge.
- Warning: Wifi is not universally provided but is considered essential globally. Ensure reliable Wifi is offered.
Recommendations for Hosts
- Consider adding popular differentiators like Wifi or TV to increase appeal.
- Highlight unique or less common amenities you offer (e.g., hot tub, dedicated workspace, EV charger) in your listing description and photos.
- Regularly check competitor amenities in Paranaguá to stay competitive.
Paranaguá Airbnb Guest Demographics & Profile Analysis (2026)
Guest Profile Summary for Paranaguá
- The typical guest profile for Airbnb in Paranaguá consists of primarily domestic travelers (95%), often arriving from nearby Curitiba, typically belonging to the Post-2000s (Gen Z/Alpha) group (50%), primarily speaking Portuguese or English.
- Domestic travelers account for 94.8% of guests.
- Key international markets include Brazil (94.8%) and Germany (1.3%).
- Top languages spoken are Portuguese (46%) followed by English (28.7%).
- A significant demographic segment is the Post-2000s (Gen Z/Alpha) group, representing 50% of guests.
Recommendations for Hosts
- Target domestic marketing efforts towards travelers from Curitiba and Paraná.
- Tailor amenities and listing descriptions to appeal to the dominant Post-2000s (Gen Z/Alpha) demographic (e.g., highlight fast WiFi, smart home features, local guides).
- Highlight unique local experiences or amenities relevant to the primary guest profile.
- Consider seasonal promotions aligned with peak travel times for key origin markets.
Nearby Short-Term Rental Market Comparison
How does the Paranaguá Airbnb market stack up against its neighbors? Compare key performance metrics like average monthly revenue, ADR, and occupancy rates in surrounding areas to understand the broader regional STR landscape.
| Market | Active Properties | Monthly Revenue | Daily Rate | Avg. Occupancy |
|---|---|---|---|---|
| Almirante Tamandaré | 16 | $1,292 | $118.23 | 39% |
| Quatro Barras | 39 | $1,134 | $137.97 | 32% |
| Campo Magro | 24 | $1,069 | $134.14 | 30% |
| Rio dos Cedros | 147 | $993 | $142.58 | 27% |
| Palmeira | 15 | $989 | $131.05 | 29% |
| Balsa Nova | 55 | $982 | $123.19 | 29% |
| Contenda | 11 | $881 | $92.99 | 45% |
| Balneário Camboriú | 4,575 | $867 | $116.75 | 36% |
| Massaranduba | 11 | $844 | $86.77 | 36% |
| Campina Grande do Sul | 97 | $841 | $104.73 | 31% |