Maringá Airbnb Market Analysis 2026: Short Term Rental Data & Vacation Rental Statistics in Paraná, Brazil
Is Airbnb profitable in Maringá in 2026? Explore comprehensive Airbnb analytics for Maringá, Paraná, Brazil to uncover income potential. This 2026 STR market report for Maringá, based on AirROI data from February 2025 to January 2026, reveals key trends in the market of 602 active listings.
Whether you're considering an Airbnb investment in Maringá, optimizing your existing vacation rental, or exploring rental arbitrage opportunities, understanding the Maringá Airbnb data is crucial. Leveraging the low regulation environment is key to maximizing your short term rental income potential. Let's dive into the specifics.
Key Maringá Airbnb Performance Metrics Overview
Monthly Airbnb Revenue Variations & Income Potential in Maringá (2026)
Understanding the monthly revenue variations for Airbnb listings in Maringá is key to maximizing your short term rental income potential. Seasonality significantly impacts earnings. Our analysis, based on data from the past 12 months, shows that the peak revenue month for STRs in Maringá is typically December, while April often presents the lowest earnings, highlighting opportunities for strategic pricing adjustments during shoulder and low seasons. Explore the typical Airbnb income in Maringá across different performance tiers:
- Best-in-class properties (Top 10%) achieve $1,008+ monthly, often utilizing dynamic pricing and superior guest experiences.
- Strong performing properties (Top 25%) earn $706 or more, indicating effective management and desirable locations/amenities.
- Typical properties (Median) generate around $444 per month, representing the average market performance.
- Entry-level properties (Bottom 25%) see earnings around $220, often with potential for optimization.
Average Monthly Airbnb Earnings Trend in Maringá
Maringá Airbnb Occupancy Rate Trends (2026)
Maximize your bookings by understanding the Maringá STR occupancy trends. Seasonal demand shifts significantly influence how often properties are booked. Typically, Marchsees the highest demand (peak season occupancy), while January experiences the lowest (low season). Effective strategies, like adjusting minimum stays or offering promotions, can boost occupancy during slower periods. Here's how different property tiers perform in Maringá:
- Best-in-class properties (Top 10%) achieve 82%+ occupancy, indicating high desirability and potentially optimized availability.
- Strong performing properties (Top 25%) maintain 67% or higher occupancy, suggesting good market fit and guest satisfaction.
- Typical properties (Median) have an occupancy rate around 43%.
- Entry-level properties (Bottom 25%) average 22% occupancy, potentially facing higher vacancy.
Average Monthly Occupancy Rate Trend in Maringá
Average Daily Rate (ADR) Airbnb Trends in Maringá (2026)
Effective short term rental pricing strategy in Maringá involves understanding monthly ADR fluctuations. The Average Daily Rate (ADR) for Airbnb in Maringá typically peaks in December and dips lowest during February. Leveraging Airbnb dynamic pricing tools or strategies based on this seasonality can significantly boost revenue. Here's a look at the typical nightly rates achieved:
- Best-in-class properties (Top 10%) command rates of $61+ per night, often due to premium features or locations.
- Strong performing properties (Top 25%) achieve nightly rates of $44 or more.
- Typical properties (Median) charge around $31 per night.
- Entry-level properties (Bottom 25%) earn around $24 per night.
Average Daily Rate (ADR) Trend by Month in Maringá
Get Live Maringá Market Intelligence 👇

Explore Real-time Analytics
Airbnb Seasonality Analysis & Trends in Maringá (2026)
Peak Season (December, July, November)
- Revenue averages $595 per month
- Occupancy rates average 45.4%
- Daily rates average $45
Shoulder Season
- Revenue averages $523 per month
- Occupancy maintains around 43.9%
- Daily rates hold near $42
Low Season (February, April, May)
- Revenue drops to average $468 per month
- Occupancy decreases to average 46.4%
- Daily rates adjust to average $39
Seasonality Insights for Maringá
- The Airbnb seasonality in Maringá shows moderate seasonality with distinct peak and low periods. While the sections above show seasonal averages, it's also insightful to look at the extremes:
- During the high season, the absolute peak month showcases Maringá's highest earning potential, with monthly revenues capable of climbing to $664, occupancy reaching a high of 52.0%, and ADRs peaking at $47.
- Conversely, the slowest single month of the year, typically falling within the low season, marks the market's lowest point. In this month, revenue might dip to $461, occupancy could drop to 35.0%, and ADRs may adjust down to $38.
- Understanding both the seasonal averages and these monthly peaks and troughs in revenue, occupancy, and ADR is crucial for maximizing your Airbnb profit potential in Maringá.
Seasonal Strategies for Maximizing Profit
- Peak Season: Maximize revenue through premium pricing and potentially longer minimum stays. Ensure high availability.
- Low Season: Offer competitive pricing, special promotions (e.g., extended stay discounts), and flexible cancellation policies. Target off-season travelers like remote workers or budget-conscious guests.
- Shoulder Seasons: Implement dynamic pricing that balances peak and low rates. Target weekend travelers or specific events. Offer slightly more flexible terms than peak season.
- Regularly analyze your own performance against these Maringá seasonality benchmarks and adjust your pricing and availability strategy accordingly.
Best Areas for Airbnb Investment in Maringá (2026)
Exploring the top neighborhoods for short-term rentals in Maringá? This section highlights key areas, outlining why they are attractive for hosts and guests, along with notable local attractions. Consider these locations based on your target guest profile and investment strategy.
| Neighborhood / Area | Why Host Here? (Target Guests & Appeal) | Key Attractions & Landmarks |
|---|---|---|
| Centro | The central area of Maringá, bustling with shops, restaurants, and cultural attractions. Ideal for guests who want to be in the heart of the city's activity and close to public transportation. | Cathedral of Maringá, Maringá Park, Shopping Cidade, Teatro Calil Haddad, Catedral Metropolitana de Maringá |
| Parque do Ingá | A beautiful park area offering green spaces and recreational facilities. Perfect for families and nature lovers looking for a peaceful stay close to nature. | Parque do Ingá, rapids and nature trails, playgrounds, picnic areas |
| Jardim Alvorada | A quiet residential neighborhood that attracts families and long-term visitors. Access to good schools, grocery stores, and local markets makes it appealing for longer Airbnb stays. | local markets, shopping options, parks, play areas, close to main roads |
| Maringá Norte | An up-and-coming area with new developments. Offers a blend of residential tranquility and proximity to shopping and dining options, making it attractive for young professionals. | new shopping centers, local cafes, fitness centers |
| Zona 1 | A traditional neighborhood with historical significance and local character. Great for guests interested in exploring local culture and history. | Museu Histórico, Sagrado Coração de Jesus Church, local eateries |
| Jardim São Silvestre | A popular area among university students due to its proximity to educational institutions. Ideal for budget travelers and students looking for affordable accommodations. | Universidade Estadual de Maringá, bars and cafes, local shops |
| Estrela do Norte | Predominantly residential, it offers a cozy atmosphere for visitors. It's a great retreat option for visitors looking to enjoy a calm and welcoming environment. | community events, quiet parks, local festivals |
| Parque das Nações | A vibrant and diverse area close to many amenities including schools and parks. It attracts both families and corporate travelers due to its location and facilities. | Shopping outlets, local dining, parks, schools |
Understanding Airbnb License Requirements & STR Laws in Maringá (2026)
While Maringá, Paraná, Brazil currently shows low STR regulations, specific Airbnb license requirements might still exist or change. Always verify the latest short term rental regulations and Airbnb license requirements directly with local government authorities for Maringá to ensure full compliance before hosting.
(Source: AirROI data, 2026, based on 0% licensed listings)
Top Performing Airbnb Properties in Maringá (2026)
Benchmark your potential! Explore examples of top-performing Airbnb properties in Maringábased on Trailing Twelve Month (TTM) revenue. Analyze their characteristics, revenue, occupancy rate, and ADR to understand what drives success in this market.
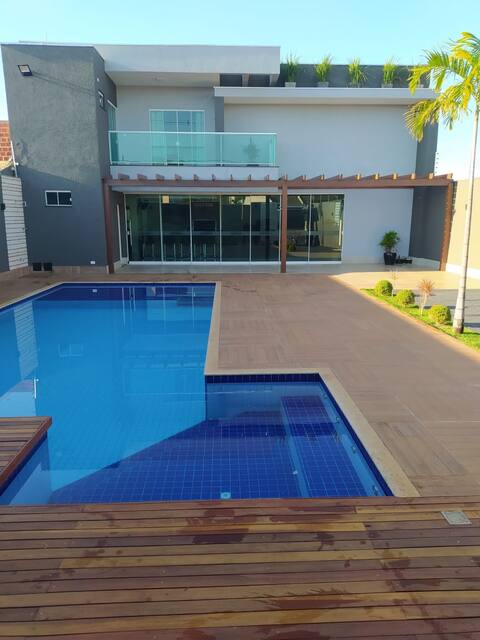
Villa Piave Mansion - High Standard - Smart
Entire Place • 6 bedrooms

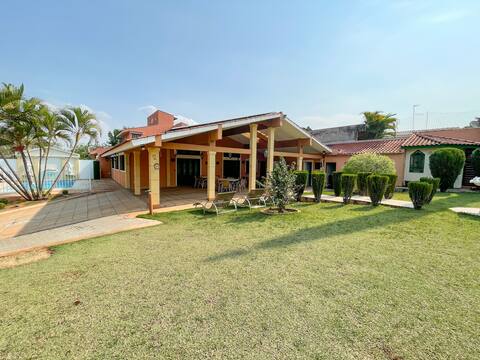
Excellent House in Parque do Ingá - JA217
Entire Place • 5 bedrooms
Recanto Dois Irmãos | Maringá, PR
Entire Place • 3 bedrooms

Leisure and Accommodation in the woods!
Entire Place • 4 bedrooms
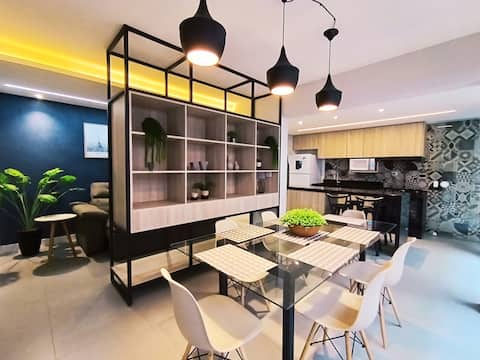
Comfortable 3-Bedroom Apartment, Great Location!
Entire Place • 3 bedrooms

House 15 Pax • Pool, Pool Table, Near Vivaro
Entire Place • 4 bedrooms
Note: Performance varies based on location, size, amenities, seasonality, and management quality. Data reflects the past 12 months.
Top Performing Airbnb Hosts in Maringá (2026)
Learn from the best! This table showcases top-performing Airbnb hosts in Maringá based on the number of properties managed and estimated total revenue over the past year. Analyze their scale and performance metrics.
| Host Name | Properties | Grossing Revenue | Stay Reviews | Avg Rating |
|---|---|---|---|---|
| Smart Stay | 123 | $756,305 | 3840 | 4.54/5.0 |
| Luís Felipe | 17 | $96,066 | 992 | 4.92/5.0 |
| Pedro Granado Imóveis | 22 | $91,553 | 785 | 4.77/5.0 |
| Ebenezer | 13 | $75,798 | 122 | 4.93/5.0 |
| Eduardo | 7 | $59,117 | 891 | 4.85/5.0 |
| Talita Kelly | 3 | $44,513 | 222 | 4.89/5.0 |
| Hospedagem Cidade Verde | 25 | $41,000 | 415 | 4.86/5.0 |
| Angela | 4 | $39,896 | 161 | 4.93/5.0 |
| GCLI Locação Flexível | 18 | $38,026 | 252 | 4.57/5.0 |
| Janaína | 7 | $37,423 | 879 | 4.93/5.0 |
Analyzing the strategies of top hosts, such as their property selection, pricing, and guest communication, can offer valuable lessons for optimizing your own Airbnb operations in Maringá.
Dive Deeper: Advanced Maringá STR Market Data (2026)
Ready to unlock more insights? AirROI provides access to advanced metrics and comprehensive Airbnb data for Maringá. Explore detailed analytics beyond this report to refine your investment strategy, optimize pricing, and maximize your vacation rental profits.
Explore Advanced MetricsMaringá Short-Term Rental Market Composition (2026): Property & Room Types
Room Type Distribution
Property Type Distribution
Market Composition Insights for Maringá
- The Maringá Airbnb market composition is heavily skewed towards Entire Home/Apt listings, which make up 91.2% of the 602 active rentals. This indicates strong guest preference for privacy and space.
- Looking at the property type distribution in Maringá, Apartment/Condo properties are the most common (77.4%), reflecting the local real estate landscape.
- Houses represent a significant 19.8% portion, catering likely to families or larger groups.
- Smaller segments like hotel/boutique, others, outdoor/unique (combined 2.8%) offer potential for unique stay experiences.
Maringá Airbnb Room Capacity Analysis (2026): Bedroom Distribution
Distribution of Listings by Number of Bedrooms
Room Capacity Insights for Maringá
- The dominant room capacity in Maringá is 1 bedroom listings, making up 53% of the market. This suggests a strong demand for properties suitable for couples or solo travelers.
- Together, 1 bedroom and 2 bedrooms properties represent 72.9% of the active Airbnb listings in Maringá, indicating a high concentration in these sizes.
- With over half the market (53%) consisting of studios or 1-bedroom units, Maringá is particularly well-suited for individuals or couples.
Maringá Vacation Rental Guest Capacity Trends (2026)
Distribution of Listings by Guest Capacity
Guest Capacity Insights for Maringá
- The most common guest capacity trend in Maringá vacation rentals is listings accommodating 2 guests (32.1%). This suggests the primary traveler segment is likely couples or solo travelers.
- Properties designed for 2 guests and 4 guests dominate the Maringá STR market, accounting for 53.5% of listings.
- 18.4% of properties accommodate 6+ guests, serving the market segment for larger families or group travel in Maringá.
- On average, properties in Maringá are equipped to host 3.6 guests.
Maringá Airbnb Booking Patterns (2026): Available vs. Booked Days
Available Days Distribution
Booked Days Distribution
Booking Pattern Insights for Maringá
- The most common availability pattern in Maringá falls within the 271-366 days range, representing 40.9% of listings. This suggests many properties have significant open periods on their calendars.
- Approximately 75.3% of listings show high availability (181+ days open annually), indicating potential for increased bookings or specific owner usage patterns.
- For booked days, the 91-180 days range is most frequent in Maringá (34.2%), reflecting common guest stay durations or potential owner blocking patterns.
- A notable 26.1% of properties secure long booking periods (181+ days booked per year), highlighting successful long-term rental strategies or significant owner usage.
Maringá Airbnb Minimum Stay Requirements Analysis
Distribution of Listings by Minimum Night Requirement
1 Night
289 listings
48% of total
2 Nights
113 listings
18.8% of total
3 Nights
30 listings
5% of total
4-6 Nights
19 listings
3.2% of total
7-29 Nights
5 listings
0.8% of total
30+ Nights
146 listings
24.3% of total
Key Insights
- The most prevalent minimum stay requirement in Maringá is 1 Night, adopted by 48% of listings. This highlights the market's preference for shorter, flexible bookings.
- A strong majority (66.8%) of the Maringá Airbnb data shows acceptance of very short stays (1-2 nights), indicating a dynamic, high-turnover market.
- A significant segment (24.3%) caters to monthly stays (30+ nights) in Maringá, pointing to opportunities in the extended-stay market.
Recommendations
- Align with the market by considering a 1 Night minimum stay, as 48% of Maringá hosts use this setting.
- Explore offering discounts for stays of 30+ nights to attract the 24.3% of the market seeking extended stays.
- Adjust minimum nights based on seasonality – potentially shorter during low season and longer during peak demand periods in Maringá.
Maringá Airbnb Cancellation Policy Trends Analysis (2026)
Super Strict 30 Days
1 listings
0.2% of total
Limited
8 listings
1.3% of total
Flexible
180 listings
29.9% of total
Moderate
185 listings
30.7% of total
Firm
199 listings
33.1% of total
Strict
29 listings
4.8% of total
Cancellation Policy Insights for Maringá
- The prevailing Airbnb cancellation policy trend in Maringá is Firm, used by 33.1% of listings.
- There's a relatively balanced mix between guest-friendly (60.6%) and stricter (37.9%) policies, offering choices for different guest needs.
- Strict cancellation policies are quite rare (4.8%), potentially making listings with this policy less competitive unless justified by high demand or property type.
Recommendations for Hosts
- Consider adopting a Firm policy to align with the 33.1% market standard in Maringá.
- Using a Strict policy might deter some guests, as only 4.8% of listings use it. Evaluate if potential revenue protection outweighs possible lower booking rates.
- Regularly review your cancellation policy against competitors and market demand shifts in Maringá.
Maringá STR Booking Lead Time Analysis (2026)
Average Booking Lead Time by Month
Booking Lead Time Insights for Maringá
- The overall average booking lead time for vacation rentals in Maringá is 17 days.
- Guests book furthest in advance for stays during January (average 23 days), likely coinciding with peak travel demand or local events.
- The shortest booking windows occur for stays in March (average 10 days), indicating more last-minute travel plans during this time.
- Seasonally, Winter (19 days avg.) sees the longest lead times, while Spring (12 days avg.) has the shortest, reflecting typical travel planning cycles.
Recommendations for Hosts
- Use the overall average lead time (17 days) as a baseline for your pricing and availability strategy in Maringá.
- Target marketing efforts for the Winter season well in advance (at least 19 days) to capture early planners.
- Monitor your own booking lead times against these Maringá averages to identify opportunities for dynamic pricing adjustments.
Popular & Essential Airbnb Amenities in Maringá (2026)
Amenity Prevalence
Amenity Insights for Maringá
- Essential amenities in Maringá that guests expect include: Wifi, Kitchen. Lacking these (any) could significantly impact bookings.
- Popular amenities like TV, Free parking on premises, Bed linens are common but not universal. Offering these can provide a competitive edge.
Recommendations for Hosts
- Ensure your listing includes all essential amenities for Maringá: Wifi, Kitchen.
- Prioritize adding missing essentials: Wifi, Kitchen.
- Consider adding popular differentiators like TV or Free parking on premises to increase appeal.
- Highlight unique or less common amenities you offer (e.g., hot tub, dedicated workspace, EV charger) in your listing description and photos.
- Regularly check competitor amenities in Maringá to stay competitive.
Maringá Airbnb Guest Demographics & Profile Analysis (2026)
Guest Profile Summary for Maringá
- The typical guest profile for Airbnb in Maringá consists of primarily domestic travelers (95%), often arriving from nearby Paraná, typically belonging to the Post-2000s (Gen Z/Alpha) group (50%), primarily speaking Portuguese or English.
- Domestic travelers account for 95.1% of guests.
- Key international markets include Brazil (95.1%) and United States (0.8%).
- Top languages spoken are Portuguese (53.3%) followed by English (26.1%).
- A significant demographic segment is the Post-2000s (Gen Z/Alpha) group, representing 50% of guests.
Recommendations for Hosts
- Target domestic marketing efforts towards travelers from Paraná and São Paulo.
- Tailor amenities and listing descriptions to appeal to the dominant Post-2000s (Gen Z/Alpha) demographic (e.g., highlight fast WiFi, smart home features, local guides).
- Highlight unique local experiences or amenities relevant to the primary guest profile.
- Consider seasonal promotions aligned with peak travel times for key origin markets.
Nearby Short-Term Rental Market Comparison
How does the Maringá Airbnb market stack up against its neighbors? Compare key performance metrics like average monthly revenue, ADR, and occupancy rates in surrounding areas to understand the broader regional STR landscape.
| Market | Active Properties | Monthly Revenue | Daily Rate | Avg. Occupancy |
|---|---|---|---|---|
| Arapongas | 33 | $631 | $71.15 | 34% |
| Londrina | 631 | $410 | $42.10 | 42% |
| Cornélio Procópio | 13 | $358 | $68.78 | 25% |
| Cambé | 29 | $336 | $38.05 | 44% |
| Apucarana | 17 | $330 | $39.59 | 37% |
| Castro | 19 | $320 | $84.96 | 22% |
| Presidente Prudente | 183 | $296 | $36.70 | 40% |
| Rolândia | 11 | $289 | $85.67 | 34% |
| Campo Mourão | 43 | $281 | $33.93 | 37% |
| Paranavaí | 17 | $280 | $38.59 | 42% |