Guarapuava Airbnb Market Analysis 2026: Short Term Rental Data & Vacation Rental Statistics in Paraná, Brazil
Is Airbnb profitable in Guarapuava in 2026? Explore comprehensive Airbnb analytics for Guarapuava, Paraná, Brazil to uncover income potential. This 2026 STR market report for Guarapuava, based on AirROI data from February 2025 to January 2026, reveals key trends in the niche market of 106 active listings.
Whether you're considering an Airbnb investment in Guarapuava, optimizing your existing vacation rental, or exploring rental arbitrage opportunities, understanding the Guarapuava Airbnb data is crucial. Leveraging the low regulation environment is key to maximizing your short term rental income potential. Let's dive into the specifics.
Key Guarapuava Airbnb Performance Metrics Overview
Monthly Airbnb Revenue Variations & Income Potential in Guarapuava (2026)
Understanding the monthly revenue variations for Airbnb listings in Guarapuava is key to maximizing your short term rental income potential. Seasonality significantly impacts earnings. Our analysis, based on data from the past 12 months, shows that the peak revenue month for STRs in Guarapuava is typically December, while October often presents the lowest earnings, highlighting opportunities for strategic pricing adjustments during shoulder and low seasons. Explore the typical Airbnb income in Guarapuava across different performance tiers:
- Best-in-class properties (Top 10%) achieve $826+ monthly, often utilizing dynamic pricing and superior guest experiences.
- Strong performing properties (Top 25%) earn $504 or more, indicating effective management and desirable locations/amenities.
- Typical properties (Median) generate around $262 per month, representing the average market performance.
- Entry-level properties (Bottom 25%) see earnings around $122, often with potential for optimization.
Average Monthly Airbnb Earnings Trend in Guarapuava
Guarapuava Airbnb Occupancy Rate Trends (2026)
Maximize your bookings by understanding the Guarapuava STR occupancy trends. Seasonal demand shifts significantly influence how often properties are booked. Typically, Februarysees the highest demand (peak season occupancy), while January experiences the lowest (low season). Effective strategies, like adjusting minimum stays or offering promotions, can boost occupancy during slower periods. Here's how different property tiers perform in Guarapuava:
- Best-in-class properties (Top 10%) achieve 75%+ occupancy, indicating high desirability and potentially optimized availability.
- Strong performing properties (Top 25%) maintain 52% or higher occupancy, suggesting good market fit and guest satisfaction.
- Typical properties (Median) have an occupancy rate around 28%.
- Entry-level properties (Bottom 25%) average 15% occupancy, potentially facing higher vacancy.
Average Monthly Occupancy Rate Trend in Guarapuava
Average Daily Rate (ADR) Airbnb Trends in Guarapuava (2026)
Effective short term rental pricing strategy in Guarapuava involves understanding monthly ADR fluctuations. The Average Daily Rate (ADR) for Airbnb in Guarapuava typically peaks in December and dips lowest during April. Leveraging Airbnb dynamic pricing tools or strategies based on this seasonality can significantly boost revenue. Here's a look at the typical nightly rates achieved:
- Best-in-class properties (Top 10%) command rates of $63+ per night, often due to premium features or locations.
- Strong performing properties (Top 25%) achieve nightly rates of $35 or more.
- Typical properties (Median) charge around $27 per night.
- Entry-level properties (Bottom 25%) earn around $19 per night.
Average Daily Rate (ADR) Trend by Month in Guarapuava
Get Live Guarapuava Market Intelligence 👇

Explore Real-time Analytics
Airbnb Seasonality Analysis & Trends in Guarapuava (2026)
Peak Season (December, March, August)
- Revenue averages $452 per month
- Occupancy rates average 38.0%
- Daily rates average $38
Shoulder Season
- Revenue averages $372 per month
- Occupancy maintains around 35.4%
- Daily rates hold near $37
Low Season (June, July, October)
- Revenue drops to average $347 per month
- Occupancy decreases to average 30.5%
- Daily rates adjust to average $38
Seasonality Insights for Guarapuava
- The Airbnb seasonality in Guarapuava shows moderate seasonality with distinct peak and low periods. While the sections above show seasonal averages, it's also insightful to look at the extremes:
- During the high season, the absolute peak month showcases Guarapuava's highest earning potential, with monthly revenues capable of climbing to $515, occupancy reaching a high of 43.0%, and ADRs peaking at $41.
- Conversely, the slowest single month of the year, typically falling within the low season, marks the market's lowest point. In this month, revenue might dip to $342, occupancy could drop to 27.9%, and ADRs may adjust down to $35.
- Understanding both the seasonal averages and these monthly peaks and troughs in revenue, occupancy, and ADR is crucial for maximizing your Airbnb profit potential in Guarapuava.
Seasonal Strategies for Maximizing Profit
- Peak Season: Maximize revenue through premium pricing and potentially longer minimum stays. Ensure high availability.
- Low Season: Offer competitive pricing, special promotions (e.g., extended stay discounts), and flexible cancellation policies. Target off-season travelers like remote workers or budget-conscious guests.
- Shoulder Seasons: Implement dynamic pricing that balances peak and low rates. Target weekend travelers or specific events. Offer slightly more flexible terms than peak season.
- Regularly analyze your own performance against these Guarapuava seasonality benchmarks and adjust your pricing and availability strategy accordingly.
Best Areas for Airbnb Investment in Guarapuava (2026)
Exploring the top neighborhoods for short-term rentals in Guarapuava? This section highlights key areas, outlining why they are attractive for hosts and guests, along with notable local attractions. Consider these locations based on your target guest profile and investment strategy.
| Neighborhood / Area | Why Host Here? (Target Guests & Appeal) | Key Attractions & Landmarks |
|---|---|---|
| Centro | The central area of Guarapuava is bustling with activity, featuring shops, restaurants, and cultural sites. Its accessibility makes it ideal for tourists looking to explore the city. | Guarapuava Municipal Theater, The Cathedral of Guarapuava, Shopping Cidade dos Lagos, Praça 9 de Dezembro, Parque do Lago, Museu de História Natural |
| Batel | Batel is a trendy neighborhood known for its upscale dining and vibrant nightlife. It's popular among both locals and visitors, making it a great place to host tourists seeking entertainment and luxury. | Batel Soho, Shopping Pátio Batel, Various high-end restaurants, Nightclubs, Green spaces |
| Ecoville | A serene residential area surrounded by nature, Ecoville is perfect for travelers looking for relaxation and proximity to parks and natural attractions. | Parque do Lago, Caminho do Sol, Natural Pools |
| Santa Cruz | This neighborhood is famous for its historic character and community feel. Visitors enjoy exploring local markets and experiencing Guarapuava's culture. | Feira do Produtor, Igreja Santa Cruz, Cultural events at the local plaza |
| Cascavel | A more rural but picturesque area, ideal for eco-tourism and nature lovers. Great for guests who want to experience the Brazilian countryside close to the city. | Cascavel Waterfalls, Trails and nature walks, Local wildlife |
| Vila Mariana | A well-established neighborhood with family-friendly environments, it's suitable for longer stays, especially for families visiting the area. | Local parks, Community events, Schools and educational institutions |
| São Bento | An emerging neighborhood that combines historical charm with modern conveniences. Attracts a growing number of visitors and offers a unique local vibe. | Historical landmarks, Local artisan shops, Community activities |
| Jardim das Américas | Known for its spacious homes and greenery, this area is perfect for families and those looking to escape the city’s hustle. Close to various amenities. | Parks, Family-oriented activities, Local markets |
Understanding Airbnb License Requirements & STR Laws in Guarapuava (2026)
While Guarapuava, Paraná, Brazil currently shows low STR regulations, specific Airbnb license requirements might still exist or change. Always verify the latest short term rental regulations and Airbnb license requirements directly with local government authorities for Guarapuava to ensure full compliance before hosting.
(Source: AirROI data, 2026, based on 1% licensed listings)
Top Performing Airbnb Properties in Guarapuava (2026)
Benchmark your potential! Explore examples of top-performing Airbnb properties in Guarapuavabased on Trailing Twelve Month (TTM) revenue. Analyze their characteristics, revenue, occupancy rate, and ADR to understand what drives success in this market.

Cabana Araucária - Your refuge in Guarapuava
Entire Place • 1 bedroom

QUINTA DA CACHOEIRA - Serra da Esperança Mountain Range
Entire Place • 1 bedroom
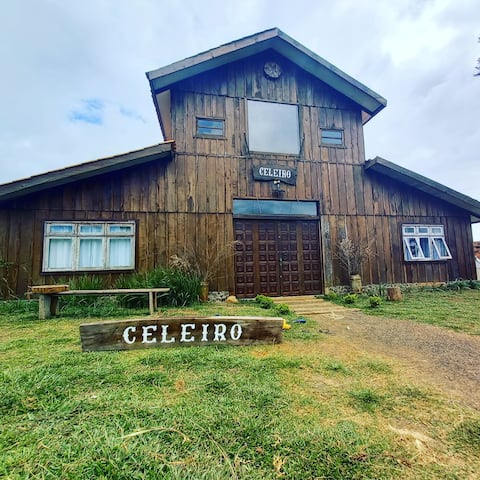
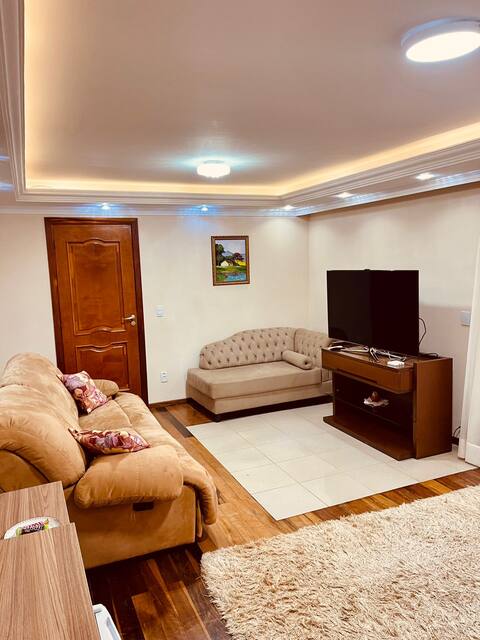
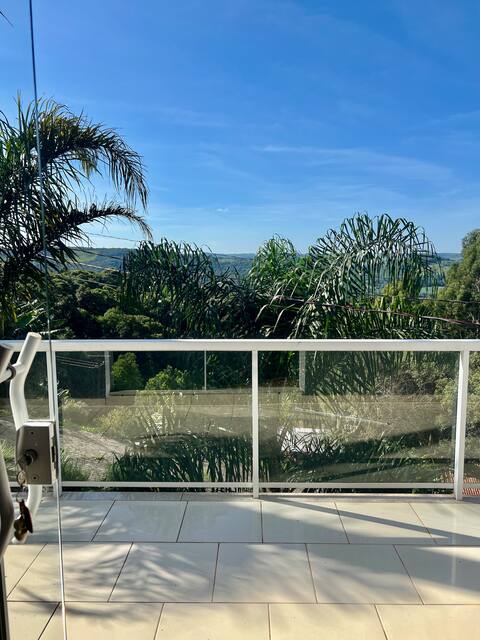
Country House Barn 8 min from downtown Guarapuava
Entire Place • 4 bedrooms

Paiol Farm
Entire Place • 3 bedrooms
Casa de Campo
Entire Place • 4 bedrooms
American-style townhouse
Entire Place • 3 bedrooms
Note: Performance varies based on location, size, amenities, seasonality, and management quality. Data reflects the past 12 months.
Top Performing Airbnb Hosts in Guarapuava (2026)
Learn from the best! This table showcases top-performing Airbnb hosts in Guarapuava based on the number of properties managed and estimated total revenue over the past year. Analyze their scale and performance metrics.
| Host Name | Properties | Grossing Revenue | Stay Reviews | Avg Rating |
|---|---|---|---|---|
| Dandara | 5 | $38,088 | 119 | 4.98/5.0 |
| Cassiano | 14 | $26,361 | 322 | 4.93/5.0 |
| Gustavo | 10 | $25,808 | 377 | 4.93/5.0 |
| Orlando | 1 | $16,753 | 90 | 4.99/5.0 |
| Alfredo | 1 | $15,678 | 26 | 4.92/5.0 |
| Claudio | 6 | $14,661 | 186 | 4.78/5.0 |
| Luiz Manoel | 1 | $13,024 | 7 | 5.00/5.0 |
| EmanueL Henrique | 1 | $11,268 | 4 | 5.00/5.0 |
| Franciele | 1 | $10,442 | 83 | 4.60/5.0 |
| Jandir | 5 | $10,293 | 89 | 4.78/5.0 |
Analyzing the strategies of top hosts, such as their property selection, pricing, and guest communication, can offer valuable lessons for optimizing your own Airbnb operations in Guarapuava.
Dive Deeper: Advanced Guarapuava STR Market Data (2026)
Ready to unlock more insights? AirROI provides access to advanced metrics and comprehensive Airbnb data for Guarapuava. Explore detailed analytics beyond this report to refine your investment strategy, optimize pricing, and maximize your vacation rental profits.
Explore Advanced MetricsGuarapuava Short-Term Rental Market Composition (2026): Property & Room Types
Room Type Distribution
Property Type Distribution
Market Composition Insights for Guarapuava
- The Guarapuava Airbnb market composition is heavily skewed towards Entire Home/Apt listings, which make up 72.6% of the 106 active rentals. This indicates strong guest preference for privacy and space.
- Looking at the property type distribution in Guarapuava, House properties are the most common (44.3%), reflecting the local real estate landscape.
- Houses represent a significant 44.3% portion, catering likely to families or larger groups.
- The presence of 17% Hotel/Boutique listings indicates integration with traditional hospitality.
- Smaller segments like outdoor/unique, others (combined 7.5%) offer potential for unique stay experiences.
Guarapuava Airbnb Room Capacity Analysis (2026): Bedroom Distribution
Distribution of Listings by Number of Bedrooms
Room Capacity Insights for Guarapuava
- The dominant room capacity in Guarapuava is 1 bedroom listings, making up 39.6% of the market. This suggests a strong demand for properties suitable for couples or solo travelers.
- Together, 1 bedroom and 2 bedrooms properties represent 62.2% of the active Airbnb listings in Guarapuava, indicating a high concentration in these sizes.
Guarapuava Vacation Rental Guest Capacity Trends (2026)
Distribution of Listings by Guest Capacity
Guest Capacity Insights for Guarapuava
- The most common guest capacity trend in Guarapuava vacation rentals is listings accommodating 2 guests (23.6%). This suggests the primary traveler segment is likely couples or solo travelers.
- Properties designed for 2 guests and 3 guests dominate the Guarapuava STR market, accounting for 37.8% of listings.
- 18.8% of properties accommodate 6+ guests, serving the market segment for larger families or group travel in Guarapuava.
- On average, properties in Guarapuava are equipped to host 3.2 guests.
Guarapuava Airbnb Booking Patterns (2026): Available vs. Booked Days
Available Days Distribution
Booked Days Distribution
Booking Pattern Insights for Guarapuava
- The most common availability pattern in Guarapuava falls within the 271-366 days range, representing 61.3% of listings. This suggests many properties have significant open periods on their calendars.
- Approximately 89.6% of listings show high availability (181+ days open annually), indicating potential for increased bookings or specific owner usage patterns.
- For booked days, the 31-90 days range is most frequent in Guarapuava (43.4%), reflecting common guest stay durations or potential owner blocking patterns.
- A notable 10.4% of properties secure long booking periods (181+ days booked per year), highlighting successful long-term rental strategies or significant owner usage.
Guarapuava Airbnb Minimum Stay Requirements Analysis
Distribution of Listings by Minimum Night Requirement
1 Night
62 listings
58.5% of total
2 Nights
35 listings
33% of total
3 Nights
2 listings
1.9% of total
30+ Nights
7 listings
6.6% of total
Key Insights
- The most prevalent minimum stay requirement in Guarapuava is 1 Night, adopted by 58.5% of listings. This highlights the market's preference for shorter, flexible bookings.
- A strong majority (91.5%) of the Guarapuava Airbnb data shows acceptance of very short stays (1-2 nights), indicating a dynamic, high-turnover market.
Recommendations
- Align with the market by considering a 1 Night minimum stay, as 58.5% of Guarapuava hosts use this setting.
- Explore offering discounts for stays of 30+ nights to attract the 6.6% of the market seeking extended stays.
- Adjust minimum nights based on seasonality – potentially shorter during low season and longer during peak demand periods in Guarapuava.
Guarapuava Airbnb Cancellation Policy Trends Analysis (2026)
Flexible
59 listings
56.2% of total
Moderate
25 listings
23.8% of total
Firm
14 listings
13.3% of total
Strict
7 listings
6.7% of total
Cancellation Policy Insights for Guarapuava
- The prevailing Airbnb cancellation policy trend in Guarapuava is Flexible, used by 56.2% of listings.
- The market strongly favors guest-friendly terms, with 80.0% of listings offering Flexible or Moderate policies. This suggests guests in Guarapuava may expect booking flexibility.
- Strict cancellation policies are quite rare (6.7%), potentially making listings with this policy less competitive unless justified by high demand or property type.
Recommendations for Hosts
- Consider adopting a Flexible policy to align with the 56.2% market standard in Guarapuava.
- Given the high prevalence of Flexible policies (56.2%), offering this can enhance booking appeal, especially during shoulder seasons.
- Using a Strict policy might deter some guests, as only 6.7% of listings use it. Evaluate if potential revenue protection outweighs possible lower booking rates.
- Regularly review your cancellation policy against competitors and market demand shifts in Guarapuava.
Guarapuava STR Booking Lead Time Analysis (2026)
Average Booking Lead Time by Month
Booking Lead Time Insights for Guarapuava
- The overall average booking lead time for vacation rentals in Guarapuava is 19 days.
- Guests book furthest in advance for stays during January (average 31 days), likely coinciding with peak travel demand or local events.
- The shortest booking windows occur for stays in March (average 9 days), indicating more last-minute travel plans during this time.
- Seasonally, Fall (23 days avg.) sees the longest lead times, while Spring (15 days avg.) has the shortest, reflecting typical travel planning cycles.
Recommendations for Hosts
- Use the overall average lead time (19 days) as a baseline for your pricing and availability strategy in Guarapuava.
- For January stays, consider implementing length-of-stay discounts or slightly higher rates for bookings made less than 31 days out to capitalize on advance planning.
- During March, focus on last-minute booking availability and promotions, as guests book with very short notice (9 days avg.).
- Target marketing efforts for the Fall season well in advance (at least 23 days) to capture early planners.
- Monitor your own booking lead times against these Guarapuava averages to identify opportunities for dynamic pricing adjustments.
Popular & Essential Airbnb Amenities in Guarapuava (2026)
Amenity Prevalence
Amenity Insights for Guarapuava
- Essential amenities in Guarapuava that guests expect include: Wifi. Lacking these (this) could significantly impact bookings.
- Popular amenities like TV, Free parking on premises, Kitchen are common but not universal. Offering these can provide a competitive edge.
Recommendations for Hosts
- Ensure your listing includes all essential amenities for Guarapuava: Wifi.
- Prioritize adding missing essentials: Wifi.
- Consider adding popular differentiators like TV or Free parking on premises to increase appeal.
- Highlight unique or less common amenities you offer (e.g., hot tub, dedicated workspace, EV charger) in your listing description and photos.
- Regularly check competitor amenities in Guarapuava to stay competitive.
Guarapuava Airbnb Guest Demographics & Profile Analysis (2026)
Guest Profile Summary for Guarapuava
- The typical guest profile for Airbnb in Guarapuava consists of primarily domestic travelers (93%), often arriving from nearby Curitiba, typically belonging to the Post-2000s (Gen Z/Alpha) group (50%), primarily speaking Portuguese or English.
- Domestic travelers account for 92.8% of guests.
- Key international markets include Brazil (92.8%) and Paraguay (1.5%).
- Top languages spoken are Portuguese (44.2%) followed by English (27.2%).
- A significant demographic segment is the Post-2000s (Gen Z/Alpha) group, representing 50% of guests.
Recommendations for Hosts
- Target domestic marketing efforts towards travelers from Curitiba and Paraná.
- Tailor amenities and listing descriptions to appeal to the dominant Post-2000s (Gen Z/Alpha) demographic (e.g., highlight fast WiFi, smart home features, local guides).
- Highlight unique local experiences or amenities relevant to the primary guest profile.
- Consider seasonal promotions aligned with peak travel times for key origin markets.
Nearby Short-Term Rental Market Comparison
How does the Guarapuava Airbnb market stack up against its neighbors? Compare key performance metrics like average monthly revenue, ADR, and occupancy rates in surrounding areas to understand the broader regional STR landscape.
| Market | Active Properties | Monthly Revenue | Daily Rate | Avg. Occupancy |
|---|---|---|---|---|
| Irati | 17 | $390 | $50.51 | 25% |
| Castro | 19 | $320 | $84.96 | 22% |
| Treze Tílias | 24 | $288 | $50.55 | 23% |
| Campo Mourão | 43 | $281 | $33.93 | 37% |
| Ponta Grossa | 330 | $275 | $35.92 | 38% |
| Canoinhas | 22 | $265 | $44.09 | 27% |
| Prudentópolis | 32 | $263 | $47.79 | 24% |
| Pato Branco | 87 | $235 | $35.36 | 33% |
| União da Vitória | 17 | $221 | $32.33 | 29% |
| Tibagi | 17 | $203 | $70.23 | 17% |