Campo Largo Airbnb Market Analysis 2026: Short Term Rental Data & Vacation Rental Statistics in Paraná, Brazil
Is Airbnb profitable in Campo Largo in 2026? Explore comprehensive Airbnb analytics for Campo Largo, Paraná, Brazil to uncover income potential. This 2026 STR market report for Campo Largo, based on AirROI data from February 2025 to January 2026, reveals key trends in the niche market of 66 active listings.
Whether you're considering an Airbnb investment in Campo Largo, optimizing your existing vacation rental, or exploring rental arbitrage opportunities, understanding the Campo Largo Airbnb data is crucial. Leveraging the low regulation environment is key to maximizing your short term rental income potential. Let's dive into the specifics.
Key Campo Largo Airbnb Performance Metrics Overview
Monthly Airbnb Revenue Variations & Income Potential in Campo Largo (2026)
Understanding the monthly revenue variations for Airbnb listings in Campo Largo is key to maximizing your short term rental income potential. Seasonality significantly impacts earnings. Our analysis, based on data from the past 12 months, shows that the peak revenue month for STRs in Campo Largo is typically July, while February often presents the lowest earnings, highlighting opportunities for strategic pricing adjustments during shoulder and low seasons. Explore the typical Airbnb income in Campo Largo across different performance tiers:
- Best-in-class properties (Top 10%) achieve $1,792+ monthly, often utilizing dynamic pricing and superior guest experiences.
- Strong performing properties (Top 25%) earn $1,087 or more, indicating effective management and desirable locations/amenities.
- Typical properties (Median) generate around $611 per month, representing the average market performance.
- Entry-level properties (Bottom 25%) see earnings around $299, often with potential for optimization.
Average Monthly Airbnb Earnings Trend in Campo Largo
Campo Largo Airbnb Occupancy Rate Trends (2026)
Maximize your bookings by understanding the Campo Largo STR occupancy trends. Seasonal demand shifts significantly influence how often properties are booked. Typically, Marchsees the highest demand (peak season occupancy), while January experiences the lowest (low season). Effective strategies, like adjusting minimum stays or offering promotions, can boost occupancy during slower periods. Here's how different property tiers perform in Campo Largo:
- Best-in-class properties (Top 10%) achieve 77%+ occupancy, indicating high desirability and potentially optimized availability.
- Strong performing properties (Top 25%) maintain 59% or higher occupancy, suggesting good market fit and guest satisfaction.
- Typical properties (Median) have an occupancy rate around 36%.
- Entry-level properties (Bottom 25%) average 17% occupancy, potentially facing higher vacancy.
Average Monthly Occupancy Rate Trend in Campo Largo
Average Daily Rate (ADR) Airbnb Trends in Campo Largo (2026)
Effective short term rental pricing strategy in Campo Largo involves understanding monthly ADR fluctuations. The Average Daily Rate (ADR) for Airbnb in Campo Largo typically peaks in August and dips lowest during January. Leveraging Airbnb dynamic pricing tools or strategies based on this seasonality can significantly boost revenue. Here's a look at the typical nightly rates achieved:
- Best-in-class properties (Top 10%) command rates of $308+ per night, often due to premium features or locations.
- Strong performing properties (Top 25%) achieve nightly rates of $137 or more.
- Typical properties (Median) charge around $54 per night.
- Entry-level properties (Bottom 25%) earn around $32 per night.
Average Daily Rate (ADR) Trend by Month in Campo Largo
Get Live Campo Largo Market Intelligence 👇

Explore Real-time Analytics
Airbnb Seasonality Analysis & Trends in Campo Largo (2026)
Peak Season (July, September, August)
- Revenue averages $2,016 per month
- Occupancy rates average 38.0%
- Daily rates average $165
Shoulder Season
- Revenue averages $960 per month
- Occupancy maintains around 40.1%
- Daily rates hold near $123
Low Season (January, February, May)
- Revenue drops to average $745 per month
- Occupancy decreases to average 39.6%
- Daily rates adjust to average $124
Seasonality Insights for Campo Largo
- The Airbnb seasonality in Campo Largo shows highly seasonal trends requiring careful strategy. While the sections above show seasonal averages, it's also insightful to look at the extremes:
- During the high season, the absolute peak month showcases Campo Largo's highest earning potential, with monthly revenues capable of climbing to $2,420, occupancy reaching a high of 46.8%, and ADRs peaking at $175.
- Conversely, the slowest single month of the year, typically falling within the low season, marks the market's lowest point. In this month, revenue might dip to $714, occupancy could drop to 31.6%, and ADRs may adjust down to $102.
- Understanding both the seasonal averages and these monthly peaks and troughs in revenue, occupancy, and ADR is crucial for maximizing your Airbnb profit potential in Campo Largo.
Seasonal Strategies for Maximizing Profit
- Peak Season: Maximize revenue through premium pricing and potentially longer minimum stays. Ensure high availability.
- Low Season: Offer competitive pricing, special promotions (e.g., extended stay discounts), and flexible cancellation policies. Target off-season travelers like remote workers or budget-conscious guests.
- Shoulder Seasons: Implement dynamic pricing that balances peak and low rates. Target weekend travelers or specific events. Offer slightly more flexible terms than peak season.
- Regularly analyze your own performance against these Campo Largo seasonality benchmarks and adjust your pricing and availability strategy accordingly.
Best Areas for Airbnb Investment in Campo Largo (2026)
Exploring the top neighborhoods for short-term rentals in Campo Largo? This section highlights key areas, outlining why they are attractive for hosts and guests, along with notable local attractions. Consider these locations based on your target guest profile and investment strategy.
| Neighborhood / Area | Why Host Here? (Target Guests & Appeal) | Key Attractions & Landmarks |
|---|---|---|
| Centro | The heart of Campo Largo with easy access to shops, restaurants, and cultural sites. A bustling area ideal for travelers looking to explore the local culture and history. | Campo Largo Historical Museum, Largo do Parada, Catedral de Campo Largo, local markets, parks and public squares |
| Bairro Santa Clara | A residential neighborhood popular with families and locals, great for long-term stays or visits to local attractions. Close to family-friendly amenities. | Santa Clara Park, local bakeries and shops, community events, proximity to schools |
| Bairro São José | Known for its peaceful atmosphere and green spaces, it's a relaxed area that appeals to those wanting a break from city life while still being close to urban amenities. | São José Park, walking trails, local eateries, peaceful neighborhood ambiance |
| Bairro Lagoa | Offers scenic views and a tranquil setting, making it perfect for guests looking for nature and relaxation. Ideal for weekend getaways. | Lagoa de Campo Largo, nature trails, picnic areas, water activities |
| Bairro Vila Nova | This lively neighborhood features a mix of local life and tourist attractions, with plenty of dining options and vibrant street life. | local restaurants, festivals and community activities, shopping areas |
| Bairro Freitas | A developing area that is becoming increasingly popular for travelers seeking affordable accommodation with easy access to the city center and surrounding attractions. | new developments, local shops, quiet environment, transport links to central Campo Largo |
| Bairro São Francisco | This area combines urban convenience with a family-friendly atmosphere. It's great for longer stays with local amenities nearby. | São Francisco Park, community centers, local cuisine, proximity to schools |
| Bairro Pinhais | Close to Campo Largo and offers a suburban feel with convenience to urban amenities, making it ideal for guests who want both relaxation and city access. | shopping centers, parks, restaurants, easy public transport to Campo Largo |
Understanding Airbnb License Requirements & STR Laws in Campo Largo (2026)
While Campo Largo, Paraná, Brazil currently shows low STR regulations, specific Airbnb license requirements might still exist or change. Always verify the latest short term rental regulations and Airbnb license requirements directly with local government authorities for Campo Largo to ensure full compliance before hosting.
(Source: AirROI data, 2026, finding no licensed listings among those analyzed)
Top Performing Airbnb Properties in Campo Largo (2026)
Benchmark your potential! Explore examples of top-performing Airbnb properties in Campo Largobased on Trailing Twelve Month (TTM) revenue. Analyze their characteristics, revenue, occupancy rate, and ADR to understand what drives success in this market.
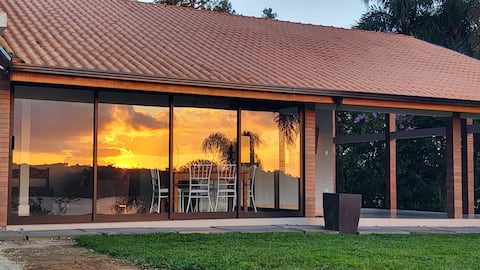
Sunset House Laggus Residential
Entire Place • 2 bedrooms
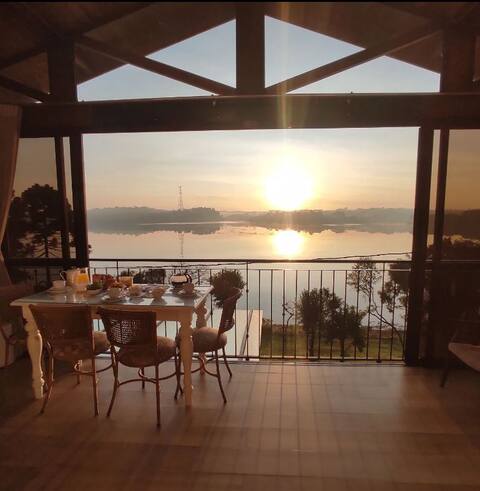
Bela Vista Chalet Laggus Residencial
Entire Place • 1 bedroom

Wonderful Farmhouse with Pool - Campo Largo
Entire Place • 4 bedrooms

Very cozy space!
Entire Place • 3 bedrooms

FARMHOUSE WITH SWIMMING POOL, SOCIAL HALL AND BARBECUE AREA
Entire Place • 6 bedrooms

Fazenda Purunã Headquarters - Amazing views
Entire Place • 5 bedrooms
Note: Performance varies based on location, size, amenities, seasonality, and management quality. Data reflects the past 12 months.
Top Performing Airbnb Hosts in Campo Largo (2026)
Learn from the best! This table showcases top-performing Airbnb hosts in Campo Largo based on the number of properties managed and estimated total revenue over the past year. Analyze their scale and performance metrics.
| Host Name | Properties | Grossing Revenue | Stay Reviews | Avg Rating |
|---|---|---|---|---|
| Laggus | 4 | $181,607 | 25 | 5.00/5.0 |
| Almir | 1 | $36,477 | 18 | 5.00/5.0 |
| Michele | 1 | $30,838 | 18 | 4.94/5.0 |
| Rogério | 1 | $22,281 | 52 | 4.83/5.0 |
| Guilherme | 1 | $21,207 | 22 | 4.86/5.0 |
| Lucas | 1 | $17,854 | 142 | 4.94/5.0 |
| Paulo Rodrigo | 2 | $17,353 | 336 | 4.99/5.0 |
| Ana Claudia | 1 | $16,614 | 27 | 5.00/5.0 |
| Eliandra | 1 | $16,530 | 41 | 5.00/5.0 |
| Recanto Purunã | 1 | $16,414 | 17 | 4.82/5.0 |
Analyzing the strategies of top hosts, such as their property selection, pricing, and guest communication, can offer valuable lessons for optimizing your own Airbnb operations in Campo Largo.
Dive Deeper: Advanced Campo Largo STR Market Data (2026)
Ready to unlock more insights? AirROI provides access to advanced metrics and comprehensive Airbnb data for Campo Largo. Explore detailed analytics beyond this report to refine your investment strategy, optimize pricing, and maximize your vacation rental profits.
Explore Advanced MetricsCampo Largo Short-Term Rental Market Composition (2026): Property & Room Types
Room Type Distribution
Property Type Distribution
Market Composition Insights for Campo Largo
- The Campo Largo Airbnb market composition is heavily skewed towards Entire Home/Apt listings, which make up 97% of the 66 active rentals. This indicates strong guest preference for privacy and space.
- Looking at the property type distribution in Campo Largo, House properties are the most common (43.9%), reflecting the local real estate landscape.
- Houses represent a significant 43.9% portion, catering likely to families or larger groups.
- Smaller segments like hotel/boutique, others (combined 4.5%) offer potential for unique stay experiences.
Campo Largo Airbnb Room Capacity Analysis (2026): Bedroom Distribution
Distribution of Listings by Number of Bedrooms
Room Capacity Insights for Campo Largo
- The dominant room capacity in Campo Largo is 2 bedrooms listings, making up 43.9% of the market. This suggests a strong demand for properties suitable for couples or solo travelers.
- Together, 2 bedrooms and 1 bedroom properties represent 74.2% of the active Airbnb listings in Campo Largo, indicating a high concentration in these sizes.
Campo Largo Vacation Rental Guest Capacity Trends (2026)
Distribution of Listings by Guest Capacity
Guest Capacity Insights for Campo Largo
- The most common guest capacity trend in Campo Largo vacation rentals is listings accommodating 4 guests (30.3%). This suggests the primary traveler segment is likely small families or groups.
- Properties designed for 4 guests and 2 guests dominate the Campo Largo STR market, accounting for 56.1% of listings.
- 27.2% of properties accommodate 6+ guests, serving the market segment for larger families or group travel in Campo Largo.
- On average, properties in Campo Largo are equipped to host 4.5 guests.
Campo Largo Airbnb Booking Patterns (2026): Available vs. Booked Days
Available Days Distribution
Booked Days Distribution
Booking Pattern Insights for Campo Largo
- The most common availability pattern in Campo Largo falls within the 271-366 days range, representing 43.9% of listings. This suggests many properties have significant open periods on their calendars.
- Approximately 77.2% of listings show high availability (181+ days open annually), indicating potential for increased bookings or specific owner usage patterns.
- For booked days, the 91-180 days range is most frequent in Campo Largo (34.8%), reflecting common guest stay durations or potential owner blocking patterns.
- A notable 22.7% of properties secure long booking periods (181+ days booked per year), highlighting successful long-term rental strategies or significant owner usage.
Campo Largo Airbnb Minimum Stay Requirements Analysis
Distribution of Listings by Minimum Night Requirement
1 Night
34 listings
51.5% of total
2 Nights
10 listings
15.2% of total
3 Nights
2 listings
3% of total
4-6 Nights
1 listings
1.5% of total
30+ Nights
19 listings
28.8% of total
Key Insights
- The most prevalent minimum stay requirement in Campo Largo is 1 Night, adopted by 51.5% of listings. This highlights the market's preference for shorter, flexible bookings.
- A strong majority (66.7%) of the Campo Largo Airbnb data shows acceptance of very short stays (1-2 nights), indicating a dynamic, high-turnover market.
- A significant segment (28.8%) caters to monthly stays (30+ nights) in Campo Largo, pointing to opportunities in the extended-stay market.
Recommendations
- Align with the market by considering a 1 Night minimum stay, as 51.5% of Campo Largo hosts use this setting.
- Explore offering discounts for stays of 30+ nights to attract the 28.8% of the market seeking extended stays.
- Adjust minimum nights based on seasonality – potentially shorter during low season and longer during peak demand periods in Campo Largo.
Campo Largo Airbnb Cancellation Policy Trends Analysis (2026)
Limited
1 listings
1.6% of total
Flexible
15 listings
23.4% of total
Moderate
27 listings
42.2% of total
Firm
17 listings
26.6% of total
Strict
4 listings
6.3% of total
Cancellation Policy Insights for Campo Largo
- The prevailing Airbnb cancellation policy trend in Campo Largo is Moderate, used by 42.2% of listings.
- There's a relatively balanced mix between guest-friendly (65.6%) and stricter (32.9%) policies, offering choices for different guest needs.
- Strict cancellation policies are quite rare (6.3%), potentially making listings with this policy less competitive unless justified by high demand or property type.
Recommendations for Hosts
- Consider adopting a Moderate policy to align with the 42.2% market standard in Campo Largo.
- Using a Strict policy might deter some guests, as only 6.3% of listings use it. Evaluate if potential revenue protection outweighs possible lower booking rates.
- Regularly review your cancellation policy against competitors and market demand shifts in Campo Largo.
Campo Largo STR Booking Lead Time Analysis (2026)
Average Booking Lead Time by Month
Booking Lead Time Insights for Campo Largo
- The overall average booking lead time for vacation rentals in Campo Largo is 29 days.
- Guests book furthest in advance for stays during June (average 37 days), likely coinciding with peak travel demand or local events.
- The shortest booking windows occur for stays in February (average 16 days), indicating more last-minute travel plans during this time.
- Seasonally, Summer (27 days avg.) sees the longest lead times, while Winter (20 days avg.) has the shortest, reflecting typical travel planning cycles.
Recommendations for Hosts
- Use the overall average lead time (29 days) as a baseline for your pricing and availability strategy in Campo Largo.
- Target marketing efforts for the Summer season well in advance (at least 27 days) to capture early planners.
- Monitor your own booking lead times against these Campo Largo averages to identify opportunities for dynamic pricing adjustments.
Popular & Essential Airbnb Amenities in Campo Largo (2026)
Amenity Prevalence
Amenity Insights for Campo Largo
- Essential amenities in Campo Largo that guests expect include: Free parking on premises, Kitchen. Lacking these (any) could significantly impact bookings.
- Popular amenities like Wifi, TV, Dishes and silverware are common but not universal. Offering these can provide a competitive edge.
- Warning: Wifi is not universally provided but is considered essential globally. Ensure reliable Wifi is offered.
Recommendations for Hosts
- Ensure your listing includes all essential amenities for Campo Largo: Free parking on premises, Kitchen.
- Prioritize adding missing essentials: Free parking on premises, Kitchen.
- Consider adding popular differentiators like Wifi or TV to increase appeal.
- Highlight unique or less common amenities you offer (e.g., hot tub, dedicated workspace, EV charger) in your listing description and photos.
- Regularly check competitor amenities in Campo Largo to stay competitive.
Campo Largo Airbnb Guest Demographics & Profile Analysis (2026)
Guest Profile Summary for Campo Largo
- The typical guest profile for Airbnb in Campo Largo consists of primarily domestic travelers (96%), often arriving from nearby Curitiba, typically belonging to the Post-2000s (Gen Z/Alpha) group (50%), primarily speaking Portuguese or English.
- Domestic travelers account for 95.7% of guests.
- Key international markets include Brazil (95.7%) and United States (1.2%).
- Top languages spoken are Portuguese (48.9%) followed by English (27.8%).
- A significant demographic segment is the Post-2000s (Gen Z/Alpha) group, representing 50% of guests.
Recommendations for Hosts
- Target domestic marketing efforts towards travelers from Curitiba and Paraná.
- Tailor amenities and listing descriptions to appeal to the dominant Post-2000s (Gen Z/Alpha) demographic (e.g., highlight fast WiFi, smart home features, local guides).
- Highlight unique local experiences or amenities relevant to the primary guest profile.
- Consider seasonal promotions aligned with peak travel times for key origin markets.
Nearby Short-Term Rental Market Comparison
How does the Campo Largo Airbnb market stack up against its neighbors? Compare key performance metrics like average monthly revenue, ADR, and occupancy rates in surrounding areas to understand the broader regional STR landscape.
| Market | Active Properties | Monthly Revenue | Daily Rate | Avg. Occupancy |
|---|---|---|---|---|
| Almirante Tamandaré | 16 | $1,292 | $118.23 | 39% |
| Quatro Barras | 39 | $1,134 | $137.97 | 32% |
| Campo Magro | 24 | $1,069 | $134.14 | 30% |
| Rio dos Cedros | 147 | $993 | $142.58 | 27% |
| Palmeira | 15 | $989 | $131.05 | 29% |
| Balsa Nova | 55 | $982 | $123.19 | 29% |
| Contenda | 11 | $881 | $92.99 | 45% |
| Balneário Camboriú | 4,575 | $867 | $116.75 | 36% |
| Massaranduba | 11 | $844 | $86.77 | 36% |
| Campina Grande do Sul | 97 | $841 | $104.73 | 31% |