Cambé Airbnb Market Analysis 2026: Short Term Rental Data & Vacation Rental Statistics in Paraná, Brazil
Is Airbnb profitable in Cambé in 2026? Explore comprehensive Airbnb analytics for Cambé, Paraná, Brazil to uncover income potential. This 2026 STR market report for Cambé, based on AirROI data from February 2025 to January 2026, reveals key trends in the niche market of 29 active listings.
Whether you're considering an Airbnb investment in Cambé, optimizing your existing vacation rental, or exploring rental arbitrage opportunities, understanding the Cambé Airbnb data is crucial. Leveraging the low regulation environment is key to maximizing your short term rental income potential. Let's dive into the specifics.
Key Cambé Airbnb Performance Metrics Overview
Monthly Airbnb Revenue Variations & Income Potential in Cambé (2026)
Understanding the monthly revenue variations for Airbnb listings in Cambé is key to maximizing your short term rental income potential. Seasonality significantly impacts earnings. Our analysis, based on data from the past 12 months, shows that the peak revenue month for STRs in Cambé is typically April, while July often presents the lowest earnings, highlighting opportunities for strategic pricing adjustments during shoulder and low seasons. Explore the typical Airbnb income in Cambé across different performance tiers:
- Best-in-class properties (Top 10%) achieve $959+ monthly, often utilizing dynamic pricing and superior guest experiences.
- Strong performing properties (Top 25%) earn $585 or more, indicating effective management and desirable locations/amenities.
- Typical properties (Median) generate around $339 per month, representing the average market performance.
- Entry-level properties (Bottom 25%) see earnings around $196, often with potential for optimization.
Average Monthly Airbnb Earnings Trend in Cambé
Cambé Airbnb Occupancy Rate Trends (2026)
Maximize your bookings by understanding the Cambé STR occupancy trends. Seasonal demand shifts significantly influence how often properties are booked. Typically, Aprilsees the highest demand (peak season occupancy), while January experiences the lowest (low season). Effective strategies, like adjusting minimum stays or offering promotions, can boost occupancy during slower periods. Here's how different property tiers perform in Cambé:
- Best-in-class properties (Top 10%) achieve 83%+ occupancy, indicating high desirability and potentially optimized availability.
- Strong performing properties (Top 25%) maintain 63% or higher occupancy, suggesting good market fit and guest satisfaction.
- Typical properties (Median) have an occupancy rate around 39%.
- Entry-level properties (Bottom 25%) average 23% occupancy, potentially facing higher vacancy.
Average Monthly Occupancy Rate Trend in Cambé
Average Daily Rate (ADR) Airbnb Trends in Cambé (2026)
Effective short term rental pricing strategy in Cambé involves understanding monthly ADR fluctuations. The Average Daily Rate (ADR) for Airbnb in Cambé typically peaks in March and dips lowest during September. Leveraging Airbnb dynamic pricing tools or strategies based on this seasonality can significantly boost revenue. Here's a look at the typical nightly rates achieved:
- Best-in-class properties (Top 10%) command rates of $81+ per night, often due to premium features or locations.
- Strong performing properties (Top 25%) achieve nightly rates of $37 or more.
- Typical properties (Median) charge around $24 per night.
- Entry-level properties (Bottom 25%) earn around $20 per night.
Average Daily Rate (ADR) Trend by Month in Cambé
Get Live Cambé Market Intelligence 👇

Explore Real-time Analytics
Airbnb Seasonality Analysis & Trends in Cambé (2026)
Peak Season (April, December, March)
- Revenue averages $577 per month
- Occupancy rates average 55.5%
- Daily rates average $44
Shoulder Season
- Revenue averages $441 per month
- Occupancy maintains around 43.1%
- Daily rates hold near $41
Low Season (January, July, August)
- Revenue drops to average $361 per month
- Occupancy decreases to average 35.8%
- Daily rates adjust to average $42
Seasonality Insights for Cambé
- The Airbnb seasonality in Cambé shows moderate seasonality with distinct peak and low periods. While the sections above show seasonal averages, it's also insightful to look at the extremes:
- During the high season, the absolute peak month showcases Cambé's highest earning potential, with monthly revenues capable of climbing to $607, occupancy reaching a high of 59.8%, and ADRs peaking at $44.
- Conversely, the slowest single month of the year, typically falling within the low season, marks the market's lowest point. In this month, revenue might dip to $351, occupancy could drop to 31.3%, and ADRs may adjust down to $38.
- Understanding both the seasonal averages and these monthly peaks and troughs in revenue, occupancy, and ADR is crucial for maximizing your Airbnb profit potential in Cambé.
Seasonal Strategies for Maximizing Profit
- Peak Season: Maximize revenue through premium pricing and potentially longer minimum stays. Ensure high availability.
- Low Season: Offer competitive pricing, special promotions (e.g., extended stay discounts), and flexible cancellation policies. Target off-season travelers like remote workers or budget-conscious guests.
- Shoulder Seasons: Implement dynamic pricing that balances peak and low rates. Target weekend travelers or specific events. Offer slightly more flexible terms than peak season.
- Regularly analyze your own performance against these Cambé seasonality benchmarks and adjust your pricing and availability strategy accordingly.
Best Areas for Airbnb Investment in Cambé (2026)
Exploring the top neighborhoods for short-term rentals in Cambé? This section highlights key areas, outlining why they are attractive for hosts and guests, along with notable local attractions. Consider these locations based on your target guest profile and investment strategy.
| Neighborhood / Area | Why Host Here? (Target Guests & Appeal) | Key Attractions & Landmarks |
|---|---|---|
| Centro | The heart of Cambé, offering key amenities, dining, and shopping. It's a vibrant area attracting both local travelers and visitors who want close access to urban conveniences. | Shopping Cambé, Catedral de São Sebastião, Ponto de Cultura, Parque Ecológico, Mercado Municipal |
| Jardim Eloá | A residential neighborhood known for its tranquility and proximity to parks, making it suitable for families and longer stays. | Parque Tancredo Neves, Centro de Lazer Tancredo Neves |
| Loteamento Residencial São Paulo | A growing area with new developments, attracting young professionals and families looking for affordable housing options. | Avenidas arborizadas, Praças locais |
| Vila Brasileira | A local neighborhood known for its strong community feel and accessibility to public transport, ideal for guests looking to experience local culture. | Praça Brasil, Comércio local e convivência |
| Vila Santa Cruz | A quieter area with residential charm, appealing for those seeking a peaceful stay while being close to city amenities. | Parque Municipal, Escolas e instalações comerciais |
| Jardim Santo André | A family-friendly neighborhood with parks and green spaces, perfect for guests with children. | Parque Universitário de Cambé, Praça Popular |
| Zona Rural de Cambé | Offers a unique rural experience with natural beauty and local agriculture, attracting guests looking for tranquility and nature. | Natureza exuberante, Culturas locais, Atividades rurais |
| Cambé Centro | With its central location, it serves as a hub for accessing the rest of the city, ideal for short-term stays and business travelers. | Restaurantes locais, Loja de artesanato, Eventos culturais |
Understanding Airbnb License Requirements & STR Laws in Cambé (2026)
While Cambé, Paraná, Brazil currently shows low STR regulations, specific Airbnb license requirements might still exist or change. Always verify the latest short term rental regulations and Airbnb license requirements directly with local government authorities for Cambé to ensure full compliance before hosting.
(Source: AirROI data, 2026, finding no licensed listings among those analyzed)
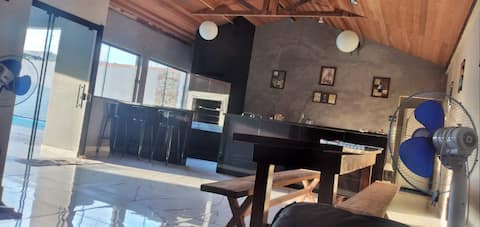
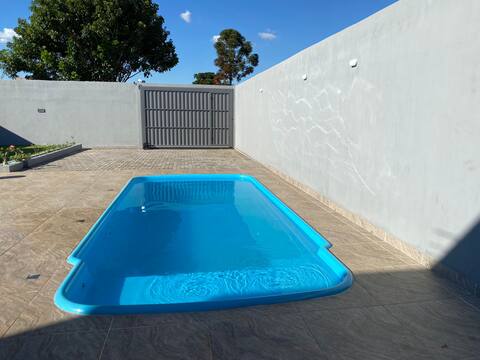
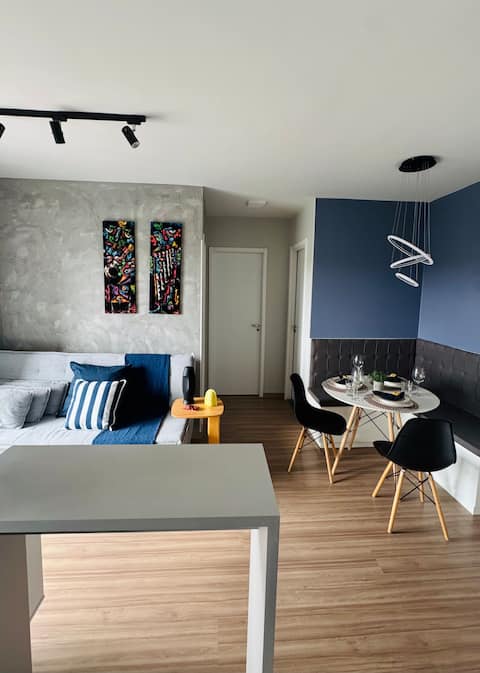
Top Performing Airbnb Properties in Cambé (2026)
Benchmark your potential! Explore examples of top-performing Airbnb properties in Cambébased on Trailing Twelve Month (TTM) revenue. Analyze their characteristics, revenue, occupancy rate, and ADR to understand what drives success in this market.
Family Space
Entire Place • 2 bedrooms
Vovó Cida Party Space (capacity 35 people)
Entire Place • N/A

Complete house with a leisure area
Entire Place • 2 bedrooms
Solar Di Modena
Entire Place • 2 bedrooms
P.L. Apartment
Entire Place • 2 bedrooms
Solar Di capri - Beautiful apartment near NEY BRAGA park
Entire Place • 2 bedrooms
Note: Performance varies based on location, size, amenities, seasonality, and management quality. Data reflects the past 12 months.
Top Performing Airbnb Hosts in Cambé (2026)
Learn from the best! This table showcases top-performing Airbnb hosts in Cambé based on the number of properties managed and estimated total revenue over the past year. Analyze their scale and performance metrics.
| Host Name | Properties | Grossing Revenue | Stay Reviews | Avg Rating |
|---|---|---|---|---|
| Renata | 14 | $30,276 | 299 | 4.79/5.0 |
| Marinalva | 1 | $16,071 | 62 | 4.97/5.0 |
| Walter Barrios | 2 | $13,705 | 74 | 4.97/5.0 |
| Marcelo Salgueiro | 1 | $11,314 | 13 | 4.92/5.0 |
| Fernanda | 1 | $10,569 | 131 | 4.66/5.0 |
| Nathália | 2 | $8,011 | 172 | 4.58/5.0 |
| Maria | 1 | $7,621 | 39 | 4.87/5.0 |
| Adriana | 1 | $5,183 | 13 | 4.77/5.0 |
| Valdir Renato | 1 | $4,410 | 18 | 4.39/5.0 |
| Lorena Mara | 1 | $4,105 | 103 | 4.95/5.0 |
Analyzing the strategies of top hosts, such as their property selection, pricing, and guest communication, can offer valuable lessons for optimizing your own Airbnb operations in Cambé.
Dive Deeper: Advanced Cambé STR Market Data (2026)
Ready to unlock more insights? AirROI provides access to advanced metrics and comprehensive Airbnb data for Cambé. Explore detailed analytics beyond this report to refine your investment strategy, optimize pricing, and maximize your vacation rental profits.
Explore Advanced MetricsCambé Short-Term Rental Market Composition (2026): Property & Room Types
Room Type Distribution
Property Type Distribution
Market Composition Insights for Cambé
- The Cambé Airbnb market composition is heavily skewed towards Entire Home/Apt listings, which make up 100% of the 29 active rentals. This indicates strong guest preference for privacy and space.
- Looking at the property type distribution in Cambé, Apartment/Condo properties are the most common (62.1%), reflecting the local real estate landscape.
- Houses represent a significant 31% portion, catering likely to families or larger groups.
- Smaller segments like hotel/boutique, outdoor/unique (combined 6.8%) offer potential for unique stay experiences.
Cambé Airbnb Room Capacity Analysis (2026): Bedroom Distribution
Distribution of Listings by Number of Bedrooms
Room Capacity Insights for Cambé
- The dominant room capacity in Cambé is 2 bedrooms listings, making up 82.8% of the market. This suggests a strong demand for properties suitable for couples or solo travelers.
- Together, 2 bedrooms and 1 bedroom properties represent 93.1% of the active Airbnb listings in Cambé, indicating a high concentration in these sizes.
- Listings with 3+ bedrooms (3.4%) represent a smaller niche, potentially indicating an underserved market for larger group accommodations in Cambé.
Cambé Vacation Rental Guest Capacity Trends (2026)
Distribution of Listings by Guest Capacity
Guest Capacity Insights for Cambé
- The most common guest capacity trend in Cambé vacation rentals is listings accommodating 6 guests (55.2%). This suggests the primary traveler segment is likely larger groups.
- Properties designed for 6 guests and 8+ guests dominate the Cambé STR market, accounting for 82.8% of listings.
- 82.8% of properties accommodate 6+ guests, serving the market segment for larger families or group travel in Cambé.
- On average, properties in Cambé are equipped to host 6.2 guests.
Cambé Airbnb Booking Patterns (2026): Available vs. Booked Days
Available Days Distribution
Booked Days Distribution
Booking Pattern Insights for Cambé
- The most common availability pattern in Cambé falls within the 271-366 days range, representing 44.8% of listings. This suggests many properties have significant open periods on their calendars.
- Approximately 79.3% of listings show high availability (181+ days open annually), indicating potential for increased bookings or specific owner usage patterns.
- For booked days, the 31-90 days range is most frequent in Cambé (34.5%), reflecting common guest stay durations or potential owner blocking patterns.
- A notable 24.1% of properties secure long booking periods (181+ days booked per year), highlighting successful long-term rental strategies or significant owner usage.
Cambé Airbnb Minimum Stay Requirements Analysis
Distribution of Listings by Minimum Night Requirement
1 Night
11 listings
37.9% of total
2 Nights
5 listings
17.2% of total
4-6 Nights
1 listings
3.4% of total
30+ Nights
12 listings
41.4% of total
Key Insights
- The most prevalent minimum stay requirement in Cambé is 30+ Nights, adopted by 41.4% of listings. This highlights the market's preference for longer commitments.
- A significant segment (41.4%) caters to monthly stays (30+ nights) in Cambé, pointing to opportunities in the extended-stay market.
Recommendations
- Align with the market by considering a 30+ Nights minimum stay, as 41.4% of Cambé hosts use this setting.
- Explore offering discounts for stays of 30+ nights to attract the 41.4% of the market seeking extended stays.
- Adjust minimum nights based on seasonality – potentially shorter during low season and longer during peak demand periods in Cambé.
Cambé Airbnb Cancellation Policy Trends Analysis (2026)
Flexible
16 listings
55.2% of total
Moderate
11 listings
37.9% of total
Firm
2 listings
6.9% of total
Cancellation Policy Insights for Cambé
- The prevailing Airbnb cancellation policy trend in Cambé is Flexible, used by 55.2% of listings.
- The market strongly favors guest-friendly terms, with 93.1% of listings offering Flexible or Moderate policies. This suggests guests in Cambé may expect booking flexibility.
Recommendations for Hosts
- Consider adopting a Flexible policy to align with the 55.2% market standard in Cambé.
- Given the high prevalence of Flexible policies (55.2%), offering this can enhance booking appeal, especially during shoulder seasons.
- Regularly review your cancellation policy against competitors and market demand shifts in Cambé.
Cambé STR Booking Lead Time Analysis (2026)
Average Booking Lead Time by Month
Booking Lead Time Insights for Cambé
- The overall average booking lead time for vacation rentals in Cambé is 19 days.
- Guests book furthest in advance for stays during September (average 45 days), likely coinciding with peak travel demand or local events.
- The shortest booking windows occur for stays in June (average 9 days), indicating more last-minute travel plans during this time.
- Seasonally, Fall (24 days avg.) sees the longest lead times, while Spring (15 days avg.) has the shortest, reflecting typical travel planning cycles.
Recommendations for Hosts
- Use the overall average lead time (19 days) as a baseline for your pricing and availability strategy in Cambé.
- For September stays, consider implementing length-of-stay discounts or slightly higher rates for bookings made less than 45 days out to capitalize on advance planning.
- During June, focus on last-minute booking availability and promotions, as guests book with very short notice (9 days avg.).
- Target marketing efforts for the Fall season well in advance (at least 24 days) to capture early planners.
- Monitor your own booking lead times against these Cambé averages to identify opportunities for dynamic pricing adjustments.
Popular & Essential Airbnb Amenities in Cambé (2026)
Amenity Prevalence
Amenity Insights for Cambé
- Essential amenities in Cambé that guests expect include: Kitchen, Wifi, TV, Free parking on premises. Lacking these (any) could significantly impact bookings.
- Popular amenities like Washer, Iron, Hot water are common but not universal. Offering these can provide a competitive edge.
Recommendations for Hosts
- Ensure your listing includes all essential amenities for Cambé: Kitchen, Wifi, TV, Free parking on premises.
- Prioritize adding missing essentials: Free parking on premises.
- Consider adding popular differentiators like Washer or Iron to increase appeal.
- Highlight unique or less common amenities you offer (e.g., hot tub, dedicated workspace, EV charger) in your listing description and photos.
- Regularly check competitor amenities in Cambé to stay competitive.
Cambé Airbnb Guest Demographics & Profile Analysis (2026)
Guest Profile Summary for Cambé
- The typical guest profile for Airbnb in Cambé consists of primarily domestic travelers (94%), often arriving from nearby São Paulo, typically belonging to the Post-2000s (Gen Z/Alpha) group (50%), primarily speaking Portuguese or English.
- Domestic travelers account for 93.6% of guests.
- Key international markets include Brazil (93.6%) and Australia (2.1%).
- Top languages spoken are Portuguese (47.6%) followed by English (27%).
- A significant demographic segment is the Post-2000s (Gen Z/Alpha) group, representing 50% of guests.
Recommendations for Hosts
- Target domestic marketing efforts towards travelers from São Paulo and Curitiba.
- Tailor amenities and listing descriptions to appeal to the dominant Post-2000s (Gen Z/Alpha) demographic (e.g., highlight fast WiFi, smart home features, local guides).
- Highlight unique local experiences or amenities relevant to the primary guest profile.
- Consider seasonal promotions aligned with peak travel times for key origin markets.
Nearby Short-Term Rental Market Comparison
How does the Cambé Airbnb market stack up against its neighbors? Compare key performance metrics like average monthly revenue, ADR, and occupancy rates in surrounding areas to understand the broader regional STR landscape.
| Market | Active Properties | Monthly Revenue | Daily Rate | Avg. Occupancy |
|---|---|---|---|---|
| Arapongas | 33 | $631 | $71.15 | 34% |
| Londrina | 631 | $410 | $42.10 | 42% |
| Maringá | 602 | $390 | $40.41 | 43% |
| Cornélio Procópio | 13 | $358 | $68.78 | 25% |
| Apucarana | 17 | $330 | $39.59 | 37% |
| Castro | 19 | $320 | $84.96 | 22% |
| Presidente Prudente | 183 | $296 | $36.70 | 40% |
| Rolândia | 11 | $289 | $85.67 | 34% |
| Campo Mourão | 43 | $281 | $33.93 | 37% |
| Paranavaí | 17 | $280 | $38.59 | 42% |