Antonina Airbnb Market Analysis 2026: Short Term Rental Data & Vacation Rental Statistics in Paraná, Brazil
Is Airbnb profitable in Antonina in 2026? Explore comprehensive Airbnb analytics for Antonina, Paraná, Brazil to uncover income potential. This 2026 STR market report for Antonina, based on AirROI data from February 2025 to January 2026, reveals key trends in the niche market of 37 active listings.
Whether you're considering an Airbnb investment in Antonina, optimizing your existing vacation rental, or exploring rental arbitrage opportunities, understanding the Antonina Airbnb data is crucial. Leveraging the low regulation environment is key to maximizing your short term rental income potential. Let's dive into the specifics.
Key Antonina Airbnb Performance Metrics Overview
Monthly Airbnb Revenue Variations & Income Potential in Antonina (2026)
Understanding the monthly revenue variations for Airbnb listings in Antonina is key to maximizing your short term rental income potential. Seasonality significantly impacts earnings. Our analysis, based on data from the past 12 months, shows that the peak revenue month for STRs in Antonina is typically December, while August often presents the lowest earnings, highlighting opportunities for strategic pricing adjustments during shoulder and low seasons. Explore the typical Airbnb income in Antonina across different performance tiers:
- Best-in-class properties (Top 10%) achieve $2,355+ monthly, often utilizing dynamic pricing and superior guest experiences.
- Strong performing properties (Top 25%) earn $1,063 or more, indicating effective management and desirable locations/amenities.
- Typical properties (Median) generate around $420 per month, representing the average market performance.
- Entry-level properties (Bottom 25%) see earnings around $195, often with potential for optimization.
Average Monthly Airbnb Earnings Trend in Antonina
Antonina Airbnb Occupancy Rate Trends (2026)
Maximize your bookings by understanding the Antonina STR occupancy trends. Seasonal demand shifts significantly influence how often properties are booked. Typically, Decembersees the highest demand (peak season occupancy), while August experiences the lowest (low season). Effective strategies, like adjusting minimum stays or offering promotions, can boost occupancy during slower periods. Here's how different property tiers perform in Antonina:
- Best-in-class properties (Top 10%) achieve 54%+ occupancy, indicating high desirability and potentially optimized availability.
- Strong performing properties (Top 25%) maintain 37% or higher occupancy, suggesting good market fit and guest satisfaction.
- Typical properties (Median) have an occupancy rate around 19%.
- Entry-level properties (Bottom 25%) average 10% occupancy, potentially facing higher vacancy.
Average Monthly Occupancy Rate Trend in Antonina
Average Daily Rate (ADR) Airbnb Trends in Antonina (2026)
Effective short term rental pricing strategy in Antonina involves understanding monthly ADR fluctuations. The Average Daily Rate (ADR) for Airbnb in Antonina typically peaks in July and dips lowest during September. Leveraging Airbnb dynamic pricing tools or strategies based on this seasonality can significantly boost revenue. Here's a look at the typical nightly rates achieved:
- Best-in-class properties (Top 10%) command rates of $191+ per night, often due to premium features or locations.
- Strong performing properties (Top 25%) achieve nightly rates of $108 or more.
- Typical properties (Median) charge around $74 per night.
- Entry-level properties (Bottom 25%) earn around $48 per night.
Average Daily Rate (ADR) Trend by Month in Antonina
Get Live Antonina Market Intelligence 👇

Explore Real-time Analytics
Airbnb Seasonality Analysis & Trends in Antonina (2026)
Peak Season (December, March, January)
- Revenue averages $1,185 per month
- Occupancy rates average 31.7%
- Daily rates average $101
Shoulder Season
- Revenue averages $827 per month
- Occupancy maintains around 26.1%
- Daily rates hold near $102
Low Season (June, August, September)
- Revenue drops to average $625 per month
- Occupancy decreases to average 20.4%
- Daily rates adjust to average $102
Seasonality Insights for Antonina
- The Airbnb seasonality in Antonina shows highly seasonal trends requiring careful strategy. While the sections above show seasonal averages, it's also insightful to look at the extremes:
- During the high season, the absolute peak month showcases Antonina's highest earning potential, with monthly revenues capable of climbing to $1,402, occupancy reaching a high of 37.3%, and ADRs peaking at $108.
- Conversely, the slowest single month of the year, typically falling within the low season, marks the market's lowest point. In this month, revenue might dip to $546, occupancy could drop to 17.1%, and ADRs may adjust down to $92.
- Understanding both the seasonal averages and these monthly peaks and troughs in revenue, occupancy, and ADR is crucial for maximizing your Airbnb profit potential in Antonina.
Seasonal Strategies for Maximizing Profit
- Peak Season: Maximize revenue through premium pricing and potentially longer minimum stays. Ensure high availability.
- Low Season: Offer competitive pricing, special promotions (e.g., extended stay discounts), and flexible cancellation policies. Target off-season travelers like remote workers or budget-conscious guests.
- Shoulder Seasons: Implement dynamic pricing that balances peak and low rates. Target weekend travelers or specific events. Offer slightly more flexible terms than peak season.
- Regularly analyze your own performance against these Antonina seasonality benchmarks and adjust your pricing and availability strategy accordingly.
Best Areas for Airbnb Investment in Antonina (2026)
Exploring the top neighborhoods for short-term rentals in Antonina? This section highlights key areas, outlining why they are attractive for hosts and guests, along with notable local attractions. Consider these locations based on your target guest profile and investment strategy.
| Neighborhood / Area | Why Host Here? (Target Guests & Appeal) | Key Attractions & Landmarks |
|---|---|---|
| Centro Histórico | Rich in history and culture, this area showcases colonial architecture and is close to the main attractions of Antonina, attracting both tourists and locals interested in historical experiences. | Casa Romário Martins, Igreja Matriz de Nossa Senhora do Pilar, Museu das Armas, Praça Coronel Macedo, Teatro Municipal |
| Praia de Antonina | A popular beach area that attracts tourists looking for sun and relaxation. Ideal for those wanting a beachfront property with beautiful views. | Praia de Antonina, Passarela da Vila, Mercado do Peixe, Ciclofaixa, Barcos de passeio |
| Ilha do Cardoso | A tranquil island known for its natural beauty and outdoor activities, appealing to travelers looking for eco-friendly and serene surroundings. | Praias do Cardoso, Parque Estadual da Ilha do Cardoso, Trilhas e caminhadas, Observação de aves |
| Baía de Antonina | A scenic bay area that offers picturesque views, making it attractive for guests seeking nature and relaxation by the water. | Ilha do Cardoso, Cais do Porto, Heliporto, Passeios de barco, Praça do Lavradio |
| Sierra de Graciosa | Known for its lush greenery and hiking trails, this area attracts nature lovers and adventure seekers. | Parque Estadual da Graciosa, Caminhadas, Mirantes, Rios e cachoeiras |
| Parque Nacional de Superagüi | A vast national park that is a haven for wildlife and raw nature, perfect for eco-tourism and outdoor activities. | Florestas e praias selvagens, Trilhas ecológicas, Observação de animais |
| Rua XV de Novembro | A vibrant street lined with shops and eateries, ideal for those looking for a lively urban experience close to dining and shopping. | Loja de artesanato, Restaurantes locais, Cafés, Feiras de rua |
| Caminho da Graciosa | Encompassing beautiful coastal views and nature, perfect for scenic getaways and relaxation, appealing to visitors looking for a peaceful retreat. | Estrada histórica, Mirantes, Praias e natureza |
Understanding Airbnb License Requirements & STR Laws in Antonina (2026)
While Antonina, Paraná, Brazil currently shows low STR regulations, specific Airbnb license requirements might still exist or change. Always verify the latest short term rental regulations and Airbnb license requirements directly with local government authorities for Antonina to ensure full compliance before hosting.
(Source: AirROI data, 2026, based on 3% licensed listings)
Top Performing Airbnb Properties in Antonina (2026)
Benchmark your potential! Explore examples of top-performing Airbnb properties in Antoninabased on Trailing Twelve Month (TTM) revenue. Analyze their characteristics, revenue, occupancy rate, and ADR to understand what drives success in this market.
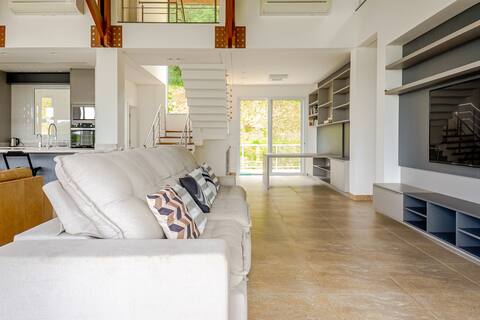
Casa de Campo Southern Reach
Entire Place • 4 bedrooms
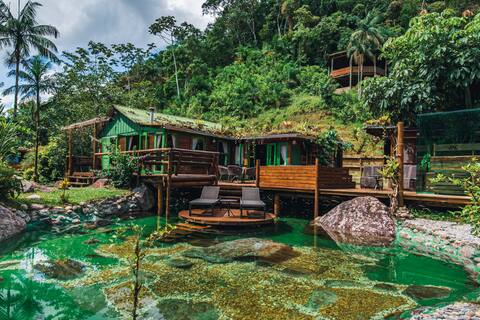
Águas Cabana | Private Pool + Jacuzzi + Sauna
Entire Place • 2 bedrooms

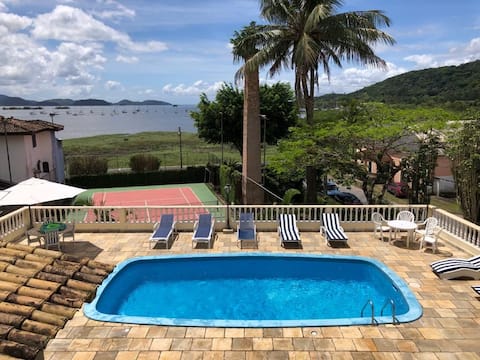
House for 30 people with pool, lake and view
Entire Place • 8 bedrooms
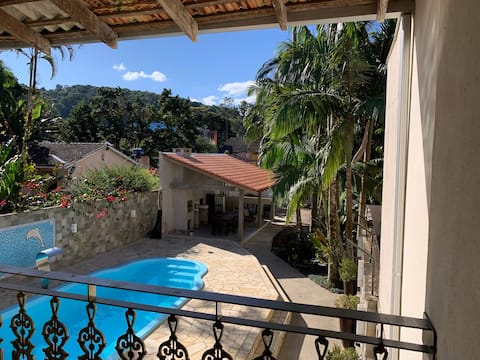
Colonial-style house overlooking the bay
Entire Place • 4 bedrooms
Casa 52
Entire Place • 4 bedrooms

Country house in Antonina - Brazil
Entire Place • 4 bedrooms
Note: Performance varies based on location, size, amenities, seasonality, and management quality. Data reflects the past 12 months.
Top Performing Airbnb Hosts in Antonina (2026)
Learn from the best! This table showcases top-performing Airbnb hosts in Antonina based on the number of properties managed and estimated total revenue over the past year. Analyze their scale and performance metrics.
| Host Name | Properties | Grossing Revenue | Stay Reviews | Avg Rating |
|---|---|---|---|---|
| Andrew | 1 | $43,684 | 75 | 4.99/5.0 |
| Grajagan | 1 | $30,311 | 1 | Not Rated |
| Denise | 1 | $27,597 | 14 | 4.86/5.0 |
| Silvia | 1 | $18,430 | 8 | 4.63/5.0 |
| João Pedro | 1 | $12,164 | 131 | 4.93/5.0 |
| Rafael Andrei | 1 | $11,972 | 5 | 5.00/5.0 |
| Jesiane Chyla | 1 | $10,844 | 6 | 5.00/5.0 |
| Lyri | 1 | $9,094 | 30 | 4.97/5.0 |
| Luis Henrique | 1 | $8,993 | 18 | 4.56/5.0 |
| Felipe Cecílio | 1 | $7,724 | 30 | 5.00/5.0 |
Analyzing the strategies of top hosts, such as their property selection, pricing, and guest communication, can offer valuable lessons for optimizing your own Airbnb operations in Antonina.
Dive Deeper: Advanced Antonina STR Market Data (2026)
Ready to unlock more insights? AirROI provides access to advanced metrics and comprehensive Airbnb data for Antonina. Explore detailed analytics beyond this report to refine your investment strategy, optimize pricing, and maximize your vacation rental profits.
Explore Advanced MetricsAntonina Short-Term Rental Market Composition (2026): Property & Room Types
Room Type Distribution
Property Type Distribution
Market Composition Insights for Antonina
- The Antonina Airbnb market composition is heavily skewed towards Entire Home/Apt listings, which make up 100% of the 37 active rentals. This indicates strong guest preference for privacy and space.
- Looking at the property type distribution in Antonina, House properties are the most common (83.8%), reflecting the local real estate landscape.
- Houses represent a significant 83.8% portion, catering likely to families or larger groups.
- Smaller segments like outdoor/unique (combined 2.7%) offer potential for unique stay experiences.
Antonina Airbnb Room Capacity Analysis (2026): Bedroom Distribution
Distribution of Listings by Number of Bedrooms
Room Capacity Insights for Antonina
- The dominant room capacity in Antonina is 2 bedrooms listings, making up 24.3% of the market. This suggests a strong demand for properties suitable for couples or solo travelers.
- Together, 2 bedrooms and 4 bedrooms properties represent 48.6% of the active Airbnb listings in Antonina, indicating a high concentration in these sizes.
- A significant 51.3% of listings offer 3+ bedrooms, catering to larger groups and families seeking more space in Antonina.
Antonina Vacation Rental Guest Capacity Trends (2026)
Distribution of Listings by Guest Capacity
Guest Capacity Insights for Antonina
- The most common guest capacity trend in Antonina vacation rentals is listings accommodating 8+ guests (54.1%). This suggests the primary traveler segment is likely larger groups.
- Properties designed for 8+ guests and 6 guests dominate the Antonina STR market, accounting for 70.3% of listings.
- 78.4% of properties accommodate 6+ guests, serving the market segment for larger families or group travel in Antonina.
- On average, properties in Antonina are equipped to host 6.5 guests.
Antonina Airbnb Booking Patterns (2026): Available vs. Booked Days
Available Days Distribution
Booked Days Distribution
Booking Pattern Insights for Antonina
- The most common availability pattern in Antonina falls within the 271-366 days range, representing 73% of listings. This suggests many properties have significant open periods on their calendars.
- Approximately 94.6% of listings show high availability (181+ days open annually), indicating potential for increased bookings or specific owner usage patterns.
- For booked days, the 31-90 days range is most frequent in Antonina (40.5%), reflecting common guest stay durations or potential owner blocking patterns.
- A notable 5.4% of properties secure long booking periods (181+ days booked per year), highlighting successful long-term rental strategies or significant owner usage.
Antonina Airbnb Minimum Stay Requirements Analysis
Distribution of Listings by Minimum Night Requirement
1 Night
14 listings
37.8% of total
2 Nights
14 listings
37.8% of total
4-6 Nights
1 listings
2.7% of total
30+ Nights
8 listings
21.6% of total
Key Insights
- The most prevalent minimum stay requirement in Antonina is 1 Night, adopted by 37.8% of listings. This highlights the market's preference for shorter, flexible bookings.
- A strong majority (75.6%) of the Antonina Airbnb data shows acceptance of very short stays (1-2 nights), indicating a dynamic, high-turnover market.
- A significant segment (21.6%) caters to monthly stays (30+ nights) in Antonina, pointing to opportunities in the extended-stay market.
Recommendations
- Align with the market by considering a 1 Night minimum stay, as 37.8% of Antonina hosts use this setting.
- Explore offering discounts for stays of 30+ nights to attract the 21.6% of the market seeking extended stays.
- Adjust minimum nights based on seasonality – potentially shorter during low season and longer during peak demand periods in Antonina.
Antonina Airbnb Cancellation Policy Trends Analysis (2026)
Flexible
14 listings
37.8% of total
Moderate
10 listings
27% of total
Firm
11 listings
29.7% of total
Strict
2 listings
5.4% of total
Cancellation Policy Insights for Antonina
- The prevailing Airbnb cancellation policy trend in Antonina is Flexible, used by 37.8% of listings.
- There's a relatively balanced mix between guest-friendly (64.8%) and stricter (35.1%) policies, offering choices for different guest needs.
- Strict cancellation policies are quite rare (5.4%), potentially making listings with this policy less competitive unless justified by high demand or property type.
Recommendations for Hosts
- Consider adopting a Flexible policy to align with the 37.8% market standard in Antonina.
- Using a Strict policy might deter some guests, as only 5.4% of listings use it. Evaluate if potential revenue protection outweighs possible lower booking rates.
- Regularly review your cancellation policy against competitors and market demand shifts in Antonina.
Antonina STR Booking Lead Time Analysis (2026)
Average Booking Lead Time by Month
Booking Lead Time Insights for Antonina
- The overall average booking lead time for vacation rentals in Antonina is 33 days.
- Guests book furthest in advance for stays during December (average 52 days), likely coinciding with peak travel demand or local events.
- The shortest booking windows occur for stays in May (average 18 days), indicating more last-minute travel plans during this time.
- Seasonally, Winter (45 days avg.) sees the longest lead times, while Spring (23 days avg.) has the shortest, reflecting typical travel planning cycles.
Recommendations for Hosts
- Use the overall average lead time (33 days) as a baseline for your pricing and availability strategy in Antonina.
- For December stays, consider implementing length-of-stay discounts or slightly higher rates for bookings made less than 52 days out to capitalize on advance planning.
- Target marketing efforts for the Winter season well in advance (at least 45 days) to capture early planners.
- Monitor your own booking lead times against these Antonina averages to identify opportunities for dynamic pricing adjustments.
Popular & Essential Airbnb Amenities in Antonina (2026)
Amenity Prevalence
Amenity Insights for Antonina
- Essential amenities in Antonina that guests expect include: Wifi. Lacking these (this) could significantly impact bookings.
- Popular amenities like Kitchen, Free parking on premises, TV are common but not universal. Offering these can provide a competitive edge.
Recommendations for Hosts
- Ensure your listing includes all essential amenities for Antonina: Wifi.
- Prioritize adding missing essentials: Wifi.
- Consider adding popular differentiators like Kitchen or Free parking on premises to increase appeal.
- Highlight unique or less common amenities you offer (e.g., hot tub, dedicated workspace, EV charger) in your listing description and photos.
- Regularly check competitor amenities in Antonina to stay competitive.
Antonina Airbnb Guest Demographics & Profile Analysis (2026)
Guest Profile Summary for Antonina
- The typical guest profile for Airbnb in Antonina consists of primarily domestic travelers (96%), often arriving from nearby Curitiba, typically belonging to the Post-2000s (Gen Z/Alpha) group (50%), primarily speaking Portuguese or English.
- Domestic travelers account for 96.4% of guests.
- Key international markets include Brazil (96.4%) and United Kingdom (1.4%).
- Top languages spoken are Portuguese (47.1%) followed by English (26%).
- A significant demographic segment is the Post-2000s (Gen Z/Alpha) group, representing 50% of guests.
Recommendations for Hosts
- Target domestic marketing efforts towards travelers from Curitiba and Paraná.
- Tailor amenities and listing descriptions to appeal to the dominant Post-2000s (Gen Z/Alpha) demographic (e.g., highlight fast WiFi, smart home features, local guides).
- Highlight unique local experiences or amenities relevant to the primary guest profile.
- Consider seasonal promotions aligned with peak travel times for key origin markets.
Nearby Short-Term Rental Market Comparison
How does the Antonina Airbnb market stack up against its neighbors? Compare key performance metrics like average monthly revenue, ADR, and occupancy rates in surrounding areas to understand the broader regional STR landscape.
| Market | Active Properties | Monthly Revenue | Daily Rate | Avg. Occupancy |
|---|---|---|---|---|
| Almirante Tamandaré | 16 | $1,292 | $118.23 | 39% |
| Quatro Barras | 39 | $1,134 | $137.97 | 32% |
| Campo Magro | 24 | $1,069 | $134.14 | 30% |
| Rio dos Cedros | 147 | $993 | $142.58 | 27% |
| Palmeira | 15 | $989 | $131.05 | 29% |
| Balsa Nova | 55 | $982 | $123.19 | 29% |
| Contenda | 11 | $881 | $92.99 | 45% |
| Balneário Camboriú | 4,575 | $867 | $116.75 | 36% |
| Massaranduba | 11 | $844 | $86.77 | 36% |
| Campina Grande do Sul | 97 | $841 | $104.73 | 31% |