Umuarama Airbnb Market Analysis 2026: Short Term Rental Data & Vacation Rental Statistics in Paraná, Brazil
Is Airbnb profitable in Umuarama in 2026? Explore comprehensive Airbnb analytics for Umuarama, Paraná, Brazil to uncover income potential. This 2026 STR market report for Umuarama, based on AirROI data from February 2025 to January 2026, reveals key trends in the niche market of 49 active listings.
Whether you're considering an Airbnb investment in Umuarama, optimizing your existing vacation rental, or exploring rental arbitrage opportunities, understanding the Umuarama Airbnb data is crucial. Leveraging the low regulation environment is key to maximizing your short term rental income potential. Let's dive into the specifics.
Key Umuarama Airbnb Performance Metrics Overview
Monthly Airbnb Revenue Variations & Income Potential in Umuarama (2026)
Understanding the monthly revenue variations for Airbnb listings in Umuarama is key to maximizing your short term rental income potential. Seasonality significantly impacts earnings. Our analysis, based on data from the past 12 months, shows that the peak revenue month for STRs in Umuarama is typically December, while May often presents the lowest earnings, highlighting opportunities for strategic pricing adjustments during shoulder and low seasons. Explore the typical Airbnb income in Umuarama across different performance tiers:
- Best-in-class properties (Top 10%) achieve $768+ monthly, often utilizing dynamic pricing and superior guest experiences.
- Strong performing properties (Top 25%) earn $551 or more, indicating effective management and desirable locations/amenities.
- Typical properties (Median) generate around $359 per month, representing the average market performance.
- Entry-level properties (Bottom 25%) see earnings around $210, often with potential for optimization.
Average Monthly Airbnb Earnings Trend in Umuarama
Umuarama Airbnb Occupancy Rate Trends (2026)
Maximize your bookings by understanding the Umuarama STR occupancy trends. Seasonal demand shifts significantly influence how often properties are booked. Typically, Februarysees the highest demand (peak season occupancy), while May experiences the lowest (low season). Effective strategies, like adjusting minimum stays or offering promotions, can boost occupancy during slower periods. Here's how different property tiers perform in Umuarama:
- Best-in-class properties (Top 10%) achieve 76%+ occupancy, indicating high desirability and potentially optimized availability.
- Strong performing properties (Top 25%) maintain 60% or higher occupancy, suggesting good market fit and guest satisfaction.
- Typical properties (Median) have an occupancy rate around 39%.
- Entry-level properties (Bottom 25%) average 20% occupancy, potentially facing higher vacancy.
Average Monthly Occupancy Rate Trend in Umuarama
Average Daily Rate (ADR) Airbnb Trends in Umuarama (2026)
Effective short term rental pricing strategy in Umuarama involves understanding monthly ADR fluctuations. The Average Daily Rate (ADR) for Airbnb in Umuarama typically peaks in December and dips lowest during February. Leveraging Airbnb dynamic pricing tools or strategies based on this seasonality can significantly boost revenue. Here's a look at the typical nightly rates achieved:
- Best-in-class properties (Top 10%) command rates of $71+ per night, often due to premium features or locations.
- Strong performing properties (Top 25%) achieve nightly rates of $40 or more.
- Typical properties (Median) charge around $32 per night.
- Entry-level properties (Bottom 25%) earn around $25 per night.
Average Daily Rate (ADR) Trend by Month in Umuarama
Get Live Umuarama Market Intelligence 👇

Explore Real-time Analytics
Airbnb Seasonality Analysis & Trends in Umuarama (2026)
Peak Season (December, March, February)
- Revenue averages $492 per month
- Occupancy rates average 47.6%
- Daily rates average $41
Shoulder Season
- Revenue averages $393 per month
- Occupancy maintains around 39.5%
- Daily rates hold near $43
Low Season (April, May, August)
- Revenue drops to average $332 per month
- Occupancy decreases to average 37.0%
- Daily rates adjust to average $38
Seasonality Insights for Umuarama
- The Airbnb seasonality in Umuarama shows moderate seasonality with distinct peak and low periods. While the sections above show seasonal averages, it's also insightful to look at the extremes:
- During the high season, the absolute peak month showcases Umuarama's highest earning potential, with monthly revenues capable of climbing to $551, occupancy reaching a high of 51.8%, and ADRs peaking at $49.
- Conversely, the slowest single month of the year, typically falling within the low season, marks the market's lowest point. In this month, revenue might dip to $299, occupancy could drop to 33.1%, and ADRs may adjust down to $36.
- Understanding both the seasonal averages and these monthly peaks and troughs in revenue, occupancy, and ADR is crucial for maximizing your Airbnb profit potential in Umuarama.
Seasonal Strategies for Maximizing Profit
- Peak Season: Maximize revenue through premium pricing and potentially longer minimum stays. Ensure high availability.
- Low Season: Offer competitive pricing, special promotions (e.g., extended stay discounts), and flexible cancellation policies. Target off-season travelers like remote workers or budget-conscious guests.
- Shoulder Seasons: Implement dynamic pricing that balances peak and low rates. Target weekend travelers or specific events. Offer slightly more flexible terms than peak season.
- Regularly analyze your own performance against these Umuarama seasonality benchmarks and adjust your pricing and availability strategy accordingly.
Best Areas for Airbnb Investment in Umuarama (2026)
Exploring the top neighborhoods for short-term rentals in Umuarama? This section highlights key areas, outlining why they are attractive for hosts and guests, along with notable local attractions. Consider these locations based on your target guest profile and investment strategy.
| Neighborhood / Area | Why Host Here? (Target Guests & Appeal) | Key Attractions & Landmarks |
|---|---|---|
| Centro | The vibrant heart of Umuarama, offering easy access to shops, restaurants, and cultural landmarks. Ideal for guests wanting to experience local life and amenities. | Teatro Municipal de Umuarama, Praça Miguel D'Arcanjo, Museu de História, Shopping Park Center, Feira Municipal |
| Parque Lago Jaú | A popular area for families and nature lovers, featuring a beautiful lake and recreational areas. Great for those seeking relaxation and outdoor activities. | Lago Jaú, Parque Linear, Caminho das Árvores, Parque Aquático, Espaço Verde |
| Umuarama Shopping | A primary commercial hub in Umuarama, appealing to shoppers and visitors. It has a variety of stores, dining options, and entertainment. | Umuarama Shopping Mall, Cinemas, Food court, Playgrounds, Local events |
| Jardim Independência | A residential neighborhood known for its tranquility and green spaces. Attractive to guests looking for a peaceful stay while still close to the city. | Parque Residencial Lúcio R. de Oliveira, Plazas, Local parks, Family-friendly atmosphere, Nearby schools |
| Bairro São Jorge | An up-and-coming area with new developments and a growing community. Perfect for guests looking to explore the evolving side of Umuarama. | New restaurants, Local markets, Community events, Parks, Cultural centers |
| Jardim Nova Umuarama | A newer neighborhood with modern amenities and family-friendly features. Appeals to those seeking a contemporary living experience. | Brand new parks, Modern housing, Family-oriented facilities, Community spaces, Shops and services |
| Jardim Primavera | Known for its greenery and leisure options, this area attracts visitors looking for a serene environment within the city. | Green parks, Walking trails, Recreational spaces, Local eateries, Outdoor activities |
| Vila Fátima | A vibrant neighborhood with a rich cultural scene and local charm. Great for visitors wanting to immerse themselves in Umuarama's culture. | Cultural events, Local bakeries, Craft fairs, Art markets, Historical points of interest |
Understanding Airbnb License Requirements & STR Laws in Umuarama (2026)
While Umuarama, Paraná, Brazil currently shows low STR regulations, specific Airbnb license requirements might still exist or change. Always verify the latest short term rental regulations and Airbnb license requirements directly with local government authorities for Umuarama to ensure full compliance before hosting.
(Source: AirROI data, 2026, based on 2% licensed listings)
Top Performing Airbnb Properties in Umuarama (2026)
Benchmark your potential! Explore examples of top-performing Airbnb properties in Umuaramabased on Trailing Twelve Month (TTM) revenue. Analyze their characteristics, revenue, occupancy rate, and ADR to understand what drives success in this market.
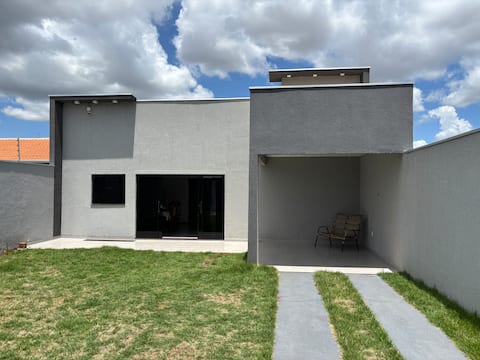
House with 3 en-suites near mall for up to 11 people
Entire Place • 3 bedrooms

Umuarama House. Air conditioning
Entire Place • 3 bedrooms

Entire Apartment - Modern and Cozy
Entire Place • 2 bedrooms
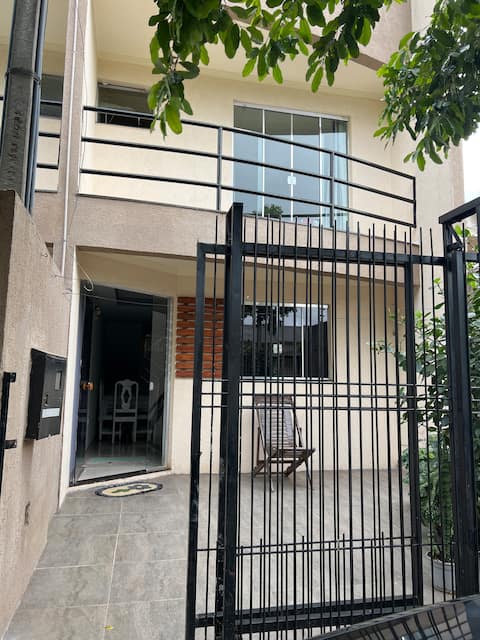
Entire townhouse (downtown) Air conditioning and Wi-Fi
Entire Place • 2 bedrooms

Apartment with air-conditioning and a barbecue grill
Entire Place • 2 bedrooms

1102 Apartment central area - entire
Entire Place • 1 bedroom
Note: Performance varies based on location, size, amenities, seasonality, and management quality. Data reflects the past 12 months.
Top Performing Airbnb Hosts in Umuarama (2026)
Learn from the best! This table showcases top-performing Airbnb hosts in Umuarama based on the number of properties managed and estimated total revenue over the past year. Analyze their scale and performance metrics.
| Host Name | Properties | Grossing Revenue | Stay Reviews | Avg Rating |
|---|---|---|---|---|
| Vanderlei | 5 | $22,111 | 263 | 4.89/5.0 |
| Gisele | 7 | $20,402 | 98 | 4.93/5.0 |
| Saulo | 6 | $17,161 | 144 | 4.91/5.0 |
| Lucas | 3 | $14,761 | 282 | 4.93/5.0 |
| Rute | 1 | $12,937 | 31 | 5.00/5.0 |
| Rafael | 2 | $11,075 | 132 | 4.77/5.0 |
| Diogo | 3 | $10,232 | 64 | 5.00/5.0 |
| Jose | 1 | $9,825 | 84 | 4.95/5.0 |
| Juliana | 1 | $8,474 | 107 | 4.92/5.0 |
| Maximiliano Alexandre | 1 | $8,398 | 122 | 4.90/5.0 |
Analyzing the strategies of top hosts, such as their property selection, pricing, and guest communication, can offer valuable lessons for optimizing your own Airbnb operations in Umuarama.
Dive Deeper: Advanced Umuarama STR Market Data (2026)
Ready to unlock more insights? AirROI provides access to advanced metrics and comprehensive Airbnb data for Umuarama. Explore detailed analytics beyond this report to refine your investment strategy, optimize pricing, and maximize your vacation rental profits.
Explore Advanced MetricsUmuarama Short-Term Rental Market Composition (2026): Property & Room Types
Room Type Distribution
Property Type Distribution
Market Composition Insights for Umuarama
- The Umuarama Airbnb market composition is heavily skewed towards Entire Home/Apt listings, which make up 81.6% of the 49 active rentals. This indicates strong guest preference for privacy and space.
- Looking at the property type distribution in Umuarama, Apartment/Condo properties are the most common (67.3%), reflecting the local real estate landscape.
- Houses represent a significant 22.4% portion, catering likely to families or larger groups.
- Smaller segments like outdoor/unique, hotel/boutique (combined 4.0%) offer potential for unique stay experiences.
Umuarama Airbnb Room Capacity Analysis (2026): Bedroom Distribution
Distribution of Listings by Number of Bedrooms
Room Capacity Insights for Umuarama
- The dominant room capacity in Umuarama is 1 bedroom listings, making up 51% of the market. This suggests a strong demand for properties suitable for couples or solo travelers.
- Together, 1 bedroom and 2 bedrooms properties represent 81.6% of the active Airbnb listings in Umuarama, indicating a high concentration in these sizes.
- With over half the market (51%) consisting of studios or 1-bedroom units, Umuarama is particularly well-suited for individuals or couples.
- Listings with 3+ bedrooms (8.2%) represent a smaller niche, potentially indicating an underserved market for larger group accommodations in Umuarama.
Umuarama Vacation Rental Guest Capacity Trends (2026)
Distribution of Listings by Guest Capacity
Guest Capacity Insights for Umuarama
- The most common guest capacity trend in Umuarama vacation rentals is listings accommodating 2 guests (46.9%). This suggests the primary traveler segment is likely couples or solo travelers.
- Properties designed for 2 guests and 4 guests dominate the Umuarama STR market, accounting for 61.2% of listings.
- A significant 46.9% of listings cater specifically to 1-2 guests, highlighting strong demand from couples and solo travelers in Umuarama.
- 16.3% of properties accommodate 6+ guests, serving the market segment for larger families or group travel in Umuarama.
- On average, properties in Umuarama are equipped to host 3.2 guests.
Umuarama Airbnb Booking Patterns (2026): Available vs. Booked Days
Available Days Distribution
Booked Days Distribution
Booking Pattern Insights for Umuarama
- The most common availability pattern in Umuarama falls within the 181-270 days range, representing 40.8% of listings. This suggests many properties have significant open periods on their calendars.
- Approximately 77.5% of listings show high availability (181+ days open annually), indicating potential for increased bookings or specific owner usage patterns.
- For booked days, the 91-180 days range is most frequent in Umuarama (34.7%), reflecting common guest stay durations or potential owner blocking patterns.
- A notable 28.5% of properties secure long booking periods (181+ days booked per year), highlighting successful long-term rental strategies or significant owner usage.
Umuarama Airbnb Minimum Stay Requirements Analysis
Distribution of Listings by Minimum Night Requirement
1 Night
24 listings
49% of total
2 Nights
11 listings
22.4% of total
4-6 Nights
1 listings
2% of total
7-29 Nights
1 listings
2% of total
30+ Nights
12 listings
24.5% of total
Key Insights
- The most prevalent minimum stay requirement in Umuarama is 1 Night, adopted by 49% of listings. This highlights the market's preference for shorter, flexible bookings.
- A strong majority (71.4%) of the Umuarama Airbnb data shows acceptance of very short stays (1-2 nights), indicating a dynamic, high-turnover market.
- A significant segment (24.5%) caters to monthly stays (30+ nights) in Umuarama, pointing to opportunities in the extended-stay market.
Recommendations
- Align with the market by considering a 1 Night minimum stay, as 49% of Umuarama hosts use this setting.
- Explore offering discounts for stays of 30+ nights to attract the 24.5% of the market seeking extended stays.
- Adjust minimum nights based on seasonality – potentially shorter during low season and longer during peak demand periods in Umuarama.
Umuarama Airbnb Cancellation Policy Trends Analysis (2026)
Limited
1 listings
2% of total
Flexible
33 listings
67.3% of total
Moderate
9 listings
18.4% of total
Firm
6 listings
12.2% of total
Cancellation Policy Insights for Umuarama
- The prevailing Airbnb cancellation policy trend in Umuarama is Flexible, used by 67.3% of listings.
- The market strongly favors guest-friendly terms, with 85.7% of listings offering Flexible or Moderate policies. This suggests guests in Umuarama may expect booking flexibility.
Recommendations for Hosts
- Consider adopting a Flexible policy to align with the 67.3% market standard in Umuarama.
- Given the high prevalence of Flexible policies (67.3%), offering this can enhance booking appeal, especially during shoulder seasons.
- Regularly review your cancellation policy against competitors and market demand shifts in Umuarama.
Umuarama STR Booking Lead Time Analysis (2026)
Average Booking Lead Time by Month
Booking Lead Time Insights for Umuarama
- The overall average booking lead time for vacation rentals in Umuarama is 19 days.
- Guests book furthest in advance for stays during November (average 49 days), likely coinciding with peak travel demand or local events.
- The shortest booking windows occur for stays in June (average 8 days), indicating more last-minute travel plans during this time.
- Seasonally, Fall (25 days avg.) sees the longest lead times, while Summer (13 days avg.) has the shortest, reflecting typical travel planning cycles.
Recommendations for Hosts
- Use the overall average lead time (19 days) as a baseline for your pricing and availability strategy in Umuarama.
- For November stays, consider implementing length-of-stay discounts or slightly higher rates for bookings made less than 49 days out to capitalize on advance planning.
- During June, focus on last-minute booking availability and promotions, as guests book with very short notice (8 days avg.).
- Target marketing efforts for the Fall season well in advance (at least 25 days) to capture early planners.
- Monitor your own booking lead times against these Umuarama averages to identify opportunities for dynamic pricing adjustments.
Popular & Essential Airbnb Amenities in Umuarama (2026)
Amenity Prevalence
Amenity Insights for Umuarama
- Essential amenities in Umuarama that guests expect include: Wifi. Lacking these (this) could significantly impact bookings.
- Popular amenities like TV, Air conditioning, Kitchen are common but not universal. Offering these can provide a competitive edge.
Recommendations for Hosts
- Ensure your listing includes all essential amenities for Umuarama: Wifi.
- Prioritize adding missing essentials: Wifi.
- Consider adding popular differentiators like TV or Air conditioning to increase appeal.
- Highlight unique or less common amenities you offer (e.g., hot tub, dedicated workspace, EV charger) in your listing description and photos.
- Regularly check competitor amenities in Umuarama to stay competitive.
Umuarama Airbnb Guest Demographics & Profile Analysis (2026)
Guest Profile Summary for Umuarama
- The typical guest profile for Airbnb in Umuarama consists of primarily domestic travelers (94%), often arriving from nearby Paraná, typically belonging to the Post-2000s (Gen Z/Alpha) group (50%), primarily speaking Portuguese or English.
- Domestic travelers account for 94.2% of guests.
- Key international markets include Brazil (94.2%) and Peru (1.4%).
- Top languages spoken are Portuguese (44.5%) followed by English (25.1%).
- A significant demographic segment is the Post-2000s (Gen Z/Alpha) group, representing 50% of guests.
Recommendations for Hosts
- Target domestic marketing efforts towards travelers from Paraná and Curitiba.
- Tailor amenities and listing descriptions to appeal to the dominant Post-2000s (Gen Z/Alpha) demographic (e.g., highlight fast WiFi, smart home features, local guides).
- Highlight unique local experiences or amenities relevant to the primary guest profile.
- Consider seasonal promotions aligned with peak travel times for key origin markets.
Nearby Short-Term Rental Market Comparison
How does the Umuarama Airbnb market stack up against its neighbors? Compare key performance metrics like average monthly revenue, ADR, and occupancy rates in surrounding areas to understand the broader regional STR landscape.
| Market | Active Properties | Monthly Revenue | Daily Rate | Avg. Occupancy |
|---|---|---|---|---|
| Palotina | 11 | $526 | $53.59 | 35% |
| Rosana | 17 | $380 | $109.31 | 20% |
| Cascavel | 427 | $299 | $62.27 | 32% |
| Campo Mourão | 43 | $281 | $33.93 | 37% |
| Paranavaí | 17 | $280 | $38.59 | 42% |
| Toledo | 113 | $277 | $38.14 | 35% |
| Guaira | 26 | $259 | $27.51 | 36% |
| Dourados | 186 | $215 | $35.15 | 31% |
| Porto Rico | 64 | $671 | $141.02 | 23% |