Montes Claros Airbnb Market Analysis 2026: Short Term Rental Data & Vacation Rental Statistics in Minas Gerais, Brazil
Is Airbnb profitable in Montes Claros in 2026? Explore comprehensive Airbnb analytics for Montes Claros, Minas Gerais, Brazil to uncover income potential. This 2026 STR market report for Montes Claros, based on AirROI data from February 2025 to January 2026, reveals key trends in the market of 266 active listings.
Whether you're considering an Airbnb investment in Montes Claros, optimizing your existing vacation rental, or exploring rental arbitrage opportunities, understanding the Montes Claros Airbnb data is crucial. Leveraging the low regulation environment is key to maximizing your short term rental income potential. Let's dive into the specifics.
Key Montes Claros Airbnb Performance Metrics Overview
Monthly Airbnb Revenue Variations & Income Potential in Montes Claros (2026)
Understanding the monthly revenue variations for Airbnb listings in Montes Claros is key to maximizing your short term rental income potential. Seasonality significantly impacts earnings. Our analysis, based on data from the past 12 months, shows that the peak revenue month for STRs in Montes Claros is typically December, while November often presents the lowest earnings, highlighting opportunities for strategic pricing adjustments during shoulder and low seasons. Explore the typical Airbnb income in Montes Claros across different performance tiers:
- Best-in-class properties (Top 10%) achieve $746+ monthly, often utilizing dynamic pricing and superior guest experiences.
- Strong performing properties (Top 25%) earn $490 or more, indicating effective management and desirable locations/amenities.
- Typical properties (Median) generate around $254 per month, representing the average market performance.
- Entry-level properties (Bottom 25%) see earnings around $118, often with potential for optimization.
Average Monthly Airbnb Earnings Trend in Montes Claros
Montes Claros Airbnb Occupancy Rate Trends (2026)
Maximize your bookings by understanding the Montes Claros STR occupancy trends. Seasonal demand shifts significantly influence how often properties are booked. Typically, Februarysees the highest demand (peak season occupancy), while November experiences the lowest (low season). Effective strategies, like adjusting minimum stays or offering promotions, can boost occupancy during slower periods. Here's how different property tiers perform in Montes Claros:
- Best-in-class properties (Top 10%) achieve 76%+ occupancy, indicating high desirability and potentially optimized availability.
- Strong performing properties (Top 25%) maintain 55% or higher occupancy, suggesting good market fit and guest satisfaction.
- Typical properties (Median) have an occupancy rate around 32%.
- Entry-level properties (Bottom 25%) average 15% occupancy, potentially facing higher vacancy.
Average Monthly Occupancy Rate Trend in Montes Claros
Average Daily Rate (ADR) Airbnb Trends in Montes Claros (2026)
Effective short term rental pricing strategy in Montes Claros involves understanding monthly ADR fluctuations. The Average Daily Rate (ADR) for Airbnb in Montes Claros typically peaks in December and dips lowest during February. Leveraging Airbnb dynamic pricing tools or strategies based on this seasonality can significantly boost revenue. Here's a look at the typical nightly rates achieved:
- Best-in-class properties (Top 10%) command rates of $44+ per night, often due to premium features or locations.
- Strong performing properties (Top 25%) achieve nightly rates of $33 or more.
- Typical properties (Median) charge around $24 per night.
- Entry-level properties (Bottom 25%) earn around $20 per night.
Average Daily Rate (ADR) Trend by Month in Montes Claros
Get Live Montes Claros Market Intelligence 👇

Explore Real-time Analytics
Airbnb Seasonality Analysis & Trends in Montes Claros (2026)
Peak Season (December, July, October)
- Revenue averages $403 per month
- Occupancy rates average 38.5%
- Daily rates average $34
Shoulder Season
- Revenue averages $349 per month
- Occupancy maintains around 38.6%
- Daily rates hold near $30
Low Season (January, September, November)
- Revenue drops to average $321 per month
- Occupancy decreases to average 32.0%
- Daily rates adjust to average $34
Seasonality Insights for Montes Claros
- The Airbnb seasonality in Montes Claros shows moderate seasonality with distinct peak and low periods. While the sections above show seasonal averages, it's also insightful to look at the extremes:
- During the high season, the absolute peak month showcases Montes Claros's highest earning potential, with monthly revenues capable of climbing to $440, occupancy reaching a high of 43.4%, and ADRs peaking at $35.
- Conversely, the slowest single month of the year, typically falling within the low season, marks the market's lowest point. In this month, revenue might dip to $318, occupancy could drop to 31.3%, and ADRs may adjust down to $29.
- Understanding both the seasonal averages and these monthly peaks and troughs in revenue, occupancy, and ADR is crucial for maximizing your Airbnb profit potential in Montes Claros.
Seasonal Strategies for Maximizing Profit
- Peak Season: Maximize revenue through premium pricing and potentially longer minimum stays. Ensure high availability.
- Low Season: Offer competitive pricing, special promotions (e.g., extended stay discounts), and flexible cancellation policies. Target off-season travelers like remote workers or budget-conscious guests.
- Shoulder Seasons: Implement dynamic pricing that balances peak and low rates. Target weekend travelers or specific events. Offer slightly more flexible terms than peak season.
- Regularly analyze your own performance against these Montes Claros seasonality benchmarks and adjust your pricing and availability strategy accordingly.
Best Areas for Airbnb Investment in Montes Claros (2026)
Exploring the top neighborhoods for short-term rentals in Montes Claros? This section highlights key areas, outlining why they are attractive for hosts and guests, along with notable local attractions. Consider these locations based on your target guest profile and investment strategy.
| Neighborhood / Area | Why Host Here? (Target Guests & Appeal) | Key Attractions & Landmarks |
|---|---|---|
| Centro | The heart of Montes Claros offering a lively atmosphere with shops, restaurants, and a variety of cultural sites. Ideal for travelers looking to experience local life and access key attractions easily. | Igreja Matriz de Nossa Senhora Aparecida, Praca da Abolição, Mercado Municipal, Teatro Municipal, Catedral de Montes Claros |
| Jardim São Paulo | A residential neighborhood with a growing reputation among visitors for its parks and family-friendly environment. Attracts tourists seeking a quieter stay while being close to local amenities. | Parque da Praça, Unimontes, Shopping Popular, Café com Letras |
| Vila São Carlos | Known for its green spaces and proximity to nature, this area is perfect for those who enjoy outdoor activities and a peaceful environment, appealing to nature lovers and families alike. | Parque Municipal Milton Prates, Mirante do Morro do Cristo, Cachoeira do Jatobá |
| Olarias | An up-and-coming neighborhood close to the city center with affordable housing options. This area is attracting young professionals and budget-conscious travelers. | Praça do Bairro Olarias, Feira Livre da Olarias |
| Santo Antônio | A vibrant community with many local restaurants and shops. It's popular among visitors looking for a local experience away from touristy spots. | Caminho do Rio, Parque do Jardim São Paulo, Igreja de Santo Antônio |
| Vila Atlântica | Close to essential services and a key commercial area. Best suited for short-term business stays due to its connectivity and amenities. | Centro Comercial Vila Atlântica, Praça do Comerciante |
| Gercino Coelho | A locality known for its rich cultural atmosphere and local cuisine. A great place for those interested in experiencing the culture of Montes Claros. | Feira de Artesanato, Centro Cultural do Norte de Minas |
| Maria Gonçalves | An area with a strong community vibe and traditional neighborhood feel, attracting families and visitors who want a genuine taste of local living. | Parada Cultural Maria Gonçalves, Capela de Nossa Senhora Aparecida |
Understanding Airbnb License Requirements & STR Laws in Montes Claros (2026)
While Montes Claros, Minas Gerais, Brazil currently shows low STR regulations, specific Airbnb license requirements might still exist or change. Always verify the latest short term rental regulations and Airbnb license requirements directly with local government authorities for Montes Claros to ensure full compliance before hosting.
(Source: AirROI data, 2026, finding no licensed listings among those analyzed)
Top Performing Airbnb Properties in Montes Claros (2026)
Benchmark your potential! Explore examples of top-performing Airbnb properties in Montes Clarosbased on Trailing Twelve Month (TTM) revenue. Analyze their characteristics, revenue, occupancy rate, and ADR to understand what drives success in this market.
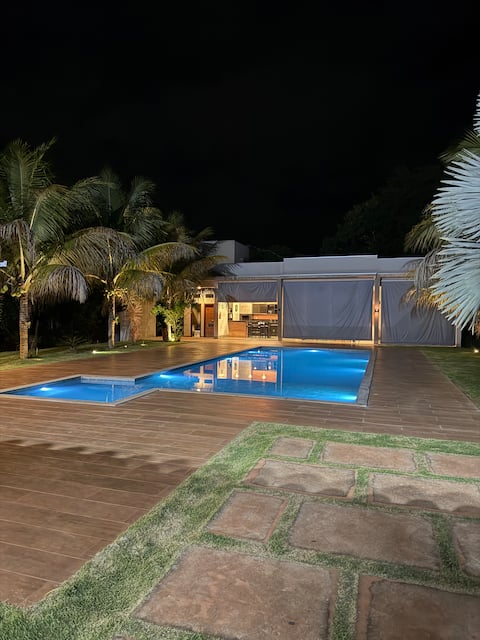
Serene valley
Entire Place • N/A
House with parking and barbecue area
Entire Place • 3 bedrooms
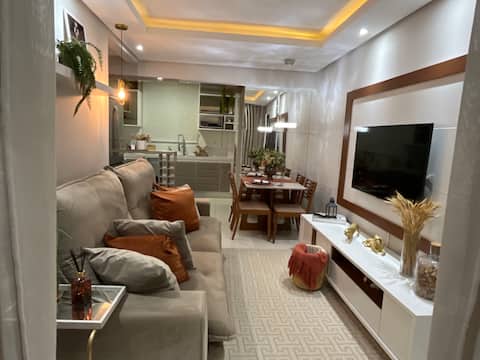
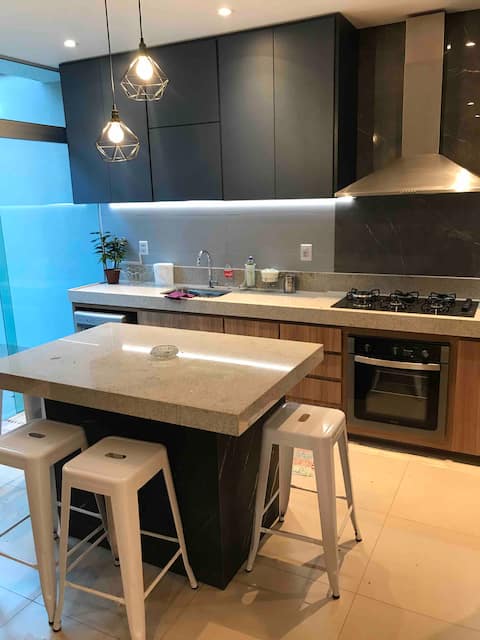
The best apartment in Moc, 3 air conditioners, 3 bedrooms
Entire Place • 3 bedrooms

Large and modern central house with Jacuzzi
Entire Place • 3 bedrooms
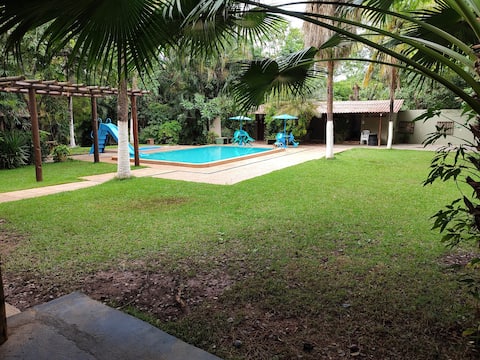
Farmhouse for hosting
Entire Place • 6 bedrooms
Luxury House /3 bedrooms/Jacuzzi
Entire Place • 3 bedrooms
Note: Performance varies based on location, size, amenities, seasonality, and management quality. Data reflects the past 12 months.
Top Performing Airbnb Hosts in Montes Claros (2026)
Learn from the best! This table showcases top-performing Airbnb hosts in Montes Claros based on the number of properties managed and estimated total revenue over the past year. Analyze their scale and performance metrics.
| Host Name | Properties | Grossing Revenue | Stay Reviews | Avg Rating |
|---|---|---|---|---|
| Patricia | 44 | $112,852 | 2540 | 4.83/5.0 |
| Flats Cerrado | 26 | $51,431 | 814 | 4.61/5.0 |
| Francielle | 6 | $38,382 | 312 | 4.94/5.0 |
| Jair | 7 | $31,524 | 349 | 4.94/5.0 |
| Le | 1 | $22,115 | 4 | 4.25/5.0 |
| Andresa | 3 | $20,281 | 365 | 4.96/5.0 |
| Jonathan Bittencourt | 1 | $19,233 | 96 | 4.83/5.0 |
| Matheus | 2 | $17,729 | 179 | 4.71/5.0 |
| Priscilla Borges | 1 | $17,722 | 48 | 5.00/5.0 |
| Douglas | 2 | $16,994 | 59 | 4.92/5.0 |
Analyzing the strategies of top hosts, such as their property selection, pricing, and guest communication, can offer valuable lessons for optimizing your own Airbnb operations in Montes Claros.
Dive Deeper: Advanced Montes Claros STR Market Data (2026)
Ready to unlock more insights? AirROI provides access to advanced metrics and comprehensive Airbnb data for Montes Claros. Explore detailed analytics beyond this report to refine your investment strategy, optimize pricing, and maximize your vacation rental profits.
Explore Advanced MetricsMontes Claros Short-Term Rental Market Composition (2026): Property & Room Types
Room Type Distribution
Property Type Distribution
Market Composition Insights for Montes Claros
- The Montes Claros Airbnb market composition is heavily skewed towards Entire Home/Apt listings, which make up 93.6% of the 266 active rentals. This indicates strong guest preference for privacy and space.
- Looking at the property type distribution in Montes Claros, Apartment/Condo properties are the most common (70.3%), reflecting the local real estate landscape.
- Houses represent a significant 26.7% portion, catering likely to families or larger groups.
- Smaller segments like hotel/boutique, others, outdoor/unique (combined 3.1%) offer potential for unique stay experiences.
Montes Claros Airbnb Room Capacity Analysis (2026): Bedroom Distribution
Distribution of Listings by Number of Bedrooms
Room Capacity Insights for Montes Claros
- The dominant room capacity in Montes Claros is 1 bedroom listings, making up 42.5% of the market. This suggests a strong demand for properties suitable for couples or solo travelers.
- Together, 1 bedroom and 2 bedrooms properties represent 77.8% of the active Airbnb listings in Montes Claros, indicating a high concentration in these sizes.
Montes Claros Vacation Rental Guest Capacity Trends (2026)
Distribution of Listings by Guest Capacity
Guest Capacity Insights for Montes Claros
- The most common guest capacity trend in Montes Claros vacation rentals is listings accommodating 4 guests (22.2%). This suggests the primary traveler segment is likely small families or groups.
- Properties designed for 4 guests and 2 guests dominate the Montes Claros STR market, accounting for 44.4% of listings.
- 22.6% of properties accommodate 6+ guests, serving the market segment for larger families or group travel in Montes Claros.
- On average, properties in Montes Claros are equipped to host 4.0 guests.
Montes Claros Airbnb Booking Patterns (2026): Available vs. Booked Days
Available Days Distribution
Booked Days Distribution
Booking Pattern Insights for Montes Claros
- The most common availability pattern in Montes Claros falls within the 271-366 days range, representing 57.1% of listings. This suggests many properties have significant open periods on their calendars.
- Approximately 86.8% of listings show high availability (181+ days open annually), indicating potential for increased bookings or specific owner usage patterns.
- For booked days, the 31-90 days range is most frequent in Montes Claros (35%), reflecting common guest stay durations or potential owner blocking patterns.
- A notable 13.9% of properties secure long booking periods (181+ days booked per year), highlighting successful long-term rental strategies or significant owner usage.
Montes Claros Airbnb Minimum Stay Requirements Analysis
Distribution of Listings by Minimum Night Requirement
1 Night
158 listings
59.4% of total
2 Nights
39 listings
14.7% of total
3 Nights
12 listings
4.5% of total
4-6 Nights
8 listings
3% of total
30+ Nights
49 listings
18.4% of total
Key Insights
- The most prevalent minimum stay requirement in Montes Claros is 1 Night, adopted by 59.4% of listings. This highlights the market's preference for shorter, flexible bookings.
- A strong majority (74.1%) of the Montes Claros Airbnb data shows acceptance of very short stays (1-2 nights), indicating a dynamic, high-turnover market.
- A significant segment (18.4%) caters to monthly stays (30+ nights) in Montes Claros, pointing to opportunities in the extended-stay market.
Recommendations
- Align with the market by considering a 1 Night minimum stay, as 59.4% of Montes Claros hosts use this setting.
- Explore offering discounts for stays of 30+ nights to attract the 18.4% of the market seeking extended stays.
- Adjust minimum nights based on seasonality – potentially shorter during low season and longer during peak demand periods in Montes Claros.
Montes Claros Airbnb Cancellation Policy Trends Analysis (2026)
Limited
2 listings
0.8% of total
Flexible
75 listings
28.2% of total
Moderate
99 listings
37.2% of total
Firm
72 listings
27.1% of total
Strict
18 listings
6.8% of total
Cancellation Policy Insights for Montes Claros
- The prevailing Airbnb cancellation policy trend in Montes Claros is Moderate, used by 37.2% of listings.
- There's a relatively balanced mix between guest-friendly (65.4%) and stricter (33.9%) policies, offering choices for different guest needs.
- Strict cancellation policies are quite rare (6.8%), potentially making listings with this policy less competitive unless justified by high demand or property type.
Recommendations for Hosts
- Consider adopting a Moderate policy to align with the 37.2% market standard in Montes Claros.
- Using a Strict policy might deter some guests, as only 6.8% of listings use it. Evaluate if potential revenue protection outweighs possible lower booking rates.
- Regularly review your cancellation policy against competitors and market demand shifts in Montes Claros.
Montes Claros STR Booking Lead Time Analysis (2026)
Average Booking Lead Time by Month
Booking Lead Time Insights for Montes Claros
- The overall average booking lead time for vacation rentals in Montes Claros is 15 days.
- Guests book furthest in advance for stays during November (average 22 days), likely coinciding with peak travel demand or local events.
- The shortest booking windows occur for stays in February (average 9 days), indicating more last-minute travel plans during this time.
- Seasonally, Summer (16 days avg.) sees the longest lead times, while Spring (13 days avg.) has the shortest, reflecting typical travel planning cycles.
Recommendations for Hosts
- Use the overall average lead time (15 days) as a baseline for your pricing and availability strategy in Montes Claros.
- Target marketing efforts for the Summer season well in advance (at least 16 days) to capture early planners.
- Monitor your own booking lead times against these Montes Claros averages to identify opportunities for dynamic pricing adjustments.
Popular & Essential Airbnb Amenities in Montes Claros (2026)
Amenity Prevalence
Amenity Insights for Montes Claros
- Essential amenities in Montes Claros that guests expect include: Wifi, Kitchen. Lacking these (any) could significantly impact bookings.
- Popular amenities like TV, Free parking on premises, Bed linens are common but not universal. Offering these can provide a competitive edge.
Recommendations for Hosts
- Ensure your listing includes all essential amenities for Montes Claros: Wifi, Kitchen.
- Prioritize adding missing essentials: Wifi, Kitchen.
- Consider adding popular differentiators like TV or Free parking on premises to increase appeal.
- Highlight unique or less common amenities you offer (e.g., hot tub, dedicated workspace, EV charger) in your listing description and photos.
- Regularly check competitor amenities in Montes Claros to stay competitive.
Montes Claros Airbnb Guest Demographics & Profile Analysis (2026)
Guest Profile Summary for Montes Claros
- The typical guest profile for Airbnb in Montes Claros consists of primarily domestic travelers (96%), often arriving from nearby Belo Horizonte, typically belonging to the Post-2000s (Gen Z/Alpha) group (50%), primarily speaking Portuguese or English.
- Domestic travelers account for 95.6% of guests.
- Key international markets include Brazil (95.6%) and United States (0.7%).
- Top languages spoken are Portuguese (54.6%) followed by English (25.4%).
- A significant demographic segment is the Post-2000s (Gen Z/Alpha) group, representing 50% of guests.
Recommendations for Hosts
- Target domestic marketing efforts towards travelers from Belo Horizonte and São Paulo.
- Tailor amenities and listing descriptions to appeal to the dominant Post-2000s (Gen Z/Alpha) demographic (e.g., highlight fast WiFi, smart home features, local guides).
- Highlight unique local experiences or amenities relevant to the primary guest profile.
- Consider seasonal promotions aligned with peak travel times for key origin markets.
Nearby Short-Term Rental Market Comparison
How does the Montes Claros Airbnb market stack up against its neighbors? Compare key performance metrics like average monthly revenue, ADR, and occupancy rates in surrounding areas to understand the broader regional STR landscape.