Governador Valadares Airbnb Market Analysis 2026: Short Term Rental Data & Vacation Rental Statistics in Minas Gerais, Brazil
Is Airbnb profitable in Governador Valadares in 2026? Explore comprehensive Airbnb analytics for Governador Valadares, Minas Gerais, Brazil to uncover income potential. This 2026 STR market report for Governador Valadares, based on AirROI data from February 2025 to January 2026, reveals key trends in the market of 269 active listings.
Whether you're considering an Airbnb investment in Governador Valadares, optimizing your existing vacation rental, or exploring rental arbitrage opportunities, understanding the Governador Valadares Airbnb data is crucial. Leveraging the low regulation environment is key to maximizing your short term rental income potential. Let's dive into the specifics.
Key Governador Valadares Airbnb Performance Metrics Overview
Monthly Airbnb Revenue Variations & Income Potential in Governador Valadares (2026)
Understanding the monthly revenue variations for Airbnb listings in Governador Valadares is key to maximizing your short term rental income potential. Seasonality significantly impacts earnings. Our analysis, based on data from the past 12 months, shows that the peak revenue month for STRs in Governador Valadares is typically July, while May often presents the lowest earnings, highlighting opportunities for strategic pricing adjustments during shoulder and low seasons. Explore the typical Airbnb income in Governador Valadares across different performance tiers:
- Best-in-class properties (Top 10%) achieve $871+ monthly, often utilizing dynamic pricing and superior guest experiences.
- Strong performing properties (Top 25%) earn $522 or more, indicating effective management and desirable locations/amenities.
- Typical properties (Median) generate around $300 per month, representing the average market performance.
- Entry-level properties (Bottom 25%) see earnings around $146, often with potential for optimization.
Average Monthly Airbnb Earnings Trend in Governador Valadares
Governador Valadares Airbnb Occupancy Rate Trends (2026)
Maximize your bookings by understanding the Governador Valadares STR occupancy trends. Seasonal demand shifts significantly influence how often properties are booked. Typically, Februarysees the highest demand (peak season occupancy), while May experiences the lowest (low season). Effective strategies, like adjusting minimum stays or offering promotions, can boost occupancy during slower periods. Here's how different property tiers perform in Governador Valadares:
- Best-in-class properties (Top 10%) achieve 70%+ occupancy, indicating high desirability and potentially optimized availability.
- Strong performing properties (Top 25%) maintain 50% or higher occupancy, suggesting good market fit and guest satisfaction.
- Typical properties (Median) have an occupancy rate around 29%.
- Entry-level properties (Bottom 25%) average 15% occupancy, potentially facing higher vacancy.
Average Monthly Occupancy Rate Trend in Governador Valadares
Average Daily Rate (ADR) Airbnb Trends in Governador Valadares (2026)
Effective short term rental pricing strategy in Governador Valadares involves understanding monthly ADR fluctuations. The Average Daily Rate (ADR) for Airbnb in Governador Valadares typically peaks in July and dips lowest during February. Leveraging Airbnb dynamic pricing tools or strategies based on this seasonality can significantly boost revenue. Here's a look at the typical nightly rates achieved:
- Best-in-class properties (Top 10%) command rates of $80+ per night, often due to premium features or locations.
- Strong performing properties (Top 25%) achieve nightly rates of $47 or more.
- Typical properties (Median) charge around $30 per night.
- Entry-level properties (Bottom 25%) earn around $23 per night.
Average Daily Rate (ADR) Trend by Month in Governador Valadares
Get Live Governador Valadares Market Intelligence 👇

Explore Real-time Analytics
Airbnb Seasonality Analysis & Trends in Governador Valadares (2026)
Peak Season (July, March, December)
- Revenue averages $487 per month
- Occupancy rates average 37.1%
- Daily rates average $45
Shoulder Season
- Revenue averages $408 per month
- Occupancy maintains around 35.1%
- Daily rates hold near $43
Low Season (January, May, June)
- Revenue drops to average $377 per month
- Occupancy decreases to average 29.4%
- Daily rates adjust to average $45
Seasonality Insights for Governador Valadares
- The Airbnb seasonality in Governador Valadares shows moderate seasonality with distinct peak and low periods. While the sections above show seasonal averages, it's also insightful to look at the extremes:
- During the high season, the absolute peak month showcases Governador Valadares's highest earning potential, with monthly revenues capable of climbing to $510, occupancy reaching a high of 40.6%, and ADRs peaking at $47.
- Conversely, the slowest single month of the year, typically falling within the low season, marks the market's lowest point. In this month, revenue might dip to $353, occupancy could drop to 27.7%, and ADRs may adjust down to $42.
- Understanding both the seasonal averages and these monthly peaks and troughs in revenue, occupancy, and ADR is crucial for maximizing your Airbnb profit potential in Governador Valadares.
Seasonal Strategies for Maximizing Profit
- Peak Season: Maximize revenue through premium pricing and potentially longer minimum stays. Ensure high availability.
- Low Season: Offer competitive pricing, special promotions (e.g., extended stay discounts), and flexible cancellation policies. Target off-season travelers like remote workers or budget-conscious guests.
- Shoulder Seasons: Implement dynamic pricing that balances peak and low rates. Target weekend travelers or specific events. Offer slightly more flexible terms than peak season.
- Regularly analyze your own performance against these Governador Valadares seasonality benchmarks and adjust your pricing and availability strategy accordingly.
Best Areas for Airbnb Investment in Governador Valadares (2026)
Exploring the top neighborhoods for short-term rentals in Governador Valadares? This section highlights key areas, outlining why they are attractive for hosts and guests, along with notable local attractions. Consider these locations based on your target guest profile and investment strategy.
| Neighborhood / Area | Why Host Here? (Target Guests & Appeal) | Key Attractions & Landmarks |
|---|---|---|
| Centro | The central district of Governador Valadares is the hub of commerce and culture, making it an ideal location for tourists and business travelers. It offers a vibrant atmosphere with shops, restaurants, and cultural sites. | Praça do São Sebastião, Parque Natural do Rio Doce, Teatro Atiaia, Museu da Cidade, feiras e eventos locais |
| Terras do Vale | A suburban area known for its peaceful environment and close proximity to natural attractions, making it attractive for families and nature lovers. | Cachoeira do Pinga, Parque Estadual do Rio Doce, trilhas e caminhadas, áreas para piquenique, pontos de observação da fauna |
| Bairro Universitário | Close to universities, this neighborhood attracts students and young professionals, perfect for short-term rentals and affordable stays. | Universidade Vale do Rio Doce, festa universitária, bares e restaurantes de jovens, cultura jovem |
| Jardim do Carmo | A residential neighborhood with good infrastructure and amenities, appealing to families looking for comfort and convenience. | praças do bairro, comércio local, escolas e instituições de ensino, cercania aos centros de saúde |
| Santo Antônio do Manhuaçu | A district with beautiful views and an emerging market for short-term rentals, appealing to tourists exploring the surrounding nature. | mirantes, trilhas, cachoeiras, cultura local, comida típica |
| Cidade Nova | One of the newer neighborhoods with modern amenities, attracting both businesses and families, making it ideal for various guests. | shopping centers, cafés, comércio novo, prédios modernos |
| Prainha | Known for its riverside charm, Prainha is a picturesque area that attracts visitors looking for relaxation and nature activities. | praia do rio, atividades aquáticas, caminhadas pela natureza, pontos para fotos, restaurantes à beira do rio |
| Vila Rica | A growing neighborhood with an authentic local feel, ideal for those looking for an immersive cultural experience. | mercado local, eventos culturais, artesanatos regionais, gastronomia local |
Understanding Airbnb License Requirements & STR Laws in Governador Valadares (2026)
While Governador Valadares, Minas Gerais, Brazil currently shows low STR regulations, specific Airbnb license requirements might still exist or change. Always verify the latest short term rental regulations and Airbnb license requirements directly with local government authorities for Governador Valadares to ensure full compliance before hosting.
(Source: AirROI data, 2026, finding no licensed listings among those analyzed)
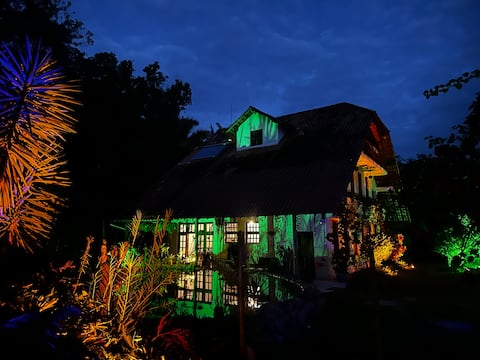
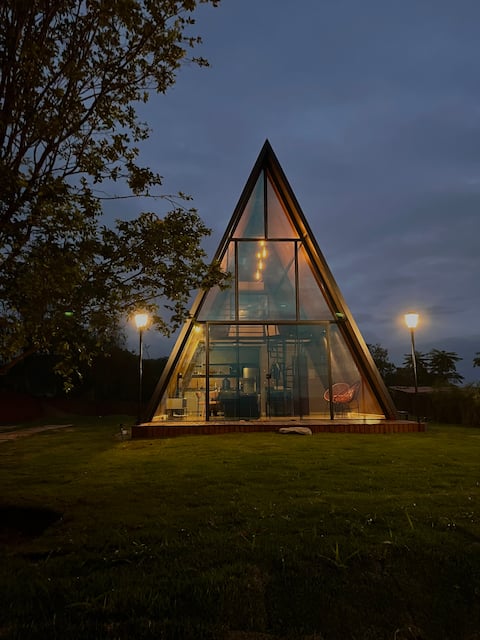
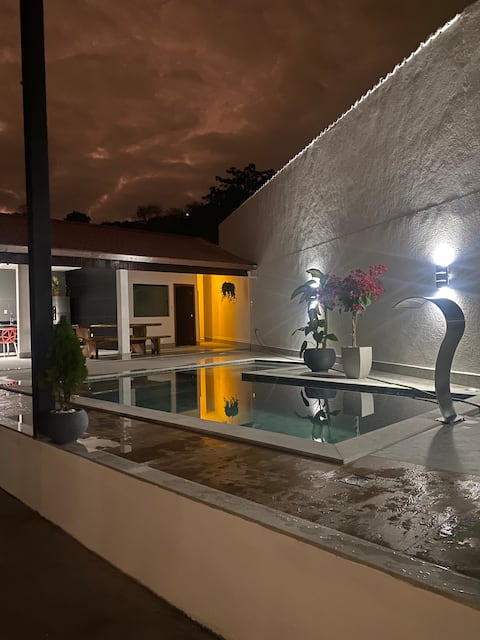
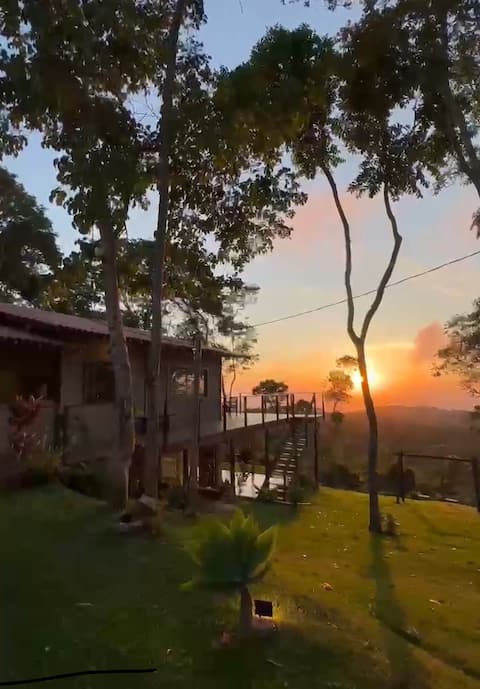
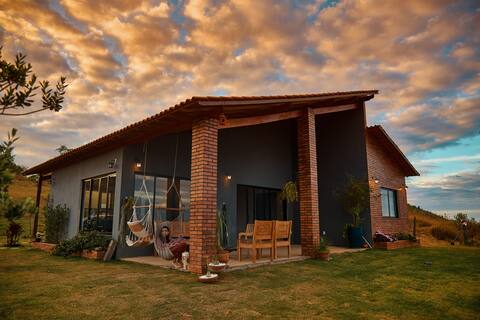
Top Performing Airbnb Properties in Governador Valadares (2026)
Benchmark your potential! Explore examples of top-performing Airbnb properties in Governador Valadaresbased on Trailing Twelve Month (TTM) revenue. Analyze their characteristics, revenue, occupancy rate, and ADR to understand what drives success in this market.
The site of your Eber Silvestre. Pico da Ibituruna
Entire Place • 4 bedrooms
Eller Family Cottage - Ibituruna Peak
Entire Place • 1 bedroom
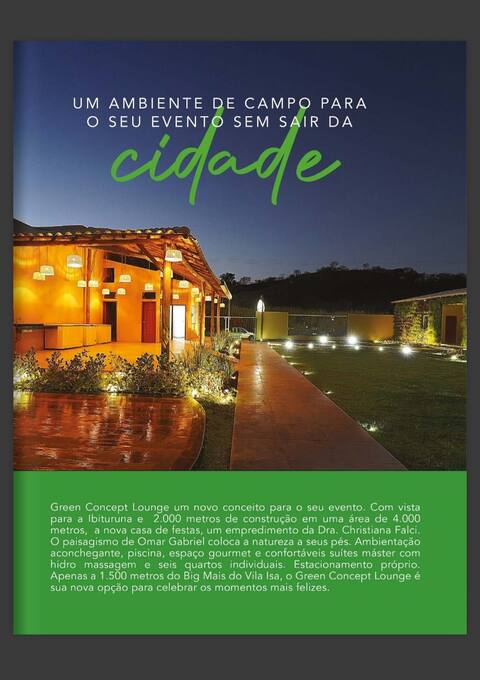
Green Concept Lounge
Entire Place • 9 bedrooms
The nook where you'll find peace and coziness.
Entire Place • 3 bedrooms
Aconchego da Serra Villa. Pico da Ibituruna
Entire Place • 3 bedrooms
Casa da Família Eller - Best view of Ibituruna
Entire Place • 2 bedrooms
Note: Performance varies based on location, size, amenities, seasonality, and management quality. Data reflects the past 12 months.
Top Performing Airbnb Hosts in Governador Valadares (2026)
Learn from the best! This table showcases top-performing Airbnb hosts in Governador Valadares based on the number of properties managed and estimated total revenue over the past year. Analyze their scale and performance metrics.
| Host Name | Properties | Grossing Revenue | Stay Reviews | Avg Rating |
|---|---|---|---|---|
| João Ricardo | 52 | $177,659 | 1180 | 4.87/5.0 |
| Guilherme | 18 | $59,149 | 787 | 4.75/5.0 |
| Wagner | 2 | $41,989 | 56 | 4.96/5.0 |
| Christiana Maria | 2 | $36,299 | 28 | 4.81/5.0 |
| Luciano | 12 | $31,935 | 388 | 4.90/5.0 |
| Liza | 7 | $30,197 | 616 | 4.91/5.0 |
| Eber | 1 | $30,040 | 92 | 4.93/5.0 |
| José Fabrício | 2 | $27,123 | 76 | 4.92/5.0 |
| Andreia | 2 | $25,382 | 113 | 4.96/5.0 |
| Sol | 7 | $23,072 | 266 | 4.86/5.0 |
Analyzing the strategies of top hosts, such as their property selection, pricing, and guest communication, can offer valuable lessons for optimizing your own Airbnb operations in Governador Valadares.
Dive Deeper: Advanced Governador Valadares STR Market Data (2026)
Ready to unlock more insights? AirROI provides access to advanced metrics and comprehensive Airbnb data for Governador Valadares. Explore detailed analytics beyond this report to refine your investment strategy, optimize pricing, and maximize your vacation rental profits.
Explore Advanced MetricsGovernador Valadares Short-Term Rental Market Composition (2026): Property & Room Types
Room Type Distribution
Property Type Distribution
Market Composition Insights for Governador Valadares
- The Governador Valadares Airbnb market composition is heavily skewed towards Entire Home/Apt listings, which make up 91.8% of the 269 active rentals. This indicates strong guest preference for privacy and space.
- Looking at the property type distribution in Governador Valadares, Apartment/Condo properties are the most common (71.4%), reflecting the local real estate landscape.
- Houses represent a significant 24.9% portion, catering likely to families or larger groups.
- Smaller segments like hotel/boutique, outdoor/unique (combined 3.7%) offer potential for unique stay experiences.
Governador Valadares Airbnb Room Capacity Analysis (2026): Bedroom Distribution
Distribution of Listings by Number of Bedrooms
Room Capacity Insights for Governador Valadares
- The dominant room capacity in Governador Valadares is 2 bedrooms listings, making up 46.5% of the market. This suggests a strong demand for properties suitable for couples or solo travelers.
- Together, 2 bedrooms and 1 bedroom properties represent 76.6% of the active Airbnb listings in Governador Valadares, indicating a high concentration in these sizes.
Governador Valadares Vacation Rental Guest Capacity Trends (2026)
Distribution of Listings by Guest Capacity
Guest Capacity Insights for Governador Valadares
- The most common guest capacity trend in Governador Valadares vacation rentals is listings accommodating 4 guests (29.7%). This suggests the primary traveler segment is likely small families or groups.
- Properties designed for 4 guests and 2 guests dominate the Governador Valadares STR market, accounting for 43.8% of listings.
- 26.0% of properties accommodate 6+ guests, serving the market segment for larger families or group travel in Governador Valadares.
- On average, properties in Governador Valadares are equipped to host 4.3 guests.
Governador Valadares Airbnb Booking Patterns (2026): Available vs. Booked Days
Available Days Distribution
Booked Days Distribution
Booking Pattern Insights for Governador Valadares
- The most common availability pattern in Governador Valadares falls within the 271-366 days range, representing 61% of listings. This suggests many properties have significant open periods on their calendars.
- Approximately 91.1% of listings show high availability (181+ days open annually), indicating potential for increased bookings or specific owner usage patterns.
- For booked days, the 31-90 days range is most frequent in Governador Valadares (37.9%), reflecting common guest stay durations or potential owner blocking patterns.
- A notable 10.1% of properties secure long booking periods (181+ days booked per year), highlighting successful long-term rental strategies or significant owner usage.
Governador Valadares Airbnb Minimum Stay Requirements Analysis
Distribution of Listings by Minimum Night Requirement
1 Night
115 listings
42.8% of total
2 Nights
81 listings
30.1% of total
3 Nights
12 listings
4.5% of total
4-6 Nights
1 listings
0.4% of total
7-29 Nights
2 listings
0.7% of total
30+ Nights
58 listings
21.6% of total
Key Insights
- The most prevalent minimum stay requirement in Governador Valadares is 1 Night, adopted by 42.8% of listings. This highlights the market's preference for shorter, flexible bookings.
- A strong majority (72.9%) of the Governador Valadares Airbnb data shows acceptance of very short stays (1-2 nights), indicating a dynamic, high-turnover market.
- A significant segment (21.6%) caters to monthly stays (30+ nights) in Governador Valadares, pointing to opportunities in the extended-stay market.
Recommendations
- Align with the market by considering a 1 Night minimum stay, as 42.8% of Governador Valadares hosts use this setting.
- Explore offering discounts for stays of 30+ nights to attract the 21.6% of the market seeking extended stays.
- Adjust minimum nights based on seasonality – potentially shorter during low season and longer during peak demand periods in Governador Valadares.
Governador Valadares Airbnb Cancellation Policy Trends Analysis (2026)
Limited
7 listings
2.6% of total
Non-refundable
2 listings
0.8% of total
Refundable
1 listings
0.4% of total
Flexible
62 listings
23.3% of total
Moderate
61 listings
22.9% of total
Firm
116 listings
43.6% of total
Strict
17 listings
6.4% of total
Cancellation Policy Insights for Governador Valadares
- The prevailing Airbnb cancellation policy trend in Governador Valadares is Firm, used by 43.6% of listings.
- There's a relatively balanced mix between guest-friendly (46.2%) and stricter (50.0%) policies, offering choices for different guest needs.
- Strict cancellation policies are quite rare (6.4%), potentially making listings with this policy less competitive unless justified by high demand or property type.
Recommendations for Hosts
- Consider adopting a Firm policy to align with the 43.6% market standard in Governador Valadares.
- Using a Strict policy might deter some guests, as only 6.4% of listings use it. Evaluate if potential revenue protection outweighs possible lower booking rates.
- Regularly review your cancellation policy against competitors and market demand shifts in Governador Valadares.
Governador Valadares STR Booking Lead Time Analysis (2026)
Average Booking Lead Time by Month
Booking Lead Time Insights for Governador Valadares
- The overall average booking lead time for vacation rentals in Governador Valadares is 20 days.
- Guests book furthest in advance for stays during December (average 38 days), likely coinciding with peak travel demand or local events.
- The shortest booking windows occur for stays in May (average 11 days), indicating more last-minute travel plans during this time.
- Seasonally, Summer (23 days avg.) sees the longest lead times, while Spring (12 days avg.) has the shortest, reflecting typical travel planning cycles.
Recommendations for Hosts
- Use the overall average lead time (20 days) as a baseline for your pricing and availability strategy in Governador Valadares.
- For December stays, consider implementing length-of-stay discounts or slightly higher rates for bookings made less than 38 days out to capitalize on advance planning.
- During May, focus on last-minute booking availability and promotions, as guests book with very short notice (11 days avg.).
- Target marketing efforts for the Summer season well in advance (at least 23 days) to capture early planners.
- Monitor your own booking lead times against these Governador Valadares averages to identify opportunities for dynamic pricing adjustments.
Popular & Essential Airbnb Amenities in Governador Valadares (2026)
Amenity Prevalence
Amenity Insights for Governador Valadares
- Essential amenities in Governador Valadares that guests expect include: TV, Wifi, Kitchen. Lacking these (any) could significantly impact bookings.
- Popular amenities like Air conditioning, Free parking on premises, Dishes and silverware are common but not universal. Offering these can provide a competitive edge.
Recommendations for Hosts
- Ensure your listing includes all essential amenities for Governador Valadares: TV, Wifi, Kitchen.
- Prioritize adding missing essentials: TV, Wifi, Kitchen.
- Consider adding popular differentiators like Air conditioning or Free parking on premises to increase appeal.
- Highlight unique or less common amenities you offer (e.g., hot tub, dedicated workspace, EV charger) in your listing description and photos.
- Regularly check competitor amenities in Governador Valadares to stay competitive.
Governador Valadares Airbnb Guest Demographics & Profile Analysis (2026)
Guest Profile Summary for Governador Valadares
- The typical guest profile for Airbnb in Governador Valadares consists of primarily domestic travelers (92%), often arriving from nearby Belo Horizonte, typically belonging to the Post-2000s (Gen Z/Alpha) group (50%), primarily speaking Portuguese or English.
- Domestic travelers account for 92.4% of guests.
- Key international markets include Brazil (92.4%) and United States (4.8%).
- Top languages spoken are Portuguese (52.9%) followed by English (29.2%).
- A significant demographic segment is the Post-2000s (Gen Z/Alpha) group, representing 50% of guests.
Recommendations for Hosts
- Target domestic marketing efforts towards travelers from Belo Horizonte and Governador Valadares.
- Tailor amenities and listing descriptions to appeal to the dominant Post-2000s (Gen Z/Alpha) demographic (e.g., highlight fast WiFi, smart home features, local guides).
- Highlight unique local experiences or amenities relevant to the primary guest profile.
- Consider seasonal promotions aligned with peak travel times for key origin markets.
Nearby Short-Term Rental Market Comparison
How does the Governador Valadares Airbnb market stack up against its neighbors? Compare key performance metrics like average monthly revenue, ADR, and occupancy rates in surrounding areas to understand the broader regional STR landscape.
| Market | Active Properties | Monthly Revenue | Daily Rate | Avg. Occupancy |
|---|---|---|---|---|
| Santa Teresa | 306 | $708 | $117.81 | 25% |
| Aracruz | 107 | $428 | $102.72 | 24% |
| Colatina | 13 | $290 | $29.21 | 45% |
| Timóteo | 19 | $267 | $40.06 | 34% |
| Ipatinga | 125 | $256 | $34.40 | 36% |
| Linhares | 70 | $209 | $55.32 | 26% |
| Pancas | 10 | $204 | $50.65 | 18% |
| Teófilo Otoni | 21 | $194 | $50.41 | 26% |
| Caratinga | 22 | $148 | $59.21 | 23% |