Camanducaia Airbnb Market Analysis 2026: Short Term Rental Data & Vacation Rental Statistics in Minas Gerais, Brazil
Is Airbnb profitable in Camanducaia in 2026? Explore comprehensive Airbnb analytics for Camanducaia, Minas Gerais, Brazil to uncover income potential. This 2026 STR market report for Camanducaia, based on AirROI data from February 2025 to January 2026, reveals key trends in the market of 605 active listings.
Whether you're considering an Airbnb investment in Camanducaia, optimizing your existing vacation rental, or exploring rental arbitrage opportunities, understanding the Camanducaia Airbnb data is crucial. Leveraging the low regulation environment is key to maximizing your short term rental income potential. Let's dive into the specifics.
Key Camanducaia Airbnb Performance Metrics Overview
Monthly Airbnb Revenue Variations & Income Potential in Camanducaia (2026)
Understanding the monthly revenue variations for Airbnb listings in Camanducaia is key to maximizing your short term rental income potential. Seasonality significantly impacts earnings. Our analysis, based on data from the past 12 months, shows that the peak revenue month for STRs in Camanducaia is typically July, while February often presents the lowest earnings, highlighting opportunities for strategic pricing adjustments during shoulder and low seasons. Explore the typical Airbnb income in Camanducaia across different performance tiers:
- Best-in-class properties (Top 10%) achieve $2,379+ monthly, often utilizing dynamic pricing and superior guest experiences.
- Strong performing properties (Top 25%) earn $1,364 or more, indicating effective management and desirable locations/amenities.
- Typical properties (Median) generate around $733 per month, representing the average market performance.
- Entry-level properties (Bottom 25%) see earnings around $365, often with potential for optimization.
Average Monthly Airbnb Earnings Trend in Camanducaia
Camanducaia Airbnb Occupancy Rate Trends (2026)
Maximize your bookings by understanding the Camanducaia STR occupancy trends. Seasonal demand shifts significantly influence how often properties are booked. Typically, Julysees the highest demand (peak season occupancy), while January experiences the lowest (low season). Effective strategies, like adjusting minimum stays or offering promotions, can boost occupancy during slower periods. Here's how different property tiers perform in Camanducaia:
- Best-in-class properties (Top 10%) achieve 60%+ occupancy, indicating high desirability and potentially optimized availability.
- Strong performing properties (Top 25%) maintain 41% or higher occupancy, suggesting good market fit and guest satisfaction.
- Typical properties (Median) have an occupancy rate around 24%.
- Entry-level properties (Bottom 25%) average 13% occupancy, potentially facing higher vacancy.
Average Monthly Occupancy Rate Trend in Camanducaia
Average Daily Rate (ADR) Airbnb Trends in Camanducaia (2026)
Effective short term rental pricing strategy in Camanducaia involves understanding monthly ADR fluctuations. The Average Daily Rate (ADR) for Airbnb in Camanducaia typically peaks in July and dips lowest during February. Leveraging Airbnb dynamic pricing tools or strategies based on this seasonality can significantly boost revenue. Here's a look at the typical nightly rates achieved:
- Best-in-class properties (Top 10%) command rates of $202+ per night, often due to premium features or locations.
- Strong performing properties (Top 25%) achieve nightly rates of $144 or more.
- Typical properties (Median) charge around $99 per night.
- Entry-level properties (Bottom 25%) earn around $67 per night.
Average Daily Rate (ADR) Trend by Month in Camanducaia
Get Live Camanducaia Market Intelligence 👇

Explore Real-time Analytics
Airbnb Seasonality Analysis & Trends in Camanducaia (2026)
Peak Season (July, June, December)
- Revenue averages $1,426 per month
- Occupancy rates average 36.7%
- Daily rates average $126
Shoulder Season
- Revenue averages $997 per month
- Occupancy maintains around 28.9%
- Daily rates hold near $116
Low Season (January, February, October)
- Revenue drops to average $791 per month
- Occupancy decreases to average 23.5%
- Daily rates adjust to average $114
Seasonality Insights for Camanducaia
- The Airbnb seasonality in Camanducaia shows highly seasonal trends requiring careful strategy. While the sections above show seasonal averages, it's also insightful to look at the extremes:
- During the high season, the absolute peak month showcases Camanducaia's highest earning potential, with monthly revenues capable of climbing to $1,777, occupancy reaching a high of 43.9%, and ADRs peaking at $129.
- Conversely, the slowest single month of the year, typically falling within the low season, marks the market's lowest point. In this month, revenue might dip to $648, occupancy could drop to 22.3%, and ADRs may adjust down to $109.
- Understanding both the seasonal averages and these monthly peaks and troughs in revenue, occupancy, and ADR is crucial for maximizing your Airbnb profit potential in Camanducaia.
Seasonal Strategies for Maximizing Profit
- Peak Season: Maximize revenue through premium pricing and potentially longer minimum stays. Ensure high availability.
- Low Season: Offer competitive pricing, special promotions (e.g., extended stay discounts), and flexible cancellation policies. Target off-season travelers like remote workers or budget-conscious guests.
- Shoulder Seasons: Implement dynamic pricing that balances peak and low rates. Target weekend travelers or specific events. Offer slightly more flexible terms than peak season.
- Regularly analyze your own performance against these Camanducaia seasonality benchmarks and adjust your pricing and availability strategy accordingly.
Best Areas for Airbnb Investment in Camanducaia (2026)
Exploring the top neighborhoods for short-term rentals in Camanducaia? This section highlights key areas, outlining why they are attractive for hosts and guests, along with notable local attractions. Consider these locations based on your target guest profile and investment strategy.
| Neighborhood / Area | Why Host Here? (Target Guests & Appeal) | Key Attractions & Landmarks |
|---|---|---|
| Pico do Selado | A breathtaking mountain peak in Camanducaia, ideal for nature lovers and hikers. Offers stunning views and a sense of adventure for visitors looking to connect with the outdoors. | Pico do Selado hiking trails, Waterfalls in the region, Scenic viewpoints, Birdwatching, Adventure tourism activities |
| Parque Nacional da Serra da Mantiqueira | A national park known for its rich biodiversity and beautiful landscapes. Great for tourists interested in eco-tourism, hiking, and experiencing Brazil's natural beauty. | Hiking trails, Wildlife observation, Waterfalls, Camping areas, Scenic drives |
| Sítio do Picapau Amarelo | A charming site based on the famous Brazilian children's book, appealing to families and those looking for a whimsical experience. Ideal for family-oriented Airbnb listings. | Children's park, Interactive experiences, Cultural activities, Nature trails, Picnic areas |
| Bosque da Ribeira | A tranquil forest area perfect for relaxation and nature activities. Attracts visitors looking for peace, quiet, and connection to nature, an ideal retreat. | Walking trails, Nature observation, Picnic spots, Birdwatching, Relaxation areas |
| Cascata do Simão | A beautiful waterfall that is perfect for outdoor enthusiasts and photographers. A popular spot for day trips, making it a lucrative location for short-term rentals. | Waterfall viewing, Natural swimming pools, Hiking trails, Photography spots |
| Centro de Camanducaia | The heart of Camanducaia with local shops, restaurants, and cultural experiences. A convenient location for tourists wishing to explore the town's offerings. | Local markets, Restaurants and cafés, Cultural events, Historical architecture, Shopping |
| Represa de Camanducaia | A serene reservoir that offers water sports, fishing, and relaxation opportunities. Perfect for travelers looking for recreational activities and beautiful landscapes. | Fishing spots, Kayaking, Relaxation areas, Waterfront trails |
| Mirante do Cruzeiro | An observation point that provides panoramic views of the surrounding mountains and valleys. A popular spot for sunset viewing and photography, attracting tourists. | Viewpoint, Hiking access, Tourist facilities, Photography opportunities |
Understanding Airbnb License Requirements & STR Laws in Camanducaia (2026)
While Camanducaia, Minas Gerais, Brazil currently shows low STR regulations, specific Airbnb license requirements might still exist or change. Always verify the latest short term rental regulations and Airbnb license requirements directly with local government authorities for Camanducaia to ensure full compliance before hosting.
(Source: AirROI data, 2026, based on 0% licensed listings)
Top Performing Airbnb Properties in Camanducaia (2026)
Benchmark your potential! Explore examples of top-performing Airbnb properties in Camanducaiabased on Trailing Twelve Month (TTM) revenue. Analyze their characteristics, revenue, occupancy rate, and ADR to understand what drives success in this market.

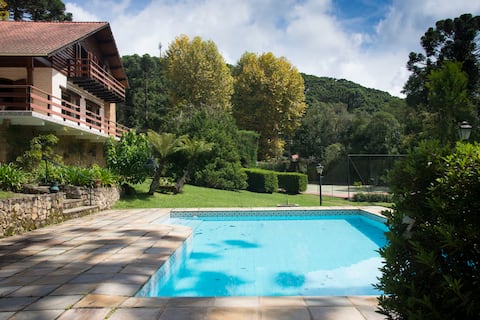
Casa Mundo Verde - Mansion in Serra da Mantiqueira
Entire Place • 3 bedrooms
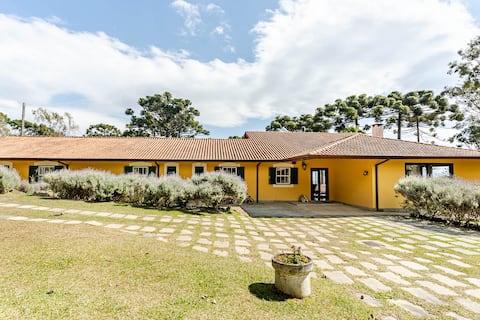
FARM - SINGLE-STORY HOUSE with 450 m² - SERVICES INCLUDED
Entire Place • 8 bedrooms

Pedacinho do Céu in Monte Verde
Entire Place • 4 bedrooms
Villa Losartino - Gonçalves, Minas Gerais
Entire Place • 2 bedrooms
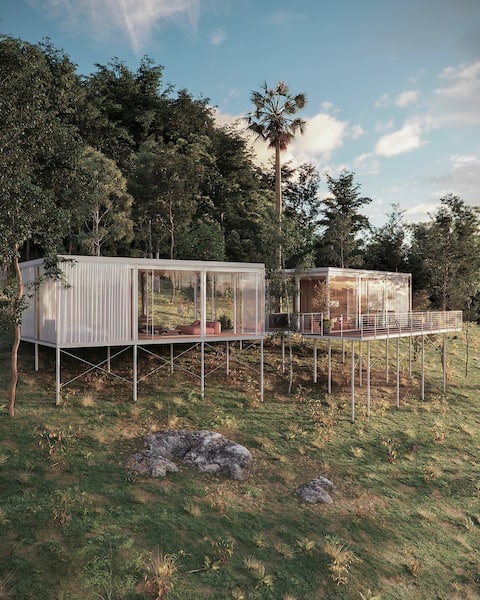
Casa Araucária
Entire Place • 3 bedrooms
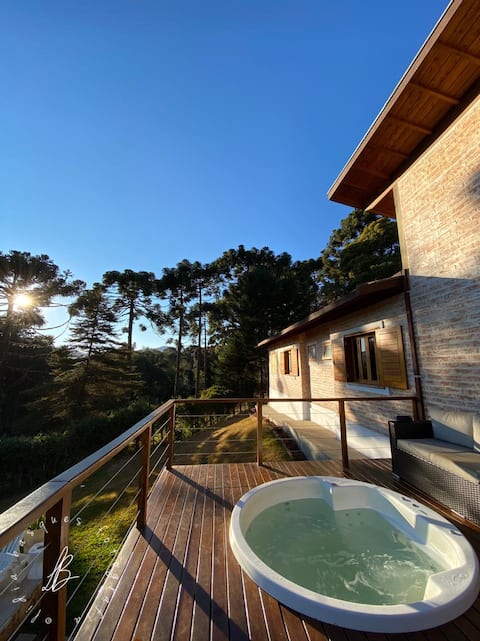
Villa Del Monte Premium Chalet
Entire Place • 3 bedrooms
Note: Performance varies based on location, size, amenities, seasonality, and management quality. Data reflects the past 12 months.
Top Performing Airbnb Hosts in Camanducaia (2026)
Learn from the best! This table showcases top-performing Airbnb hosts in Camanducaia based on the number of properties managed and estimated total revenue over the past year. Analyze their scale and performance metrics.
| Host Name | Properties | Grossing Revenue | Stay Reviews | Avg Rating |
|---|---|---|---|---|
| Takahiro Nagaoka | 6 | $146,810 | 80 | 5.00/5.0 |
| Andre Vitor De | 6 | $127,522 | 845 | 4.97/5.0 |
| Junior | 7 | $91,468 | 634 | 4.96/5.0 |
| Deborah | 3 | $81,388 | 359 | 5.00/5.0 |
| Edja & Tom | 5 | $79,869 | 292 | 5.00/5.0 |
| Rayana | 1 | $77,772 | 58 | 5.00/5.0 |
| Ralf E Carla | 4 | $77,693 | 488 | 4.99/5.0 |
| Daniel | 1 | $74,835 | 36 | 4.97/5.0 |
| Alex | 10 | $72,318 | 546 | 4.89/5.0 |
| Mariana | 1 | $71,636 | 66 | 4.98/5.0 |
Analyzing the strategies of top hosts, such as their property selection, pricing, and guest communication, can offer valuable lessons for optimizing your own Airbnb operations in Camanducaia.
Dive Deeper: Advanced Camanducaia STR Market Data (2026)
Ready to unlock more insights? AirROI provides access to advanced metrics and comprehensive Airbnb data for Camanducaia. Explore detailed analytics beyond this report to refine your investment strategy, optimize pricing, and maximize your vacation rental profits.
Explore Advanced MetricsCamanducaia Short-Term Rental Market Composition (2026): Property & Room Types
Room Type Distribution
Property Type Distribution
Market Composition Insights for Camanducaia
- The Camanducaia Airbnb market composition is heavily skewed towards Entire Home/Apt listings, which make up 78.2% of the 605 active rentals. This indicates strong guest preference for privacy and space.
- Looking at the property type distribution in Camanducaia, House properties are the most common (61.7%), reflecting the local real estate landscape.
- Houses represent a significant 61.7% portion, catering likely to families or larger groups.
- The presence of 15.4% Hotel/Boutique listings indicates integration with traditional hospitality.
- Smaller segments like others, unique stays (combined 5.3%) offer potential for unique stay experiences.
Camanducaia Airbnb Room Capacity Analysis (2026): Bedroom Distribution
Distribution of Listings by Number of Bedrooms
Room Capacity Insights for Camanducaia
- The dominant room capacity in Camanducaia is 1 bedroom listings, making up 39.3% of the market. This suggests a strong demand for properties suitable for couples or solo travelers.
- Together, 1 bedroom and 2 bedrooms properties represent 59.6% of the active Airbnb listings in Camanducaia, indicating a high concentration in these sizes.
- A significant 23.4% of listings offer 3+ bedrooms, catering to larger groups and families seeking more space in Camanducaia.
Camanducaia Vacation Rental Guest Capacity Trends (2026)
Distribution of Listings by Guest Capacity
Guest Capacity Insights for Camanducaia
- The most common guest capacity trend in Camanducaia vacation rentals is listings accommodating 2 guests (30.4%). This suggests the primary traveler segment is likely couples or solo travelers.
- Properties designed for 2 guests and 8+ guests dominate the Camanducaia STR market, accounting for 47.4% of listings.
- 28.9% of properties accommodate 6+ guests, serving the market segment for larger families or group travel in Camanducaia.
- On average, properties in Camanducaia are equipped to host 3.8 guests.
Camanducaia Airbnb Booking Patterns (2026): Available vs. Booked Days
Available Days Distribution
Booked Days Distribution
Booking Pattern Insights for Camanducaia
- The most common availability pattern in Camanducaia falls within the 271-366 days range, representing 65.6% of listings. This suggests many properties have significant open periods on their calendars.
- Approximately 91.7% of listings show high availability (181+ days open annually), indicating potential for increased bookings or specific owner usage patterns.
- For booked days, the 31-90 days range is most frequent in Camanducaia (40%), reflecting common guest stay durations or potential owner blocking patterns.
- A notable 9.2% of properties secure long booking periods (181+ days booked per year), highlighting successful long-term rental strategies or significant owner usage.
Camanducaia Airbnb Minimum Stay Requirements Analysis
Distribution of Listings by Minimum Night Requirement
1 Night
164 listings
27.1% of total
2 Nights
264 listings
43.6% of total
3 Nights
3 listings
0.5% of total
7-29 Nights
7 listings
1.2% of total
30+ Nights
167 listings
27.6% of total
Key Insights
- The most prevalent minimum stay requirement in Camanducaia is 2 Nights, adopted by 43.6% of listings. This highlights the market's preference for shorter, flexible bookings.
- A strong majority (70.7%) of the Camanducaia Airbnb data shows acceptance of very short stays (1-2 nights), indicating a dynamic, high-turnover market.
- A significant segment (27.6%) caters to monthly stays (30+ nights) in Camanducaia, pointing to opportunities in the extended-stay market.
Recommendations
- Align with the market by considering a 2 Nights minimum stay, as 43.6% of Camanducaia hosts use this setting.
- If feasible, allowing 1-night stays, especially midweek or during low season, could capture last-minute bookings, as only 27.1% currently do.
- Explore offering discounts for stays of 30+ nights to attract the 27.6% of the market seeking extended stays.
- Adjust minimum nights based on seasonality – potentially shorter during low season and longer during peak demand periods in Camanducaia.
Camanducaia Airbnb Cancellation Policy Trends Analysis (2026)
Super Strict 60 Days
1 listings
0.2% of total
Refundable
3 listings
0.5% of total
Non-refundable
5 listings
0.8% of total
Limited
11 listings
1.8% of total
Super Strict 30 Days
4 listings
0.7% of total
Flexible
150 listings
24.9% of total
Moderate
191 listings
31.7% of total
Firm
165 listings
27.4% of total
Strict
72 listings
12% of total
Cancellation Policy Insights for Camanducaia
- The prevailing Airbnb cancellation policy trend in Camanducaia is Moderate, used by 31.7% of listings.
- There's a relatively balanced mix between guest-friendly (56.6%) and stricter (39.4%) policies, offering choices for different guest needs.
Recommendations for Hosts
- Consider adopting a Moderate policy to align with the 31.7% market standard in Camanducaia.
- Using a Strict policy might deter some guests, as only 12% of listings use it. Evaluate if potential revenue protection outweighs possible lower booking rates.
- Regularly review your cancellation policy against competitors and market demand shifts in Camanducaia.
Camanducaia STR Booking Lead Time Analysis (2026)
Average Booking Lead Time by Month
Booking Lead Time Insights for Camanducaia
- The overall average booking lead time for vacation rentals in Camanducaia is 29 days.
- Guests book furthest in advance for stays during December (average 48 days), likely coinciding with peak travel demand or local events.
- The shortest booking windows occur for stays in March (average 19 days), indicating more last-minute travel plans during this time.
- Seasonally, Winter (31 days avg.) sees the longest lead times, while Spring (24 days avg.) has the shortest, reflecting typical travel planning cycles.
Recommendations for Hosts
- Use the overall average lead time (29 days) as a baseline for your pricing and availability strategy in Camanducaia.
- For December stays, consider implementing length-of-stay discounts or slightly higher rates for bookings made less than 48 days out to capitalize on advance planning.
- Target marketing efforts for the Winter season well in advance (at least 31 days) to capture early planners.
- Monitor your own booking lead times against these Camanducaia averages to identify opportunities for dynamic pricing adjustments.
Popular & Essential Airbnb Amenities in Camanducaia (2026)
Amenity Prevalence
Amenity Insights for Camanducaia
- Essential amenities in Camanducaia that guests expect include: Wifi. Lacking these (this) could significantly impact bookings.
- Popular amenities like TV, Free parking on premises, Indoor fireplace are common but not universal. Offering these can provide a competitive edge.
Recommendations for Hosts
- Ensure your listing includes all essential amenities for Camanducaia: Wifi.
- Prioritize adding missing essentials: Wifi.
- Consider adding popular differentiators like TV or Free parking on premises to increase appeal.
- Highlight unique or less common amenities you offer (e.g., hot tub, dedicated workspace, EV charger) in your listing description and photos.
- Regularly check competitor amenities in Camanducaia to stay competitive.
Camanducaia Airbnb Guest Demographics & Profile Analysis (2026)
Guest Profile Summary for Camanducaia
- The typical guest profile for Airbnb in Camanducaia consists of primarily domestic travelers (98%), often arriving from nearby São Paulo, typically belonging to the Post-2000s (Gen Z/Alpha) group (50%), primarily speaking Portuguese or English.
- Domestic travelers account for 98.1% of guests.
- Key international markets include Brazil (98.1%) and United States (1%).
- Top languages spoken are Portuguese (50.3%) followed by English (30.1%).
- A significant demographic segment is the Post-2000s (Gen Z/Alpha) group, representing 50% of guests.
Recommendations for Hosts
- Target domestic marketing efforts towards travelers from São Paulo and Campinas.
- Tailor amenities and listing descriptions to appeal to the dominant Post-2000s (Gen Z/Alpha) demographic (e.g., highlight fast WiFi, smart home features, local guides).
- Highlight unique local experiences or amenities relevant to the primary guest profile.
- Consider seasonal promotions aligned with peak travel times for key origin markets.
Nearby Short-Term Rental Market Comparison
How does the Camanducaia Airbnb market stack up against its neighbors? Compare key performance metrics like average monthly revenue, ADR, and occupancy rates in surrounding areas to understand the broader regional STR landscape.
| Market | Active Properties | Monthly Revenue | Daily Rate | Avg. Occupancy |
|---|---|---|---|---|
| Riviera de São Lourenço | 10 | $2,868 | $213.78 | 46% |
| Tuiuti | 18 | $1,686 | $156.45 | 30% |
| Itupeva | 136 | $1,561 | $225.82 | 28% |
| Morungaba | 31 | $1,435 | $263.39 | 27% |
| Campo Limpo Paulista | 49 | $1,428 | $181.02 | 30% |
| Valinhos | 61 | $1,370 | $176.28 | 33% |
| Itatiba | 171 | $1,331 | $177.58 | 29% |
| Vargem | 48 | $1,319 | $190.42 | 28% |
| Elias Fausto | 13 | $1,296 | $143.78 | 30% |
| Porto Feliz | 69 | $1,279 | $260.86 | 27% |