Baependi Airbnb Market Analysis 2026: Short Term Rental Data & Vacation Rental Statistics in Minas Gerais, Brazil
Is Airbnb profitable in Baependi in 2026? Explore comprehensive Airbnb analytics for Baependi, Minas Gerais, Brazil to uncover income potential. This 2026 STR market report for Baependi, based on AirROI data from February 2025 to January 2026, reveals key trends in the niche market of 27 active listings.
Whether you're considering an Airbnb investment in Baependi, optimizing your existing vacation rental, or exploring rental arbitrage opportunities, understanding the Baependi Airbnb data is crucial. Leveraging the low regulation environment is key to maximizing your short term rental income potential. Let's dive into the specifics.
Key Baependi Airbnb Performance Metrics Overview
Monthly Airbnb Revenue Variations & Income Potential in Baependi (2026)
Understanding the monthly revenue variations for Airbnb listings in Baependi is key to maximizing your short term rental income potential. Seasonality significantly impacts earnings. Our analysis, based on data from the past 12 months, shows that the peak revenue month for STRs in Baependi is typically May, while February often presents the lowest earnings, highlighting opportunities for strategic pricing adjustments during shoulder and low seasons. Explore the typical Airbnb income in Baependi across different performance tiers:
- Best-in-class properties (Top 10%) achieve $1,580+ monthly, often utilizing dynamic pricing and superior guest experiences.
- Strong performing properties (Top 25%) earn $799 or more, indicating effective management and desirable locations/amenities.
- Typical properties (Median) generate around $315 per month, representing the average market performance.
- Entry-level properties (Bottom 25%) see earnings around $117, often with potential for optimization.
Average Monthly Airbnb Earnings Trend in Baependi
Baependi Airbnb Occupancy Rate Trends (2026)
Maximize your bookings by understanding the Baependi STR occupancy trends. Seasonal demand shifts significantly influence how often properties are booked. Typically, Septembersees the highest demand (peak season occupancy), while February experiences the lowest (low season). Effective strategies, like adjusting minimum stays or offering promotions, can boost occupancy during slower periods. Here's how different property tiers perform in Baependi:
- Best-in-class properties (Top 10%) achieve 54%+ occupancy, indicating high desirability and potentially optimized availability.
- Strong performing properties (Top 25%) maintain 31% or higher occupancy, suggesting good market fit and guest satisfaction.
- Typical properties (Median) have an occupancy rate around 18%.
- Entry-level properties (Bottom 25%) average 10% occupancy, potentially facing higher vacancy.
Average Monthly Occupancy Rate Trend in Baependi
Average Daily Rate (ADR) Airbnb Trends in Baependi (2026)
Effective short term rental pricing strategy in Baependi involves understanding monthly ADR fluctuations. The Average Daily Rate (ADR) for Airbnb in Baependi typically peaks in December and dips lowest during February. Leveraging Airbnb dynamic pricing tools or strategies based on this seasonality can significantly boost revenue. Here's a look at the typical nightly rates achieved:
- Best-in-class properties (Top 10%) command rates of $133+ per night, often due to premium features or locations.
- Strong performing properties (Top 25%) achieve nightly rates of $89 or more.
- Typical properties (Median) charge around $47 per night.
- Entry-level properties (Bottom 25%) earn around $34 per night.
Average Daily Rate (ADR) Trend by Month in Baependi
Get Live Baependi Market Intelligence 👇

Explore Real-time Analytics
Airbnb Seasonality Analysis & Trends in Baependi (2026)
Peak Season (May, September, December)
- Revenue averages $846 per month
- Occupancy rates average 28.1%
- Daily rates average $68
Shoulder Season
- Revenue averages $624 per month
- Occupancy maintains around 23.7%
- Daily rates hold near $64
Low Season (January, February, August)
- Revenue drops to average $492 per month
- Occupancy decreases to average 20.3%
- Daily rates adjust to average $64
Seasonality Insights for Baependi
- The Airbnb seasonality in Baependi shows highly seasonal trends requiring careful strategy. While the sections above show seasonal averages, it's also insightful to look at the extremes:
- During the high season, the absolute peak month showcases Baependi's highest earning potential, with monthly revenues capable of climbing to $919, occupancy reaching a high of 31.5%, and ADRs peaking at $72.
- Conversely, the slowest single month of the year, typically falling within the low season, marks the market's lowest point. In this month, revenue might dip to $407, occupancy could drop to 18.8%, and ADRs may adjust down to $58.
- Understanding both the seasonal averages and these monthly peaks and troughs in revenue, occupancy, and ADR is crucial for maximizing your Airbnb profit potential in Baependi.
Seasonal Strategies for Maximizing Profit
- Peak Season: Maximize revenue through premium pricing and potentially longer minimum stays. Ensure high availability.
- Low Season: Offer competitive pricing, special promotions (e.g., extended stay discounts), and flexible cancellation policies. Target off-season travelers like remote workers or budget-conscious guests.
- Shoulder Seasons: Implement dynamic pricing that balances peak and low rates. Target weekend travelers or specific events. Offer slightly more flexible terms than peak season.
- Regularly analyze your own performance against these Baependi seasonality benchmarks and adjust your pricing and availability strategy accordingly.
Best Areas for Airbnb Investment in Baependi (2026)
Exploring the top neighborhoods for short-term rentals in Baependi? This section highlights key areas, outlining why they are attractive for hosts and guests, along with notable local attractions. Consider these locations based on your target guest profile and investment strategy.
| Neighborhood / Area | Why Host Here? (Target Guests & Appeal) | Key Attractions & Landmarks |
|---|---|---|
| Centro | The heart of Baependi, with easy access to local shops, restaurants, and cultural sites. Visitors can experience the local lifestyle and community. | Igreja Matriz de Baependi, Casa da Cultura, Museu do Vinho, Praça Comendador José Gomes, Caminho do Rosário |
| Parque do Rio Baependi | A tranquil area with beautiful natural scenery, perfect for families and nature lovers. The park offers recreational activities and a peaceful retreat. | Parque Natural Municipal, Trilhas para caminhadas, Área para piqueniques, Rio Baependi, Pontos de observação |
| Serra da Mantiqueira | Famous for its stunning mountain views and natural beauty. Attracts tourists looking for adventure, hiking, and eco-tourism near Baependi. | Cachoeira do Moinho, Mirante do Lobo, Trilhas da Serra, Caminhada pelas montanhas, Pontos de observação de aves |
| Bairro das Flores | A charming neighborhood known for its gardens and quiet atmosphere. Ideal for visitors seeking a retreat in nature. | Caminhos floridos, Praças tranquilas, Cafés e pequenos restaurantes, Atividades de arte locais |
| Cascata do Rio Baependi | Known for its beautiful waterfall, this area is a favorite among adventurers and those seeking natural beauty. | Cascata do Rio Baependi, Trilhas de acesso, Áreas para banho, Piqueniques ao ar livre |
| Rua do Comércio | A vibrant street filled with local businesses, shops, and eateries. Perfect for visitors wanting to experience local commerce and cuisine. | Lojas de artesanato, Cafés locais, Restaurantes típicos, Mercado municipal |
| Local de Festas e Eventos | This area hosts various cultural and community events throughout the year, attracting visitors looking for entertainment and local culture. | Festas juninas, Feiras de artesanato, Eventos musicais, Comidas típicas |
| Caminho do Rosário | A scenic route that offers beautiful views and connections to local attractions. Popular with hikers and those exploring the region’s history. | História local, Trilhas históricas, Mirantes naturais, Cultural heritage sites |
Understanding Airbnb License Requirements & STR Laws in Baependi (2026)
While Baependi, Minas Gerais, Brazil currently shows low STR regulations, specific Airbnb license requirements might still exist or change. Always verify the latest short term rental regulations and Airbnb license requirements directly with local government authorities for Baependi to ensure full compliance before hosting.
(Source: AirROI data, 2026, finding no licensed listings among those analyzed)
Top Performing Airbnb Properties in Baependi (2026)
Benchmark your potential! Explore examples of top-performing Airbnb properties in Baependibased on Trailing Twelve Month (TTM) revenue. Analyze their characteristics, revenue, occupancy rate, and ADR to understand what drives success in this market.

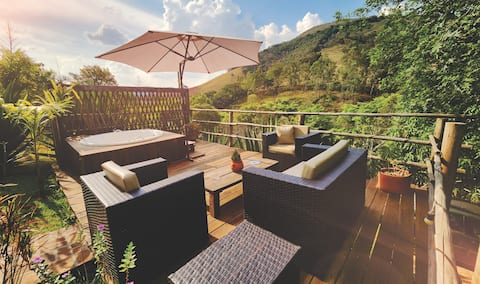
Exclusive Cabin with Spa and View for Waterfalls
Entire Place • 1 bedroom

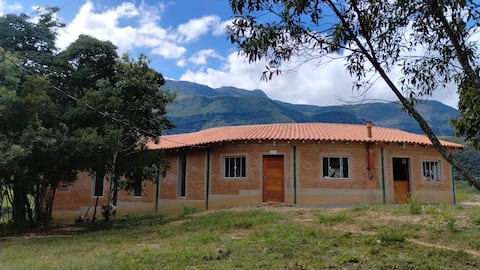
Farm with gourmet area, playroom and fishing.
Entire Place • 5 bedrooms
High-end bungalow among the Gamarra waterfalls
Entire Place • 1 bedroom
Gamarra Space: Casa Curva
Entire Place • 3 bedrooms
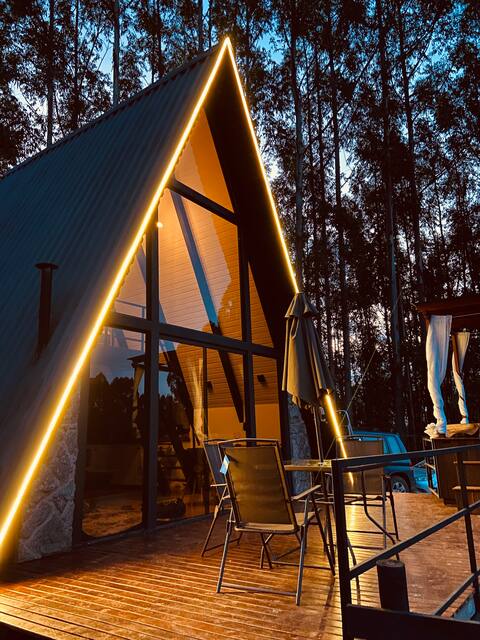
Raízes Cabin: A-Frame with a view of the mountains
Entire Place • 1 bedroom
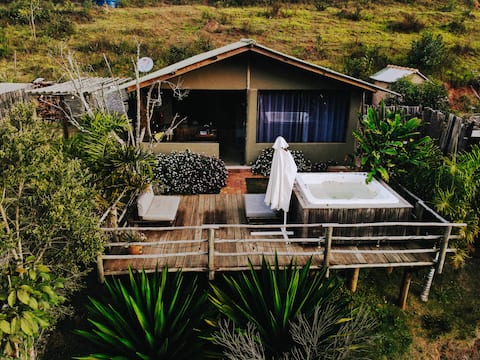
Gamarra Mountains Retreat, among waterfalls
Entire Place • 1 bedroom
Note: Performance varies based on location, size, amenities, seasonality, and management quality. Data reflects the past 12 months.
Top Performing Airbnb Hosts in Baependi (2026)
Learn from the best! This table showcases top-performing Airbnb hosts in Baependi based on the number of properties managed and estimated total revenue over the past year. Analyze their scale and performance metrics.
| Host Name | Properties | Grossing Revenue | Stay Reviews | Avg Rating |
|---|---|---|---|---|
| Amanda | 1 | $32,994 | 72 | 4.88/5.0 |
| Entremontes Gamarra | 2 | $22,900 | 114 | 4.99/5.0 |
| Varese | 2 | $17,383 | 2 | Not Rated |
| Mirian | 1 | $15,171 | 10 | 5.00/5.0 |
| Lucas | 1 | $10,383 | 55 | 4.89/5.0 |
| Gabriel | 1 | $7,371 | 6 | 5.00/5.0 |
| Talita | 1 | $6,649 | 62 | 4.98/5.0 |
| Marilze Dedé | 3 | $3,071 | 18 | 4.96/5.0 |
| Nelma Lucia | 1 | $2,870 | 184 | 4.98/5.0 |
| Mayron | 1 | $2,776 | 10 | 4.80/5.0 |
Analyzing the strategies of top hosts, such as their property selection, pricing, and guest communication, can offer valuable lessons for optimizing your own Airbnb operations in Baependi.
Dive Deeper: Advanced Baependi STR Market Data (2026)
Ready to unlock more insights? AirROI provides access to advanced metrics and comprehensive Airbnb data for Baependi. Explore detailed analytics beyond this report to refine your investment strategy, optimize pricing, and maximize your vacation rental profits.
Explore Advanced MetricsBaependi Short-Term Rental Market Composition (2026): Property & Room Types
Room Type Distribution
Property Type Distribution
Market Composition Insights for Baependi
- The Baependi Airbnb market composition is heavily skewed towards Entire Home/Apt listings, which make up 96.3% of the 27 active rentals. This indicates strong guest preference for privacy and space.
- Looking at the property type distribution in Baependi, House properties are the most common (81.5%), reflecting the local real estate landscape.
- Houses represent a significant 81.5% portion, catering likely to families or larger groups.
- The presence of 11.1% Hotel/Boutique listings indicates integration with traditional hospitality.
Baependi Airbnb Room Capacity Analysis (2026): Bedroom Distribution
Distribution of Listings by Number of Bedrooms
Room Capacity Insights for Baependi
- The dominant room capacity in Baependi is 1 bedroom listings, making up 44.4% of the market. This suggests a strong demand for properties suitable for couples or solo travelers.
- Together, 1 bedroom and 2 bedrooms properties represent 77.7% of the active Airbnb listings in Baependi, indicating a high concentration in these sizes.
Baependi Vacation Rental Guest Capacity Trends (2026)
Distribution of Listings by Guest Capacity
Guest Capacity Insights for Baependi
- The most common guest capacity trend in Baependi vacation rentals is listings accommodating 8+ guests (22.2%). This suggests the primary traveler segment is likely larger groups.
- Properties designed for 8+ guests and 4 guests dominate the Baependi STR market, accounting for 44.4% of listings.
- 40.7% of properties accommodate 6+ guests, serving the market segment for larger families or group travel in Baependi.
- On average, properties in Baependi are equipped to host 4.9 guests.
Baependi Airbnb Booking Patterns (2026): Available vs. Booked Days
Available Days Distribution
Booked Days Distribution
Booking Pattern Insights for Baependi
- The most common availability pattern in Baependi falls within the 271-366 days range, representing 85.2% of listings. This suggests many properties have significant open periods on their calendars.
- Approximately 96.3% of listings show high availability (181+ days open annually), indicating potential for increased bookings or specific owner usage patterns.
- For booked days, the 1-30 days range is most frequent in Baependi (55.6%), reflecting common guest stay durations or potential owner blocking patterns.
- A notable 3.7% of properties secure long booking periods (181+ days booked per year), highlighting successful long-term rental strategies or significant owner usage.
Baependi Airbnb Minimum Stay Requirements Analysis
Distribution of Listings by Minimum Night Requirement
1 Night
10 listings
37% of total
2 Nights
9 listings
33.3% of total
3 Nights
2 listings
7.4% of total
30+ Nights
6 listings
22.2% of total
Key Insights
- The most prevalent minimum stay requirement in Baependi is 1 Night, adopted by 37% of listings. This highlights the market's preference for shorter, flexible bookings.
- A strong majority (70.3%) of the Baependi Airbnb data shows acceptance of very short stays (1-2 nights), indicating a dynamic, high-turnover market.
- A significant segment (22.2%) caters to monthly stays (30+ nights) in Baependi, pointing to opportunities in the extended-stay market.
Recommendations
- Align with the market by considering a 1 Night minimum stay, as 37% of Baependi hosts use this setting.
- Explore offering discounts for stays of 30+ nights to attract the 22.2% of the market seeking extended stays.
- Adjust minimum nights based on seasonality – potentially shorter during low season and longer during peak demand periods in Baependi.
Baependi Airbnb Cancellation Policy Trends Analysis (2026)
Limited
4 listings
14.8% of total
Flexible
12 listings
44.4% of total
Moderate
3 listings
11.1% of total
Firm
7 listings
25.9% of total
Strict
1 listings
3.7% of total
Cancellation Policy Insights for Baependi
- The prevailing Airbnb cancellation policy trend in Baependi is Flexible, used by 44.4% of listings.
- There's a relatively balanced mix between guest-friendly (55.5%) and stricter (29.6%) policies, offering choices for different guest needs.
- Strict cancellation policies are quite rare (3.7%), potentially making listings with this policy less competitive unless justified by high demand or property type.
Recommendations for Hosts
- Consider adopting a Flexible policy to align with the 44.4% market standard in Baependi.
- Using a Strict policy might deter some guests, as only 3.7% of listings use it. Evaluate if potential revenue protection outweighs possible lower booking rates.
- Regularly review your cancellation policy against competitors and market demand shifts in Baependi.
Baependi STR Booking Lead Time Analysis (2026)
Average Booking Lead Time by Month
Booking Lead Time Insights for Baependi
- The overall average booking lead time for vacation rentals in Baependi is 30 days.
- Guests book furthest in advance for stays during December (average 53 days), likely coinciding with peak travel demand or local events.
- The shortest booking windows occur for stays in August (average 15 days), indicating more last-minute travel plans during this time.
- Seasonally, Winter (30 days avg.) sees the longest lead times, while Fall (23 days avg.) has the shortest, reflecting typical travel planning cycles.
Recommendations for Hosts
- Use the overall average lead time (30 days) as a baseline for your pricing and availability strategy in Baependi.
- For December stays, consider implementing length-of-stay discounts or slightly higher rates for bookings made less than 53 days out to capitalize on advance planning.
- Target marketing efforts for the Winter season well in advance (at least 30 days) to capture early planners.
- Monitor your own booking lead times against these Baependi averages to identify opportunities for dynamic pricing adjustments.
Popular & Essential Airbnb Amenities in Baependi (2026)
Amenity Prevalence
Amenity Insights for Baependi
- Essential amenities in Baependi that guests expect include: Free parking on premises, Kitchen. Lacking these (any) could significantly impact bookings.
- Popular amenities like Dishes and silverware, Wifi, Cooking basics are common but not universal. Offering these can provide a competitive edge.
- Warning: Wifi is not universally provided but is considered essential globally. Ensure reliable Wifi is offered.
Recommendations for Hosts
- Ensure your listing includes all essential amenities for Baependi: Free parking on premises, Kitchen.
- Prioritize adding missing essentials: Free parking on premises, Kitchen.
- Consider adding popular differentiators like Dishes and silverware or Wifi to increase appeal.
- Highlight unique or less common amenities you offer (e.g., hot tub, dedicated workspace, EV charger) in your listing description and photos.
- Regularly check competitor amenities in Baependi to stay competitive.
Baependi Airbnb Guest Demographics & Profile Analysis (2026)
Guest Profile Summary for Baependi
- The typical guest profile for Airbnb in Baependi consists of primarily domestic travelers (97%), often arriving from nearby São Paulo, typically belonging to the Post-2000s (Gen Z/Alpha) group (50%), primarily speaking Portuguese or English.
- Domestic travelers account for 96.8% of guests.
- Key international markets include Brazil (96.8%) and United States (3.2%).
- Top languages spoken are Portuguese (47.5%) followed by English (28.8%).
- A significant demographic segment is the Post-2000s (Gen Z/Alpha) group, representing 50% of guests.
Recommendations for Hosts
- Target domestic marketing efforts towards travelers from São Paulo and Rio de Janeiro.
- Tailor amenities and listing descriptions to appeal to the dominant Post-2000s (Gen Z/Alpha) demographic (e.g., highlight fast WiFi, smart home features, local guides).
- Highlight unique local experiences or amenities relevant to the primary guest profile.
- Consider seasonal promotions aligned with peak travel times for key origin markets.
Nearby Short-Term Rental Market Comparison
How does the Baependi Airbnb market stack up against its neighbors? Compare key performance metrics like average monthly revenue, ADR, and occupancy rates in surrounding areas to understand the broader regional STR landscape.
| Market | Active Properties | Monthly Revenue | Daily Rate | Avg. Occupancy |
|---|---|---|---|---|
| Ilha Grande | 11 | $1,783 | $166.42 | 38% |
| Areal | 82 | $1,532 | $198.25 | 30% |
| Queluz | 17 | $1,291 | $152.05 | 30% |
| Brazópolis | 21 | $1,209 | $152.11 | 29% |
| Santa Branca | 53 | $1,138 | $195.49 | 25% |
| Jambeiro | 22 | $1,135 | $185.50 | 24% |
| São Sebastião | 6,175 | $1,114 | $188.11 | 28% |
| Rio de Janeiro | 27,660 | $1,085 | $106.45 | 43% |
| Angra dos Reis | 2,446 | $1,017 | $158.25 | 33% |
| Paraisópolis | 104 | $1,004 | $108.16 | 32% |