Rondonópolis Airbnb Market Analysis 2026: Short Term Rental Data & Vacation Rental Statistics in Mato Grosso, Brazil
Is Airbnb profitable in Rondonópolis in 2026? Explore comprehensive Airbnb analytics for Rondonópolis, Mato Grosso, Brazil to uncover income potential. This 2026 STR market report for Rondonópolis, based on AirROI data from February 2025 to January 2026, reveals key trends in the niche market of 98 active listings.
Whether you're considering an Airbnb investment in Rondonópolis, optimizing your existing vacation rental, or exploring rental arbitrage opportunities, understanding the Rondonópolis Airbnb data is crucial. Leveraging the low regulation environment is key to maximizing your short term rental income potential. Let's dive into the specifics.
Key Rondonópolis Airbnb Performance Metrics Overview
Monthly Airbnb Revenue Variations & Income Potential in Rondonópolis (2026)
Understanding the monthly revenue variations for Airbnb listings in Rondonópolis is key to maximizing your short term rental income potential. Seasonality significantly impacts earnings. Our analysis, based on data from the past 12 months, shows that the peak revenue month for STRs in Rondonópolis is typically December, while January often presents the lowest earnings, highlighting opportunities for strategic pricing adjustments during shoulder and low seasons. Explore the typical Airbnb income in Rondonópolis across different performance tiers:
- Best-in-class properties (Top 10%) achieve $1,003+ monthly, often utilizing dynamic pricing and superior guest experiences.
- Strong performing properties (Top 25%) earn $613 or more, indicating effective management and desirable locations/amenities.
- Typical properties (Median) generate around $327 per month, representing the average market performance.
- Entry-level properties (Bottom 25%) see earnings around $154, often with potential for optimization.
Average Monthly Airbnb Earnings Trend in Rondonópolis
Rondonópolis Airbnb Occupancy Rate Trends (2026)
Maximize your bookings by understanding the Rondonópolis STR occupancy trends. Seasonal demand shifts significantly influence how often properties are booked. Typically, Februarysees the highest demand (peak season occupancy), while January experiences the lowest (low season). Effective strategies, like adjusting minimum stays or offering promotions, can boost occupancy during slower periods. Here's how different property tiers perform in Rondonópolis:
- Best-in-class properties (Top 10%) achieve 69%+ occupancy, indicating high desirability and potentially optimized availability.
- Strong performing properties (Top 25%) maintain 48% or higher occupancy, suggesting good market fit and guest satisfaction.
- Typical properties (Median) have an occupancy rate around 29%.
- Entry-level properties (Bottom 25%) average 15% occupancy, potentially facing higher vacancy.
Average Monthly Occupancy Rate Trend in Rondonópolis
Average Daily Rate (ADR) Airbnb Trends in Rondonópolis (2026)
Effective short term rental pricing strategy in Rondonópolis involves understanding monthly ADR fluctuations. The Average Daily Rate (ADR) for Airbnb in Rondonópolis typically peaks in October and dips lowest during February. Leveraging Airbnb dynamic pricing tools or strategies based on this seasonality can significantly boost revenue. Here's a look at the typical nightly rates achieved:
- Best-in-class properties (Top 10%) command rates of $75+ per night, often due to premium features or locations.
- Strong performing properties (Top 25%) achieve nightly rates of $53 or more.
- Typical properties (Median) charge around $34 per night.
- Entry-level properties (Bottom 25%) earn around $24 per night.
Average Daily Rate (ADR) Trend by Month in Rondonópolis
Get Live Rondonópolis Market Intelligence 👇

Explore Real-time Analytics
Airbnb Seasonality Analysis & Trends in Rondonópolis (2026)
Peak Season (December, September, February)
- Revenue averages $558 per month
- Occupancy rates average 39.1%
- Daily rates average $46
Shoulder Season
- Revenue averages $483 per month
- Occupancy maintains around 33.6%
- Daily rates hold near $45
Low Season (January, May, June)
- Revenue drops to average $389 per month
- Occupancy decreases to average 29.0%
- Daily rates adjust to average $45
Seasonality Insights for Rondonópolis
- The Airbnb seasonality in Rondonópolis shows highly seasonal trends requiring careful strategy. While the sections above show seasonal averages, it's also insightful to look at the extremes:
- During the high season, the absolute peak month showcases Rondonópolis's highest earning potential, with monthly revenues capable of climbing to $623, occupancy reaching a high of 43.6%, and ADRs peaking at $50.
- Conversely, the slowest single month of the year, typically falling within the low season, marks the market's lowest point. In this month, revenue might dip to $277, occupancy could drop to 20.0%, and ADRs may adjust down to $41.
- Understanding both the seasonal averages and these monthly peaks and troughs in revenue, occupancy, and ADR is crucial for maximizing your Airbnb profit potential in Rondonópolis.
Seasonal Strategies for Maximizing Profit
- Peak Season: Maximize revenue through premium pricing and potentially longer minimum stays. Ensure high availability.
- Low Season: Offer competitive pricing, special promotions (e.g., extended stay discounts), and flexible cancellation policies. Target off-season travelers like remote workers or budget-conscious guests.
- Shoulder Seasons: Implement dynamic pricing that balances peak and low rates. Target weekend travelers or specific events. Offer slightly more flexible terms than peak season.
- Regularly analyze your own performance against these Rondonópolis seasonality benchmarks and adjust your pricing and availability strategy accordingly.
Best Areas for Airbnb Investment in Rondonópolis (2026)
Exploring the top neighborhoods for short-term rentals in Rondonópolis? This section highlights key areas, outlining why they are attractive for hosts and guests, along with notable local attractions. Consider these locations based on your target guest profile and investment strategy.
| Neighborhood / Area | Why Host Here? (Target Guests & Appeal) | Key Attractions & Landmarks |
|---|---|---|
| Centro | The heart of Rondonópolis with a vibrant local culture, shopping areas, and restaurants. It's ideal for travelers who want to explore the city's main attractions and amenities. | Parque das Águas, Museu de História Natural, Feira da Lua, Shopping Rondon Plaza, Teatro Rondonópolis |
| Jardim Ipanema | A family-friendly neighborhood with parks and schools, making it attractive for families visiting Rondonópolis. It's a quiet area with local amenities. | Parque Ipanema, Praça Rondon, Supermercados, Restaurantes locais |
| Jardim Universitário | Close to the university and educational institutions in Rondonópolis, attracting students and academic visitors. Good for budget-conscious travelers. | Universidade Federal de Mato Grosso, Cafés e lanchonetes, Centro Cultural |
| Nova Rondonópolis | A rapidly growing area with new developments and modern amenities. It has a mix of residential and commercial spaces, appealing to young professionals. | Shoppings locais, Mercados e feiras, Eventos comunitários |
| Rondonópolis Parque | A neighborhood with outdoor spaces and parks, perfect for nature lovers. It provides a relaxing atmosphere for visitors. | Parque das Aves, Área Verde, Atividades ao ar livre |
| Vila Aurora | Known for its local cuisine and cultural experiences, it's a great place for visitors who want an authentic taste of Rondonópolis. | Restaurantes esquecidos, Cultura local, Pontos turísticos históricos |
| São José | A residential area with access to local shops and community activities. Good for longer stays and tranquility. | Mercados locais, Praças, Eventos comunitários |
| Parque das Nações | A modern neighborhood with various amenities and access to parks, ideal for families and tourists looking for a comfortable stay. | Parque Municipal, Centros comerciais, Espaços recreativos |
Understanding Airbnb License Requirements & STR Laws in Rondonópolis (2026)
While Rondonópolis, Mato Grosso, Brazil currently shows low STR regulations, specific Airbnb license requirements might still exist or change. Always verify the latest short term rental regulations and Airbnb license requirements directly with local government authorities for Rondonópolis to ensure full compliance before hosting.
(Source: AirROI data, 2026, based on 1% licensed listings)
Top Performing Airbnb Properties in Rondonópolis (2026)
Benchmark your potential! Explore examples of top-performing Airbnb properties in Rondonópolisbased on Trailing Twelve Month (TTM) revenue. Analyze their characteristics, revenue, occupancy rate, and ADR to understand what drives success in this market.

Inn near Shopping
Entire Place • 5 bedrooms
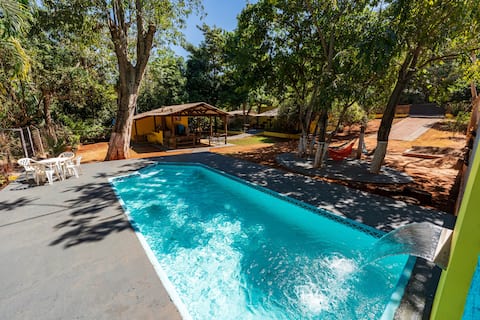
House with pool, wood stove and river in the background
Entire Place • 3 bedrooms
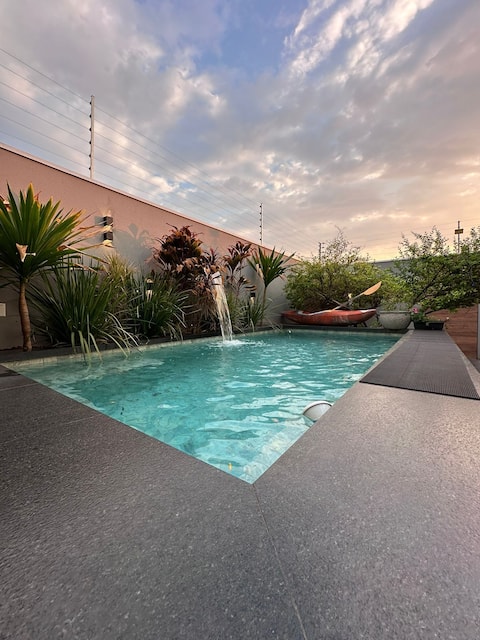
Dcasa
Entire Place • 3 bedrooms
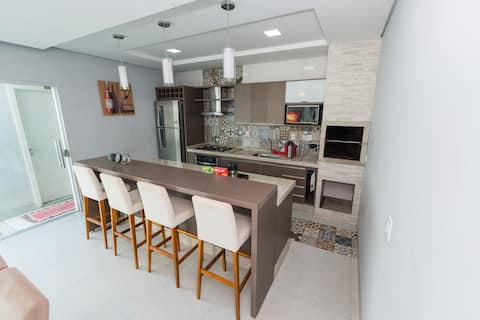
Modern house in a gated community, great location
Entire Place • 4 bedrooms
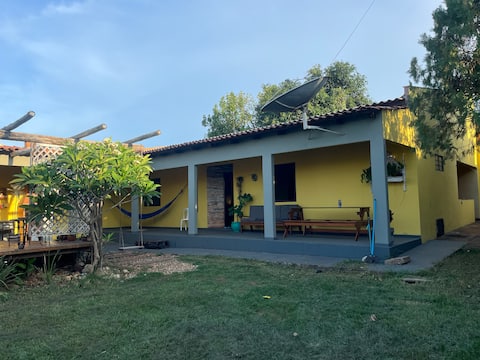
House with a complete and private leisure area.
Entire Place • 4 bedrooms

Cozy Gran Ville House
Entire Place • 2 bedrooms
Note: Performance varies based on location, size, amenities, seasonality, and management quality. Data reflects the past 12 months.
Top Performing Airbnb Hosts in Rondonópolis (2026)
Learn from the best! This table showcases top-performing Airbnb hosts in Rondonópolis based on the number of properties managed and estimated total revenue over the past year. Analyze their scale and performance metrics.
| Host Name | Properties | Grossing Revenue | Stay Reviews | Avg Rating |
|---|---|---|---|---|
| Rivian Dias | 12 | $59,839 | 183 | 4.83/5.0 |
| Arlete | 23 | $48,084 | 152 | 4.91/5.0 |
| Quick Home | 6 | $42,307 | 123 | 4.95/5.0 |
| Juliana Campos | 3 | $28,573 | 165 | 4.80/5.0 |
| Aidi | 2 | $13,449 | 86 | 4.86/5.0 |
| Adriana | 1 | $11,251 | 5 | 5.00/5.0 |
| Zenilde | 8 | $11,041 | 201 | 4.41/5.0 |
| Henrique Santos | 1 | $10,033 | 24 | 4.92/5.0 |
| Ailda | 1 | $9,828 | 35 | 4.91/5.0 |
| Juliana | 2 | $9,307 | 103 | 4.57/5.0 |
Analyzing the strategies of top hosts, such as their property selection, pricing, and guest communication, can offer valuable lessons for optimizing your own Airbnb operations in Rondonópolis.
Dive Deeper: Advanced Rondonópolis STR Market Data (2026)
Ready to unlock more insights? AirROI provides access to advanced metrics and comprehensive Airbnb data for Rondonópolis. Explore detailed analytics beyond this report to refine your investment strategy, optimize pricing, and maximize your vacation rental profits.
Explore Advanced MetricsRondonópolis Short-Term Rental Market Composition (2026): Property & Room Types
Room Type Distribution
Property Type Distribution
Market Composition Insights for Rondonópolis
- The Rondonópolis Airbnb market composition is heavily skewed towards Entire Home/Apt listings, which make up 88.8% of the 98 active rentals. This indicates strong guest preference for privacy and space.
- Looking at the property type distribution in Rondonópolis, House properties are the most common (66.3%), reflecting the local real estate landscape.
- Houses represent a significant 66.3% portion, catering likely to families or larger groups.
- Smaller segments like hotel/boutique (combined 4.1%) offer potential for unique stay experiences.
Rondonópolis Airbnb Room Capacity Analysis (2026): Bedroom Distribution
Distribution of Listings by Number of Bedrooms
Room Capacity Insights for Rondonópolis
- The dominant room capacity in Rondonópolis is 1 bedroom listings, making up 39.8% of the market. This suggests a strong demand for properties suitable for couples or solo travelers.
- Together, 1 bedroom and 2 bedrooms properties represent 70.4% of the active Airbnb listings in Rondonópolis, indicating a high concentration in these sizes.
Rondonópolis Vacation Rental Guest Capacity Trends (2026)
Distribution of Listings by Guest Capacity
Guest Capacity Insights for Rondonópolis
- The most common guest capacity trend in Rondonópolis vacation rentals is listings accommodating 4 guests (24.5%). This suggests the primary traveler segment is likely small families or groups.
- Properties designed for 4 guests and 2 guests dominate the Rondonópolis STR market, accounting for 41.8% of listings.
- 28.5% of properties accommodate 6+ guests, serving the market segment for larger families or group travel in Rondonópolis.
- On average, properties in Rondonópolis are equipped to host 4.1 guests.
Rondonópolis Airbnb Booking Patterns (2026): Available vs. Booked Days
Available Days Distribution
Booked Days Distribution
Booking Pattern Insights for Rondonópolis
- The most common availability pattern in Rondonópolis falls within the 271-366 days range, representing 64.3% of listings. This suggests many properties have significant open periods on their calendars.
- Approximately 91.9% of listings show high availability (181+ days open annually), indicating potential for increased bookings or specific owner usage patterns.
- For booked days, the 31-90 days range is most frequent in Rondonópolis (36.7%), reflecting common guest stay durations or potential owner blocking patterns.
- A notable 9.2% of properties secure long booking periods (181+ days booked per year), highlighting successful long-term rental strategies or significant owner usage.
Rondonópolis Airbnb Minimum Stay Requirements Analysis
Distribution of Listings by Minimum Night Requirement
1 Night
44 listings
44.9% of total
2 Nights
26 listings
26.5% of total
3 Nights
4 listings
4.1% of total
7-29 Nights
1 listings
1% of total
30+ Nights
23 listings
23.5% of total
Key Insights
- The most prevalent minimum stay requirement in Rondonópolis is 1 Night, adopted by 44.9% of listings. This highlights the market's preference for shorter, flexible bookings.
- A strong majority (71.4%) of the Rondonópolis Airbnb data shows acceptance of very short stays (1-2 nights), indicating a dynamic, high-turnover market.
- A significant segment (23.5%) caters to monthly stays (30+ nights) in Rondonópolis, pointing to opportunities in the extended-stay market.
Recommendations
- Align with the market by considering a 1 Night minimum stay, as 44.9% of Rondonópolis hosts use this setting.
- Explore offering discounts for stays of 30+ nights to attract the 23.5% of the market seeking extended stays.
- Adjust minimum nights based on seasonality – potentially shorter during low season and longer during peak demand periods in Rondonópolis.
Rondonópolis Airbnb Cancellation Policy Trends Analysis (2026)
Flexible
50 listings
51% of total
Moderate
17 listings
17.3% of total
Firm
28 listings
28.6% of total
Strict
3 listings
3.1% of total
Cancellation Policy Insights for Rondonópolis
- The prevailing Airbnb cancellation policy trend in Rondonópolis is Flexible, used by 51% of listings.
- There's a relatively balanced mix between guest-friendly (68.3%) and stricter (31.7%) policies, offering choices for different guest needs.
- Strict cancellation policies are quite rare (3.1%), potentially making listings with this policy less competitive unless justified by high demand or property type.
Recommendations for Hosts
- Consider adopting a Flexible policy to align with the 51% market standard in Rondonópolis.
- Given the high prevalence of Flexible policies (51%), offering this can enhance booking appeal, especially during shoulder seasons.
- Using a Strict policy might deter some guests, as only 3.1% of listings use it. Evaluate if potential revenue protection outweighs possible lower booking rates.
- Regularly review your cancellation policy against competitors and market demand shifts in Rondonópolis.
Rondonópolis STR Booking Lead Time Analysis (2026)
Average Booking Lead Time by Month
Booking Lead Time Insights for Rondonópolis
- The overall average booking lead time for vacation rentals in Rondonópolis is 19 days.
- Guests book furthest in advance for stays during July (average 30 days), likely coinciding with peak travel demand or local events.
- The shortest booking windows occur for stays in April (average 9 days), indicating more last-minute travel plans during this time.
- Seasonally, Winter (20 days avg.) sees the longest lead times, while Spring (11 days avg.) has the shortest, reflecting typical travel planning cycles.
Recommendations for Hosts
- Use the overall average lead time (19 days) as a baseline for your pricing and availability strategy in Rondonópolis.
- For July stays, consider implementing length-of-stay discounts or slightly higher rates for bookings made less than 30 days out to capitalize on advance planning.
- During April, focus on last-minute booking availability and promotions, as guests book with very short notice (9 days avg.).
- Target marketing efforts for the Winter season well in advance (at least 20 days) to capture early planners.
- Monitor your own booking lead times against these Rondonópolis averages to identify opportunities for dynamic pricing adjustments.
Popular & Essential Airbnb Amenities in Rondonópolis (2026)
Amenity Prevalence
Amenity Insights for Rondonópolis
- Essential amenities in Rondonópolis that guests expect include: Wifi, Kitchen. Lacking these (any) could significantly impact bookings.
- Popular amenities like Free parking on premises, Air conditioning, TV are common but not universal. Offering these can provide a competitive edge.
Recommendations for Hosts
- Ensure your listing includes all essential amenities for Rondonópolis: Wifi, Kitchen.
- Prioritize adding missing essentials: Wifi, Kitchen.
- Consider adding popular differentiators like Free parking on premises or Air conditioning to increase appeal.
- Highlight unique or less common amenities you offer (e.g., hot tub, dedicated workspace, EV charger) in your listing description and photos.
- Regularly check competitor amenities in Rondonópolis to stay competitive.
Rondonópolis Airbnb Guest Demographics & Profile Analysis (2026)
Guest Profile Summary for Rondonópolis
- The typical guest profile for Airbnb in Rondonópolis consists of primarily domestic travelers (97%), often arriving from nearby Mato Grosso, typically belonging to the Post-2000s (Gen Z/Alpha) group (50%), primarily speaking Portuguese or English.
- Domestic travelers account for 96.7% of guests.
- Key international markets include Brazil (96.7%) and United States (0.5%).
- Top languages spoken are Portuguese (62%) followed by English (17.6%).
- A significant demographic segment is the Post-2000s (Gen Z/Alpha) group, representing 50% of guests.
Recommendations for Hosts
- Target domestic marketing efforts towards travelers from Mato Grosso and Campo Grande.
- Tailor amenities and listing descriptions to appeal to the dominant Post-2000s (Gen Z/Alpha) demographic (e.g., highlight fast WiFi, smart home features, local guides).
- Highlight unique local experiences or amenities relevant to the primary guest profile.
- Consider seasonal promotions aligned with peak travel times for key origin markets.
Nearby Short-Term Rental Market Comparison
How does the Rondonópolis Airbnb market stack up against its neighbors? Compare key performance metrics like average monthly revenue, ADR, and occupancy rates in surrounding areas to understand the broader regional STR landscape.
| Market | Active Properties | Monthly Revenue | Daily Rate | Avg. Occupancy |
|---|---|---|---|---|
| Chapada dos Guimarães | 312 | $610 | $150.00 | 21% |
| Primavera do Leste | 76 | $213 | $43.99 | 32% |