Bonito Airbnb Market Analysis 2026: Short Term Rental Data & Vacation Rental Statistics in Mato Grosso do Sul, Brazil
Is Airbnb profitable in Bonito in 2026? Explore comprehensive Airbnb analytics for Bonito, Mato Grosso do Sul, Brazil to uncover income potential. This 2026 STR market report for Bonito, based on AirROI data from February 2025 to January 2026, reveals key trends in the market of 430 active listings.
Whether you're considering an Airbnb investment in Bonito, optimizing your existing vacation rental, or exploring rental arbitrage opportunities, understanding the Bonito Airbnb data is crucial. Leveraging the low regulation environment is key to maximizing your short term rental income potential. Let's dive into the specifics.
Key Bonito Airbnb Performance Metrics Overview
Monthly Airbnb Revenue Variations & Income Potential in Bonito (2026)
Understanding the monthly revenue variations for Airbnb listings in Bonito is key to maximizing your short term rental income potential. Seasonality significantly impacts earnings. Our analysis, based on data from the past 12 months, shows that the peak revenue month for STRs in Bonito is typically December, while June often presents the lowest earnings, highlighting opportunities for strategic pricing adjustments during shoulder and low seasons. Explore the typical Airbnb income in Bonito across different performance tiers:
- Best-in-class properties (Top 10%) achieve $2,231+ monthly, often utilizing dynamic pricing and superior guest experiences.
- Strong performing properties (Top 25%) earn $1,130 or more, indicating effective management and desirable locations/amenities.
- Typical properties (Median) generate around $549 per month, representing the average market performance.
- Entry-level properties (Bottom 25%) see earnings around $270, often with potential for optimization.
Average Monthly Airbnb Earnings Trend in Bonito
Bonito Airbnb Occupancy Rate Trends (2026)
Maximize your bookings by understanding the Bonito STR occupancy trends. Seasonal demand shifts significantly influence how often properties are booked. Typically, Julysees the highest demand (peak season occupancy), while June experiences the lowest (low season). Effective strategies, like adjusting minimum stays or offering promotions, can boost occupancy during slower periods. Here's how different property tiers perform in Bonito:
- Best-in-class properties (Top 10%) achieve 67%+ occupancy, indicating high desirability and potentially optimized availability.
- Strong performing properties (Top 25%) maintain 46% or higher occupancy, suggesting good market fit and guest satisfaction.
- Typical properties (Median) have an occupancy rate around 24%.
- Entry-level properties (Bottom 25%) average 13% occupancy, potentially facing higher vacancy.
Average Monthly Occupancy Rate Trend in Bonito
Average Daily Rate (ADR) Airbnb Trends in Bonito (2026)
Effective short term rental pricing strategy in Bonito involves understanding monthly ADR fluctuations. The Average Daily Rate (ADR) for Airbnb in Bonito typically peaks in December and dips lowest during April. Leveraging Airbnb dynamic pricing tools or strategies based on this seasonality can significantly boost revenue. Here's a look at the typical nightly rates achieved:
- Best-in-class properties (Top 10%) command rates of $224+ per night, often due to premium features or locations.
- Strong performing properties (Top 25%) achieve nightly rates of $137 or more.
- Typical properties (Median) charge around $79 per night.
- Entry-level properties (Bottom 25%) earn around $45 per night.
Average Daily Rate (ADR) Trend by Month in Bonito
Get Live Bonito Market Intelligence 👇

Explore Real-time Analytics
Airbnb Seasonality Analysis & Trends in Bonito (2026)
Peak Season (December, January, July)
- Revenue averages $1,271 per month
- Occupancy rates average 33.9%
- Daily rates average $121
Shoulder Season
- Revenue averages $884 per month
- Occupancy maintains around 31.9%
- Daily rates hold near $108
Low Season (May, June, November)
- Revenue drops to average $739 per month
- Occupancy decreases to average 27.3%
- Daily rates adjust to average $108
Seasonality Insights for Bonito
- The Airbnb seasonality in Bonito shows highly seasonal trends requiring careful strategy. While the sections above show seasonal averages, it's also insightful to look at the extremes:
- During the high season, the absolute peak month showcases Bonito's highest earning potential, with monthly revenues capable of climbing to $1,424, occupancy reaching a high of 36.0%, and ADRs peaking at $127.
- Conversely, the slowest single month of the year, typically falling within the low season, marks the market's lowest point. In this month, revenue might dip to $687, occupancy could drop to 24.8%, and ADRs may adjust down to $103.
- Understanding both the seasonal averages and these monthly peaks and troughs in revenue, occupancy, and ADR is crucial for maximizing your Airbnb profit potential in Bonito.
Seasonal Strategies for Maximizing Profit
- Peak Season: Maximize revenue through premium pricing and potentially longer minimum stays. Ensure high availability.
- Low Season: Offer competitive pricing, special promotions (e.g., extended stay discounts), and flexible cancellation policies. Target off-season travelers like remote workers or budget-conscious guests.
- Shoulder Seasons: Implement dynamic pricing that balances peak and low rates. Target weekend travelers or specific events. Offer slightly more flexible terms than peak season.
- Regularly analyze your own performance against these Bonito seasonality benchmarks and adjust your pricing and availability strategy accordingly.
Best Areas for Airbnb Investment in Bonito (2026)
Exploring the top neighborhoods for short-term rentals in Bonito? This section highlights key areas, outlining why they are attractive for hosts and guests, along with notable local attractions. Consider these locations based on your target guest profile and investment strategy.
| Neighborhood / Area | Why Host Here? (Target Guests & Appeal) | Key Attractions & Landmarks |
|---|---|---|
| Centro | The downtown area of Bonito is the heart of the city, filled with restaurants, shops, and cultural attractions. It’s the most accessible area for tourists looking to explore the local sights and amenities. | Bonito Convention Center, Bonito Public Market, Artisan Fair, Restaurants and local shops, Cultural events |
| Rio da Prata | A beautiful and popular destination for snorkeling and ecotourism. Hosting Airbnb properties here attracts nature enthusiasts and adventure seekers looking to explore the natural beauty of Bonito. | Rio da Prata for snorkeling, Aquario Natural, Boca da Onça Ecotour, Ecological tours, Local wildlife |
| Gruta do Lago Azul | Famous for its stunning blue lake and cave, this area draws visitors for its natural beauty. Investing in this location offers a unique experience for tourists seeking natural wonders and adventure. | Gruta do Lago Azul, Cave tours, Hiking trails, Photography opportunities, Nature exploration |
| Parque das Cachoeiras | An ecotourism park with waterfalls and lush landscapes, perfect for those seeking a tranquil nature experience. An Airbnb here attracts families and eco-tourists. | Waterfalls, Hiking trails, Picnic areas, Wildlife observation, Nature walks |
| Pantanal | A short drive from Bonito, the Pantanal is one of the world's largest tropical wetland areas. It's a prime spot for wildlife watching and offers unique experiences that draw nature lovers and adventure travelers. | Wildlife tours, Bird watching, Boat tours, Horseback riding, Cultural experiences with local communities |
| Estância Mimosa | A popular ecotourism destination offering various activities, including horseback riding and swimming in natural pools. Great for attracting families and adventure seekers. | Natural pools, Horseback riding, Ecological trails, Environmental education, Leisure activities |
| Zarpo | An area known for its vibrant local life and proximity to various attractions. It's a good investment spot for Airbnb due to its accessibility to everything Bonito has to offer. | Local eateries, Public transport access, Markets and shops, Nearby tours, Cultural festivals |
| Sussuarana | A lesser-known but beautiful area, offering peace and quiet while still being close to Bonito's attractions. Ideal for those looking for a more secluded Airbnb experience. | Nature trails, Scenic views, Quiet environment, Wildlife, Star gazing opportunities |
Understanding Airbnb License Requirements & STR Laws in Bonito (2026)
While Bonito, Mato Grosso do Sul, Brazil currently shows low STR regulations, specific Airbnb license requirements might still exist or change. Always verify the latest short term rental regulations and Airbnb license requirements directly with local government authorities for Bonito to ensure full compliance before hosting.
(Source: AirROI data, 2026, finding no licensed listings among those analyzed)
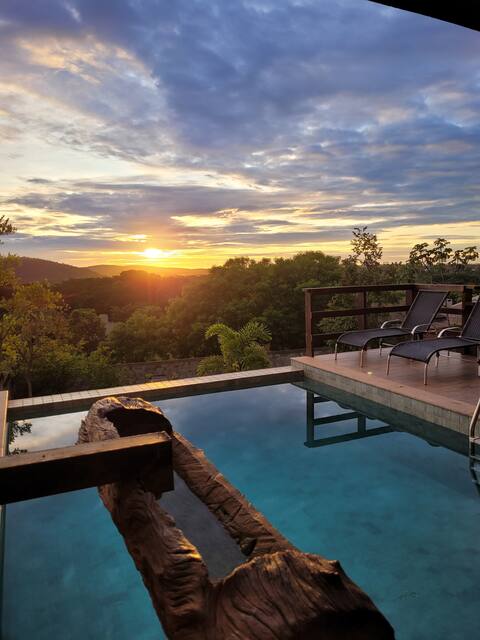
Top Performing Airbnb Properties in Bonito (2026)
Benchmark your potential! Explore examples of top-performing Airbnb properties in Bonitobased on Trailing Twelve Month (TTM) revenue. Analyze their characteristics, revenue, occupancy rate, and ADR to understand what drives success in this market.

Casa Lille
Entire Place • 4 bedrooms
Casa da Vista Bonito - MS
Entire Place • 4 bedrooms

Large house, for up to 21 people, complete leisure
Entire Place • 5 bedrooms

Jatobá Resort
Entire Place • 8 bedrooms

Casa Sol de Bonito, with 6 en-suites, Swimming Pool and Jacuzzi.
Entire Place • 6 bedrooms

Sophisticated house with 4 en-suites and a swimming pool
Entire Place • 4 bedrooms
Note: Performance varies based on location, size, amenities, seasonality, and management quality. Data reflects the past 12 months.
Top Performing Airbnb Hosts in Bonito (2026)
Learn from the best! This table showcases top-performing Airbnb hosts in Bonito based on the number of properties managed and estimated total revenue over the past year. Analyze their scale and performance metrics.
| Host Name | Properties | Grossing Revenue | Stay Reviews | Avg Rating |
|---|---|---|---|---|
| Bruno Canalini | 22 | $282,934 | 831 | 4.94/5.0 |
| Lizandra | 13 | $216,841 | 193 | 4.86/5.0 |
| Máira | 20 | $195,292 | 424 | 4.85/5.0 |
| Isadora | 2 | $105,271 | 123 | 4.96/5.0 |
| Larissa Gritti Dias | 2 | $70,974 | 130 | 4.95/5.0 |
| Carol Dutra | 6 | $69,984 | 99 | 4.74/5.0 |
| Caroline Mendes | 3 | $61,709 | 548 | 4.81/5.0 |
| Izabela Prado | 1 | $61,028 | 50 | 5.00/5.0 |
| Jessika | 8 | $59,356 | 641 | 4.83/5.0 |
| Elenice | 7 | $54,784 | 24 | 4.51/5.0 |
Analyzing the strategies of top hosts, such as their property selection, pricing, and guest communication, can offer valuable lessons for optimizing your own Airbnb operations in Bonito.
Dive Deeper: Advanced Bonito STR Market Data (2026)
Ready to unlock more insights? AirROI provides access to advanced metrics and comprehensive Airbnb data for Bonito. Explore detailed analytics beyond this report to refine your investment strategy, optimize pricing, and maximize your vacation rental profits.
Explore Advanced MetricsBonito Short-Term Rental Market Composition (2026): Property & Room Types
Room Type Distribution
Property Type Distribution
Market Composition Insights for Bonito
- The Bonito Airbnb market composition is heavily skewed towards Entire Home/Apt listings, which make up 80.9% of the 430 active rentals. This indicates strong guest preference for privacy and space.
- Looking at the property type distribution in Bonito, House properties are the most common (68.4%), reflecting the local real estate landscape.
- Houses represent a significant 68.4% portion, catering likely to families or larger groups.
- The presence of 10.9% Hotel/Boutique listings indicates integration with traditional hospitality.
- Smaller segments like outdoor/unique, others, unique stays (combined 4.6%) offer potential for unique stay experiences.
Bonito Airbnb Room Capacity Analysis (2026): Bedroom Distribution
Distribution of Listings by Number of Bedrooms
Room Capacity Insights for Bonito
- The dominant room capacity in Bonito is 2 bedrooms listings, making up 27.4% of the market. This suggests a strong demand for properties suitable for couples or solo travelers.
- Together, 2 bedrooms and 1 bedroom properties represent 53.4% of the active Airbnb listings in Bonito, indicating a high concentration in these sizes.
- A significant 32.7% of listings offer 3+ bedrooms, catering to larger groups and families seeking more space in Bonito.
Bonito Vacation Rental Guest Capacity Trends (2026)
Distribution of Listings by Guest Capacity
Guest Capacity Insights for Bonito
- The most common guest capacity trend in Bonito vacation rentals is listings accommodating 8+ guests (40.5%). This suggests the primary traveler segment is likely larger groups.
- Properties designed for 8+ guests and 4 guests dominate the Bonito STR market, accounting for 54.2% of listings.
- 54.5% of properties accommodate 6+ guests, serving the market segment for larger families or group travel in Bonito.
- On average, properties in Bonito are equipped to host 5.4 guests.
Bonito Airbnb Booking Patterns (2026): Available vs. Booked Days
Available Days Distribution
Booked Days Distribution
Booking Pattern Insights for Bonito
- The most common availability pattern in Bonito falls within the 271-366 days range, representing 70.2% of listings. This suggests many properties have significant open periods on their calendars.
- Approximately 91.6% of listings show high availability (181+ days open annually), indicating potential for increased bookings or specific owner usage patterns.
- For booked days, the 1-30 days range is most frequent in Bonito (34.4%), reflecting common guest stay durations or potential owner blocking patterns.
- A notable 9.3% of properties secure long booking periods (181+ days booked per year), highlighting successful long-term rental strategies or significant owner usage.
Bonito Airbnb Minimum Stay Requirements Analysis
Distribution of Listings by Minimum Night Requirement
1 Night
83 listings
19.3% of total
2 Nights
198 listings
46% of total
3 Nights
18 listings
4.2% of total
4-6 Nights
2 listings
0.5% of total
30+ Nights
129 listings
30% of total
Key Insights
- The most prevalent minimum stay requirement in Bonito is 2 Nights, adopted by 46% of listings. This highlights the market's preference for shorter, flexible bookings.
- A strong majority (65.3%) of the Bonito Airbnb data shows acceptance of very short stays (1-2 nights), indicating a dynamic, high-turnover market.
- A significant segment (30%) caters to monthly stays (30+ nights) in Bonito, pointing to opportunities in the extended-stay market.
Recommendations
- Align with the market by considering a 2 Nights minimum stay, as 46% of Bonito hosts use this setting.
- If feasible, allowing 1-night stays, especially midweek or during low season, could capture last-minute bookings, as only 19.3% currently do.
- A 2-night minimum appears standard (46%). Consider this for weekends or peak periods.
- Explore offering discounts for stays of 30+ nights to attract the 30% of the market seeking extended stays.
- Adjust minimum nights based on seasonality – potentially shorter during low season and longer during peak demand periods in Bonito.
Bonito Airbnb Cancellation Policy Trends Analysis (2026)
Refundable
2 listings
0.5% of total
Non-refundable
2 listings
0.5% of total
Super Strict 60 Days
1 listings
0.2% of total
Super Strict 30 Days
2 listings
0.5% of total
Limited
4 listings
0.9% of total
Flexible
113 listings
26.4% of total
Moderate
126 listings
29.4% of total
Firm
133 listings
31.1% of total
Strict
45 listings
10.5% of total
Cancellation Policy Insights for Bonito
- The prevailing Airbnb cancellation policy trend in Bonito is Firm, used by 31.1% of listings.
- There's a relatively balanced mix between guest-friendly (55.8%) and stricter (41.6%) policies, offering choices for different guest needs.
Recommendations for Hosts
- Consider adopting a Firm policy to align with the 31.1% market standard in Bonito.
- Using a Strict policy might deter some guests, as only 10.5% of listings use it. Evaluate if potential revenue protection outweighs possible lower booking rates.
- Regularly review your cancellation policy against competitors and market demand shifts in Bonito.
Bonito STR Booking Lead Time Analysis (2026)
Average Booking Lead Time by Month
Booking Lead Time Insights for Bonito
- The overall average booking lead time for vacation rentals in Bonito is 41 days.
- Guests book furthest in advance for stays during December (average 59 days), likely coinciding with peak travel demand or local events.
- The shortest booking windows occur for stays in February (average 28 days), indicating more last-minute travel plans during this time.
- Seasonally, Winter (42 days avg.) sees the longest lead times, while Spring (35 days avg.) has the shortest, reflecting typical travel planning cycles.
Recommendations for Hosts
- Use the overall average lead time (41 days) as a baseline for your pricing and availability strategy in Bonito.
- For December stays, consider implementing length-of-stay discounts or slightly higher rates for bookings made less than 59 days out to capitalize on advance planning.
- Target marketing efforts for the Winter season well in advance (at least 42 days) to capture early planners.
- Monitor your own booking lead times against these Bonito averages to identify opportunities for dynamic pricing adjustments.
Popular & Essential Airbnb Amenities in Bonito (2026)
Amenity Prevalence
Amenity Insights for Bonito
- Essential amenities in Bonito that guests expect include: Wifi, Air conditioning. Lacking these (any) could significantly impact bookings.
- Popular amenities like Free parking on premises, TV, Kitchen are common but not universal. Offering these can provide a competitive edge.
Recommendations for Hosts
- Ensure your listing includes all essential amenities for Bonito: Wifi, Air conditioning.
- Prioritize adding missing essentials: Wifi, Air conditioning.
- Consider adding popular differentiators like Free parking on premises or TV to increase appeal.
- Highlight unique or less common amenities you offer (e.g., hot tub, dedicated workspace, EV charger) in your listing description and photos.
- Regularly check competitor amenities in Bonito to stay competitive.
Bonito Airbnb Guest Demographics & Profile Analysis (2026)
Guest Profile Summary for Bonito
- The typical guest profile for Airbnb in Bonito consists of primarily domestic travelers (87%), often arriving from nearby Campo Grande, typically belonging to the Post-2000s (Gen Z/Alpha) group (50%), primarily speaking Portuguese or English.
- Domestic travelers account for 87.2% of guests.
- Key international markets include Brazil (87.2%) and United States (1.9%).
- Top languages spoken are Portuguese (42.1%) followed by English (29.8%).
- A significant demographic segment is the Post-2000s (Gen Z/Alpha) group, representing 50% of guests.
Recommendations for Hosts
- Target domestic marketing efforts towards travelers from Campo Grande and São Paulo.
- Tailor amenities and listing descriptions to appeal to the dominant Post-2000s (Gen Z/Alpha) demographic (e.g., highlight fast WiFi, smart home features, local guides).
- Highlight unique local experiences or amenities relevant to the primary guest profile.
- Consider seasonal promotions aligned with peak travel times for key origin markets.
Nearby Short-Term Rental Market Comparison
How does the Bonito Airbnb market stack up against its neighbors? Compare key performance metrics like average monthly revenue, ADR, and occupancy rates in surrounding areas to understand the broader regional STR landscape.
| Market | Active Properties | Monthly Revenue | Daily Rate | Avg. Occupancy |
|---|---|---|---|---|
| Aquidauana | 27 | $600 | $93.36 | 26% |
| Bodoquena | 18 | $447 | $92.73 | 21% |
| Ponta Porã | 44 | $215 | $31.57 | 35% |