Senador Canedo Airbnb Market Analysis 2026: Short Term Rental Data & Vacation Rental Statistics in Goiás, Brazil
Is Airbnb profitable in Senador Canedo in 2026? Explore comprehensive Airbnb analytics for Senador Canedo, Goiás, Brazil to uncover income potential. This 2026 STR market report for Senador Canedo, based on AirROI data from February 2025 to January 2026, reveals key trends in the niche market of 22 active listings.
Whether you're considering an Airbnb investment in Senador Canedo, optimizing your existing vacation rental, or exploring rental arbitrage opportunities, understanding the Senador Canedo Airbnb data is crucial. Leveraging the low regulation environment is key to maximizing your short term rental income potential. Let's dive into the specifics.
Key Senador Canedo Airbnb Performance Metrics Overview
Monthly Airbnb Revenue Variations & Income Potential in Senador Canedo (2026)
Understanding the monthly revenue variations for Airbnb listings in Senador Canedo is key to maximizing your short term rental income potential. Seasonality significantly impacts earnings. Our analysis, based on data from the past 12 months, shows that the peak revenue month for STRs in Senador Canedo is typically July, while May often presents the lowest earnings, highlighting opportunities for strategic pricing adjustments during shoulder and low seasons. Explore the typical Airbnb income in Senador Canedo across different performance tiers:
- Best-in-class properties (Top 10%) achieve $2,572+ monthly, often utilizing dynamic pricing and superior guest experiences.
- Strong performing properties (Top 25%) earn $1,604 or more, indicating effective management and desirable locations/amenities.
- Typical properties (Median) generate around $717 per month, representing the average market performance.
- Entry-level properties (Bottom 25%) see earnings around $272, often with potential for optimization.
Average Monthly Airbnb Earnings Trend in Senador Canedo
Senador Canedo Airbnb Occupancy Rate Trends (2026)
Maximize your bookings by understanding the Senador Canedo STR occupancy trends. Seasonal demand shifts significantly influence how often properties are booked. Typically, Decembersees the highest demand (peak season occupancy), while November experiences the lowest (low season). Effective strategies, like adjusting minimum stays or offering promotions, can boost occupancy during slower periods. Here's how different property tiers perform in Senador Canedo:
- Best-in-class properties (Top 10%) achieve 61%+ occupancy, indicating high desirability and potentially optimized availability.
- Strong performing properties (Top 25%) maintain 40% or higher occupancy, suggesting good market fit and guest satisfaction.
- Typical properties (Median) have an occupancy rate around 22%.
- Entry-level properties (Bottom 25%) average 11% occupancy, potentially facing higher vacancy.
Average Monthly Occupancy Rate Trend in Senador Canedo
Average Daily Rate (ADR) Airbnb Trends in Senador Canedo (2026)
Effective short term rental pricing strategy in Senador Canedo involves understanding monthly ADR fluctuations. The Average Daily Rate (ADR) for Airbnb in Senador Canedo typically peaks in June and dips lowest during January. Leveraging Airbnb dynamic pricing tools or strategies based on this seasonality can significantly boost revenue. Here's a look at the typical nightly rates achieved:
- Best-in-class properties (Top 10%) command rates of $299+ per night, often due to premium features or locations.
- Strong performing properties (Top 25%) achieve nightly rates of $246 or more.
- Typical properties (Median) charge around $109 per night.
- Entry-level properties (Bottom 25%) earn around $28 per night.
Average Daily Rate (ADR) Trend by Month in Senador Canedo
Get Live Senador Canedo Market Intelligence 👇

Explore Real-time Analytics
Airbnb Seasonality Analysis & Trends in Senador Canedo (2026)
Peak Season (July, December, March)
- Revenue averages $1,645 per month
- Occupancy rates average 35.5%
- Daily rates average $145
Shoulder Season
- Revenue averages $969 per month
- Occupancy maintains around 26.2%
- Daily rates hold near $142
Low Season (May, September, October)
- Revenue drops to average $804 per month
- Occupancy decreases to average 25.7%
- Daily rates adjust to average $140
Seasonality Insights for Senador Canedo
- The Airbnb seasonality in Senador Canedo shows highly seasonal trends requiring careful strategy. While the sections above show seasonal averages, it's also insightful to look at the extremes:
- During the high season, the absolute peak month showcases Senador Canedo's highest earning potential, with monthly revenues capable of climbing to $1,933, occupancy reaching a high of 40.8%, and ADRs peaking at $154.
- Conversely, the slowest single month of the year, typically falling within the low season, marks the market's lowest point. In this month, revenue might dip to $788, occupancy could drop to 21.8%, and ADRs may adjust down to $130.
- Understanding both the seasonal averages and these monthly peaks and troughs in revenue, occupancy, and ADR is crucial for maximizing your Airbnb profit potential in Senador Canedo.
Seasonal Strategies for Maximizing Profit
- Peak Season: Maximize revenue through premium pricing and potentially longer minimum stays. Ensure high availability.
- Low Season: Offer competitive pricing, special promotions (e.g., extended stay discounts), and flexible cancellation policies. Target off-season travelers like remote workers or budget-conscious guests.
- Shoulder Seasons: Implement dynamic pricing that balances peak and low rates. Target weekend travelers or specific events. Offer slightly more flexible terms than peak season.
- Regularly analyze your own performance against these Senador Canedo seasonality benchmarks and adjust your pricing and availability strategy accordingly.
Best Areas for Airbnb Investment in Senador Canedo (2026)
Exploring the top neighborhoods for short-term rentals in Senador Canedo? This section highlights key areas, outlining why they are attractive for hosts and guests, along with notable local attractions. Consider these locations based on your target guest profile and investment strategy.
| Neighborhood / Area | Why Host Here? (Target Guests & Appeal) | Key Attractions & Landmarks |
|---|---|---|
| Centro | The heart of Senador Canedo, featuring a variety of shops, restaurants, and cultural attractions. A prime location for visitors looking for convenience and access to local life. | Paróquia São João Batista, Feira Livre, Praça da Bíblia, Comércio Local, Restaurantes Regionais |
| Jardim das Esmeraldas | A popular residential area known for its family-friendly environment and accessibility to schools and parks, appealing to visitors with children. | Praça Esmeraldas, Parque Municipal de Senador Canedo, Escolas de Educação Infantil, Opções de Alimentação Familiar |
| Setor Santos Dumont | A growing neighborhood with modern developments, attracting both local and international visitors for business and leisure. | Centro de Eventos Senador Canedo, Parque dos Buritis, Atrações Comerciais Locais |
| Setor Nova Era | A vibrant area that is rapidly developing, making it enticing for real estate investment and tourists seeking new experiences. | Parque de Diversões, Shopping Senador Canedo, Local de Festejos |
| Jardim Novo Mundo | Known for its green spaces and quiet streets, perfect for families and travelers looking for a peaceful stay while still being close to attractions. | Parque Jardim Novo Mundo, Praças e Áreas Verdes, Vários restaurantes a preços acessíveis |
| Setor Leste | An up-and-coming neighborhood with new restaurants and shops, drawing in young travelers and residents wanting to experience local culture. | Cafés e Bares Locais, Feiras de Artesanato, Atividades Culturais |
| Chácara dos Horto | A suburban area that offers a rustic charm and a connection to nature, appealing to those who enjoy outdoor activities and relaxation. | Horto Municipal, Trilhas e Atividades ao Ar Livre, Programas de Hípica |
| Setor B | A neighborhood that offers good transport links and is near to local businesses, appealing to those requiring convenience and access to the city. | Mercado Municipal, Restaurantes e Bares, Festas de Comunidade |
Understanding Airbnb License Requirements & STR Laws in Senador Canedo (2026)
While Senador Canedo, Goiás, Brazil currently shows low STR regulations, specific Airbnb license requirements might still exist or change. Always verify the latest short term rental regulations and Airbnb license requirements directly with local government authorities for Senador Canedo to ensure full compliance before hosting.
(Source: AirROI data, 2026, finding no licensed listings among those analyzed)
Top Performing Airbnb Properties in Senador Canedo (2026)
Benchmark your potential! Explore examples of top-performing Airbnb properties in Senador Canedobased on Trailing Twelve Month (TTM) revenue. Analyze their characteristics, revenue, occupancy rate, and ADR to understand what drives success in this market.

Farmhouse for your family
Entire Place • 4 bedrooms

Closed Home - Moto GP racetrack
Entire Place • 1 bedroom
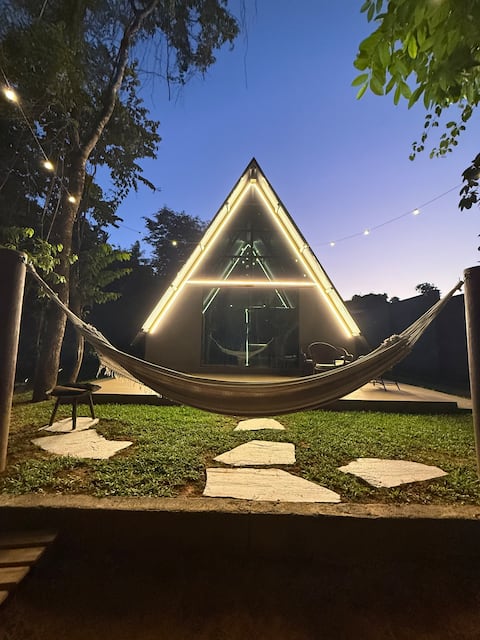
A cabin with comfort in the midst of nature
Entire Place • 1 bedroom
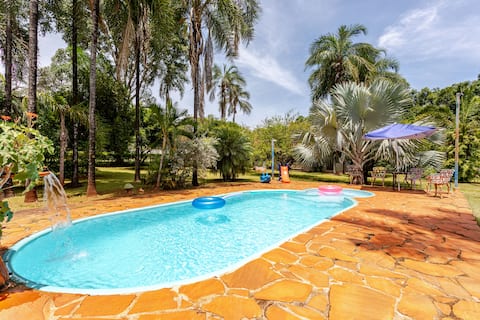
Farmhouse with Heated Pool and Fireplace - 5' Goiânia
Entire Place • 2 bedrooms

Farmhouse with 7 bedrooms - Quinta da Boa Vista
Entire Place • 7 bedrooms
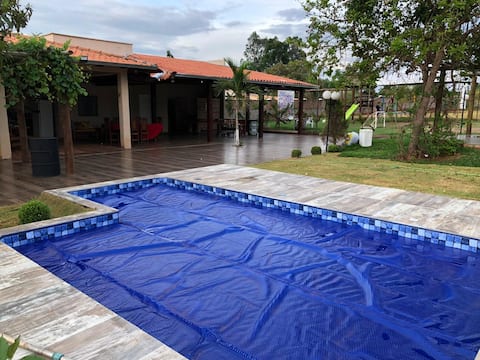
Family farm: Near Flamboyant - 4 en-suites
Entire Place • 4 bedrooms
Note: Performance varies based on location, size, amenities, seasonality, and management quality. Data reflects the past 12 months.
Top Performing Airbnb Hosts in Senador Canedo (2026)
Learn from the best! This table showcases top-performing Airbnb hosts in Senador Canedo based on the number of properties managed and estimated total revenue over the past year. Analyze their scale and performance metrics.
| Host Name | Properties | Grossing Revenue | Stay Reviews | Avg Rating |
|---|---|---|---|---|
| Dr Carlos Bahia | 1 | $29,561 | 96 | 4.81/5.0 |
| Eloanne | 1 | $28,199 | 73 | 4.85/5.0 |
| Rafael Nunes | 1 | $23,047 | 35 | 4.97/5.0 |
| Leonardo Ferreira | 1 | $19,558 | 43 | 5.00/5.0 |
| Giselle | 1 | $16,762 | 10 | 5.00/5.0 |
| Kenia | 1 | $11,655 | 12 | 4.92/5.0 |
| Cleuza | 1 | $10,270 | 197 | 4.96/5.0 |
| Milena | 1 | $9,667 | 11 | 4.91/5.0 |
| Janaina | 1 | $9,246 | 5 | 4.80/5.0 |
| Rogério | 1 | $6,036 | 9 | 4.89/5.0 |
Analyzing the strategies of top hosts, such as their property selection, pricing, and guest communication, can offer valuable lessons for optimizing your own Airbnb operations in Senador Canedo.
Dive Deeper: Advanced Senador Canedo STR Market Data (2026)
Ready to unlock more insights? AirROI provides access to advanced metrics and comprehensive Airbnb data for Senador Canedo. Explore detailed analytics beyond this report to refine your investment strategy, optimize pricing, and maximize your vacation rental profits.
Explore Advanced MetricsSenador Canedo Short-Term Rental Market Composition (2026): Property & Room Types
Room Type Distribution
Property Type Distribution
Market Composition Insights for Senador Canedo
- The Senador Canedo Airbnb market composition is heavily skewed towards Entire Home/Apt listings, which make up 86.4% of the 22 active rentals. This indicates strong guest preference for privacy and space.
- Looking at the property type distribution in Senador Canedo, House properties are the most common (50%), reflecting the local real estate landscape.
- Houses represent a significant 50% portion, catering likely to families or larger groups.
- The presence of 13.6% Hotel/Boutique listings indicates integration with traditional hospitality.
- Smaller segments like others (combined 4.5%) offer potential for unique stay experiences.
Senador Canedo Airbnb Room Capacity Analysis (2026): Bedroom Distribution
Distribution of Listings by Number of Bedrooms
Room Capacity Insights for Senador Canedo
- The dominant room capacity in Senador Canedo is 1 bedroom listings, making up 22.7% of the market. This suggests a strong demand for properties suitable for couples or solo travelers.
- Together, 1 bedroom and 3 bedrooms properties represent 45.4% of the active Airbnb listings in Senador Canedo, indicating a high concentration in these sizes.
- A significant 54.5% of listings offer 3+ bedrooms, catering to larger groups and families seeking more space in Senador Canedo.
Senador Canedo Vacation Rental Guest Capacity Trends (2026)
Distribution of Listings by Guest Capacity
Guest Capacity Insights for Senador Canedo
- The most common guest capacity trend in Senador Canedo vacation rentals is listings accommodating 8+ guests (45.5%). This suggests the primary traveler segment is likely larger groups.
- Properties designed for 8+ guests and 2 guests dominate the Senador Canedo STR market, accounting for 63.7% of listings.
- 54.6% of properties accommodate 6+ guests, serving the market segment for larger families or group travel in Senador Canedo.
- On average, properties in Senador Canedo are equipped to host 5.1 guests.
Senador Canedo Airbnb Booking Patterns (2026): Available vs. Booked Days
Available Days Distribution
Booked Days Distribution
Booking Pattern Insights for Senador Canedo
- The most common availability pattern in Senador Canedo falls within the 271-366 days range, representing 81.8% of listings. This suggests many properties have significant open periods on their calendars.
- Approximately 90.9% of listings show high availability (181+ days open annually), indicating potential for increased bookings or specific owner usage patterns.
- For booked days, the 31-90 days range is most frequent in Senador Canedo (54.5%), reflecting common guest stay durations or potential owner blocking patterns.
- A notable 9.1% of properties secure long booking periods (181+ days booked per year), highlighting successful long-term rental strategies or significant owner usage.
Senador Canedo Airbnb Minimum Stay Requirements Analysis
Distribution of Listings by Minimum Night Requirement
1 Night
8 listings
36.4% of total
2 Nights
8 listings
36.4% of total
3 Nights
1 listings
4.5% of total
30+ Nights
5 listings
22.7% of total
Key Insights
- The most prevalent minimum stay requirement in Senador Canedo is 1 Night, adopted by 36.4% of listings. This highlights the market's preference for shorter, flexible bookings.
- A strong majority (72.8%) of the Senador Canedo Airbnb data shows acceptance of very short stays (1-2 nights), indicating a dynamic, high-turnover market.
- A significant segment (22.7%) caters to monthly stays (30+ nights) in Senador Canedo, pointing to opportunities in the extended-stay market.
Recommendations
- Align with the market by considering a 1 Night minimum stay, as 36.4% of Senador Canedo hosts use this setting.
- Explore offering discounts for stays of 30+ nights to attract the 22.7% of the market seeking extended stays.
- Adjust minimum nights based on seasonality – potentially shorter during low season and longer during peak demand periods in Senador Canedo.
Senador Canedo Airbnb Cancellation Policy Trends Analysis (2026)
Flexible
9 listings
40.9% of total
Moderate
7 listings
31.8% of total
Firm
5 listings
22.7% of total
Strict
1 listings
4.5% of total
Cancellation Policy Insights for Senador Canedo
- The prevailing Airbnb cancellation policy trend in Senador Canedo is Flexible, used by 40.9% of listings.
- The market strongly favors guest-friendly terms, with 72.7% of listings offering Flexible or Moderate policies. This suggests guests in Senador Canedo may expect booking flexibility.
- Strict cancellation policies are quite rare (4.5%), potentially making listings with this policy less competitive unless justified by high demand or property type.
Recommendations for Hosts
- Consider adopting a Flexible policy to align with the 40.9% market standard in Senador Canedo.
- Using a Strict policy might deter some guests, as only 4.5% of listings use it. Evaluate if potential revenue protection outweighs possible lower booking rates.
- Regularly review your cancellation policy against competitors and market demand shifts in Senador Canedo.
Senador Canedo STR Booking Lead Time Analysis (2026)
Average Booking Lead Time by Month
Booking Lead Time Insights for Senador Canedo
- The overall average booking lead time for vacation rentals in Senador Canedo is 18 days.
- Guests book furthest in advance for stays during January (average 31 days), likely coinciding with peak travel demand or local events.
- The shortest booking windows occur for stays in June (average 10 days), indicating more last-minute travel plans during this time.
- Seasonally, Winter (27 days avg.) sees the longest lead times, while Fall (16 days avg.) has the shortest, reflecting typical travel planning cycles.
Recommendations for Hosts
- Use the overall average lead time (18 days) as a baseline for your pricing and availability strategy in Senador Canedo.
- For January stays, consider implementing length-of-stay discounts or slightly higher rates for bookings made less than 31 days out to capitalize on advance planning.
- During June, focus on last-minute booking availability and promotions, as guests book with very short notice (10 days avg.).
- Target marketing efforts for the Winter season well in advance (at least 27 days) to capture early planners.
- Monitor your own booking lead times against these Senador Canedo averages to identify opportunities for dynamic pricing adjustments.
Popular & Essential Airbnb Amenities in Senador Canedo (2026)
Amenity Prevalence
Amenity Insights for Senador Canedo
- Essential amenities in Senador Canedo that guests expect include: Kitchen, Free parking on premises. Lacking these (any) could significantly impact bookings.
- Popular amenities like TV, Wifi, Stove are common but not universal. Offering these can provide a competitive edge.
- Warning: Wifi is not universally provided but is considered essential globally. Ensure reliable Wifi is offered.
Recommendations for Hosts
- Ensure your listing includes all essential amenities for Senador Canedo: Kitchen, Free parking on premises.
- Prioritize adding missing essentials: Free parking on premises.
- Consider adding popular differentiators like TV or Wifi to increase appeal.
- Highlight unique or less common amenities you offer (e.g., hot tub, dedicated workspace, EV charger) in your listing description and photos.
- Regularly check competitor amenities in Senador Canedo to stay competitive.
Senador Canedo Airbnb Guest Demographics & Profile Analysis (2026)
Guest Profile Summary for Senador Canedo
- The typical guest profile for Airbnb in Senador Canedo consists of primarily domestic travelers (98%), often arriving from nearby Goiânia, typically belonging to the Post-2000s (Gen Z/Alpha) group (50%), primarily speaking Portuguese or English.
- Domestic travelers account for 98.3% of guests.
- Key international markets include Brazil (98.3%) and Germany (1.7%).
- Top languages spoken are Portuguese (48.6%) followed by English (29.7%).
- A significant demographic segment is the Post-2000s (Gen Z/Alpha) group, representing 50% of guests.
Recommendations for Hosts
- Target domestic marketing efforts towards travelers from Goiânia and Goiás.
- Tailor amenities and listing descriptions to appeal to the dominant Post-2000s (Gen Z/Alpha) demographic (e.g., highlight fast WiFi, smart home features, local guides).
- Highlight unique local experiences or amenities relevant to the primary guest profile.
- Consider seasonal promotions aligned with peak travel times for key origin markets.
Nearby Short-Term Rental Market Comparison
How does the Senador Canedo Airbnb market stack up against its neighbors? Compare key performance metrics like average monthly revenue, ADR, and occupancy rates in surrounding areas to understand the broader regional STR landscape.
| Market | Active Properties | Monthly Revenue | Daily Rate | Avg. Occupancy |
|---|---|---|---|---|
| Pirenópolis | 1,571 | $848 | $122.51 | 28% |
| Alexânia | 119 | $826 | $157.61 | 23% |
| Ceilândia | 20 | $746 | $92.42 | 42% |
| Abadiânia | 30 | $621 | $106.06 | 25% |
| Santo Antônio do Descoberto | 15 | $590 | $129.95 | 22% |
| Luziânia | 20 | $588 | $120.76 | 23% |
| Pirenopolis | 41 | $508 | $113.72 | 24% |
| Bela Vista de Goiás | 19 | $494 | $134.07 | 18% |
| Gama | 22 | $478 | $104.02 | 34% |
| Hidrolândia | 17 | $472 | $181.07 | 16% |