Rio Quente Airbnb Market Analysis 2026: Short Term Rental Data & Vacation Rental Statistics in Goiás, Brazil
Is Airbnb profitable in Rio Quente in 2026? Explore comprehensive Airbnb analytics for Rio Quente, Goiás, Brazil to uncover income potential. This 2026 STR market report for Rio Quente, based on AirROI data from February 2025 to January 2026, reveals key trends in the market of 395 active listings.
Whether you're considering an Airbnb investment in Rio Quente, optimizing your existing vacation rental, or exploring rental arbitrage opportunities, understanding the Rio Quente Airbnb data is crucial. Leveraging the low regulation environment is key to maximizing your short term rental income potential. Let's dive into the specifics.
Key Rio Quente Airbnb Performance Metrics Overview
Monthly Airbnb Revenue Variations & Income Potential in Rio Quente (2026)
Understanding the monthly revenue variations for Airbnb listings in Rio Quente is key to maximizing your short term rental income potential. Seasonality significantly impacts earnings. Our analysis, based on data from the past 12 months, shows that the peak revenue month for STRs in Rio Quente is typically July, while May often presents the lowest earnings, highlighting opportunities for strategic pricing adjustments during shoulder and low seasons. Explore the typical Airbnb income in Rio Quente across different performance tiers:
- Best-in-class properties (Top 10%) achieve $1,104+ monthly, often utilizing dynamic pricing and superior guest experiences.
- Strong performing properties (Top 25%) earn $747 or more, indicating effective management and desirable locations/amenities.
- Typical properties (Median) generate around $453 per month, representing the average market performance.
- Entry-level properties (Bottom 25%) see earnings around $233, often with potential for optimization.
Average Monthly Airbnb Earnings Trend in Rio Quente
Rio Quente Airbnb Occupancy Rate Trends (2026)
Maximize your bookings by understanding the Rio Quente STR occupancy trends. Seasonal demand shifts significantly influence how often properties are booked. Typically, Julysees the highest demand (peak season occupancy), while May experiences the lowest (low season). Effective strategies, like adjusting minimum stays or offering promotions, can boost occupancy during slower periods. Here's how different property tiers perform in Rio Quente:
- Best-in-class properties (Top 10%) achieve 64%+ occupancy, indicating high desirability and potentially optimized availability.
- Strong performing properties (Top 25%) maintain 45% or higher occupancy, suggesting good market fit and guest satisfaction.
- Typical properties (Median) have an occupancy rate around 27%.
- Entry-level properties (Bottom 25%) average 13% occupancy, potentially facing higher vacancy.
Average Monthly Occupancy Rate Trend in Rio Quente
Average Daily Rate (ADR) Airbnb Trends in Rio Quente (2026)
Effective short term rental pricing strategy in Rio Quente involves understanding monthly ADR fluctuations. The Average Daily Rate (ADR) for Airbnb in Rio Quente typically peaks in January and dips lowest during April. Leveraging Airbnb dynamic pricing tools or strategies based on this seasonality can significantly boost revenue. Here's a look at the typical nightly rates achieved:
- Best-in-class properties (Top 10%) command rates of $104+ per night, often due to premium features or locations.
- Strong performing properties (Top 25%) achieve nightly rates of $68 or more.
- Typical properties (Median) charge around $52 per night.
- Entry-level properties (Bottom 25%) earn around $41 per night.
Average Daily Rate (ADR) Trend by Month in Rio Quente
Get Live Rio Quente Market Intelligence 👇

Explore Real-time Analytics
Airbnb Seasonality Analysis & Trends in Rio Quente (2026)
Peak Season (July, December, January)
- Revenue averages $876 per month
- Occupancy rates average 39.1%
- Daily rates average $74
Shoulder Season
- Revenue averages $497 per month
- Occupancy maintains around 30.1%
- Daily rates hold near $60
Low Season (February, May, June)
- Revenue drops to average $402 per month
- Occupancy decreases to average 26.5%
- Daily rates adjust to average $59
Seasonality Insights for Rio Quente
- The Airbnb seasonality in Rio Quente shows highly seasonal trends requiring careful strategy. While the sections above show seasonal averages, it's also insightful to look at the extremes:
- During the high season, the absolute peak month showcases Rio Quente's highest earning potential, with monthly revenues capable of climbing to $1,030, occupancy reaching a high of 50.4%, and ADRs peaking at $77.
- Conversely, the slowest single month of the year, typically falling within the low season, marks the market's lowest point. In this month, revenue might dip to $384, occupancy could drop to 24.3%, and ADRs may adjust down to $57.
- Understanding both the seasonal averages and these monthly peaks and troughs in revenue, occupancy, and ADR is crucial for maximizing your Airbnb profit potential in Rio Quente.
Seasonal Strategies for Maximizing Profit
- Peak Season: Maximize revenue through premium pricing and potentially longer minimum stays. Ensure high availability.
- Low Season: Offer competitive pricing, special promotions (e.g., extended stay discounts), and flexible cancellation policies. Target off-season travelers like remote workers or budget-conscious guests.
- Shoulder Seasons: Implement dynamic pricing that balances peak and low rates. Target weekend travelers or specific events. Offer slightly more flexible terms than peak season.
- Regularly analyze your own performance against these Rio Quente seasonality benchmarks and adjust your pricing and availability strategy accordingly.
Best Areas for Airbnb Investment in Rio Quente (2026)
Exploring the top neighborhoods for short-term rentals in Rio Quente? This section highlights key areas, outlining why they are attractive for hosts and guests, along with notable local attractions. Consider these locations based on your target guest profile and investment strategy.
| Neighborhood / Area | Why Host Here? (Target Guests & Appeal) | Key Attractions & Landmarks |
|---|---|---|
| Hot Park | A popular water park known for its hot springs and family-friendly attractions. Ideal for tourists looking for relaxation and fun in a unique thermal environment. | Hot Park water park, Thermas River, Natural hot springs, Adventure activities, Spa services |
| Rio Quente Resorts | A luxury resort destination with a variety of accommodations and amenities, attracting families and vacationers seeking leisure and entertainment. | Rio Quente Resorts, Thermal pools, Gastronomic options, Eco-park, Adventure sports |
| Praia do Cerrado | A unique man-made beach area within the resort, providing guests with a sandy beach experience and aquatic activities. | Artificial beach, Beach sports, Restaurants, Leisure areas |
| Parque Estadual da Serra de Caldas Novas | A beautiful natural park nearby that offers hiking, wildlife viewing, and a chance to explore the Brazilian Cerrado landscape. | Hiking trails, Wildlife sanctuaries, Scenic views, Nature exploration |
| Caldas Novas | Nearby town famous for its hot spring pools and resorts, appealing to those seeking additional lodging and entertainment options close to Rio Quente. | Hot spring pools, Nightlife, Shopping, Local cuisine |
| Canyon de Furnas | A stunning canyon area nearby that offers picturesque views and outdoor activities suitable for adventure seekers. | Scenic overlooks, Kayaking, Hiking trails, Photography spots |
| Local Markets | Experience local culture and cuisine through various markets in the region. Attractive for tourists looking to immerse themselves in local life. | Local handicrafts, Culinary experiences, Food stands, Cultural events |
| Cultural Landmarks | Historical and cultural sites in the region that provide insight into the local heritage and history, appealing to cultural tourists. | Museums, Historic churches, Local art galleries, Cultural festivals |
Understanding Airbnb License Requirements & STR Laws in Rio Quente (2026)
While Rio Quente, Goiás, Brazil currently shows low STR regulations, specific Airbnb license requirements might still exist or change. Always verify the latest short term rental regulations and Airbnb license requirements directly with local government authorities for Rio Quente to ensure full compliance before hosting.
(Source: AirROI data, 2026, finding no licensed listings among those analyzed)
Top Performing Airbnb Properties in Rio Quente (2026)
Benchmark your potential! Explore examples of top-performing Airbnb properties in Rio Quentebased on Trailing Twelve Month (TTM) revenue. Analyze their characteristics, revenue, occupancy rate, and ADR to understand what drives success in this market.
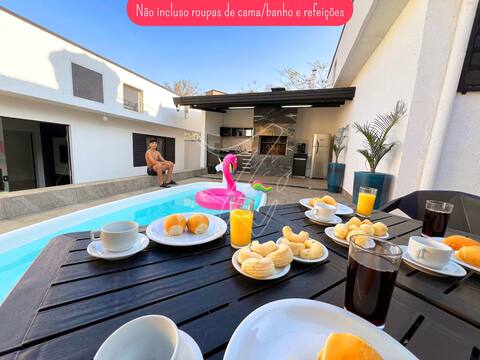
House in front of Hot Park
Entire Place • 3 bedrooms
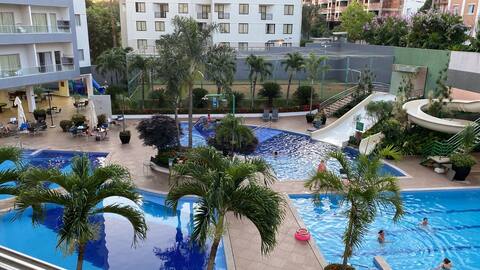
Apartment with 3 En-suites in Rio Quente - For up to 10 people
Entire Place • 3 bedrooms
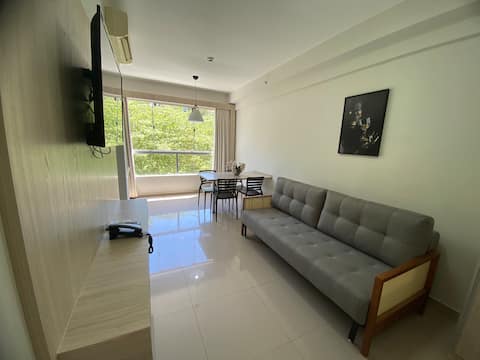
Comfortable and leisurely flat 206.
Entire Place • 1 bedroom

Apartment with 2 Suites in Rio Quente - For up to 10 people
Entire Place • 2 bedrooms

Excellent vacation home in Rio Quente/GO
Entire Place • 4 bedrooms

Nature, Pools and Thermal River – Hot Park
Entire Place • 1 bedroom
Note: Performance varies based on location, size, amenities, seasonality, and management quality. Data reflects the past 12 months.
Top Performing Airbnb Hosts in Rio Quente (2026)
Learn from the best! This table showcases top-performing Airbnb hosts in Rio Quente based on the number of properties managed and estimated total revenue over the past year. Analyze their scale and performance metrics.
| Host Name | Properties | Grossing Revenue | Stay Reviews | Avg Rating |
|---|---|---|---|---|
| William | 40 | $313,699 | 822 | 4.87/5.0 |
| Miller | 20 | $84,114 | 907 | 4.61/5.0 |
| Armênio Batista | 6 | $62,595 | 509 | 4.93/5.0 |
| Ana | 1 | $39,123 | 26 | 4.42/5.0 |
| Rodrigo | 3 | $37,385 | 863 | 4.93/5.0 |
| Iran E Samara | 6 | $34,936 | 70 | 4.86/5.0 |
| Leonardo | 11 | $34,604 | 89 | 4.58/5.0 |
| Turismo Imóveis | 2 | $31,244 | 15 | 4.53/5.0 |
| Maryvone | 5 | $28,425 | 388 | 4.76/5.0 |
| Jose Luis | 4 | $28,059 | 219 | 4.83/5.0 |
Analyzing the strategies of top hosts, such as their property selection, pricing, and guest communication, can offer valuable lessons for optimizing your own Airbnb operations in Rio Quente.
Dive Deeper: Advanced Rio Quente STR Market Data (2026)
Ready to unlock more insights? AirROI provides access to advanced metrics and comprehensive Airbnb data for Rio Quente. Explore detailed analytics beyond this report to refine your investment strategy, optimize pricing, and maximize your vacation rental profits.
Explore Advanced MetricsRio Quente Short-Term Rental Market Composition (2026): Property & Room Types
Room Type Distribution
Property Type Distribution
Market Composition Insights for Rio Quente
- The Rio Quente Airbnb market composition is heavily skewed towards Entire Home/Apt listings, which make up 96.7% of the 395 active rentals. This indicates strong guest preference for privacy and space.
- Looking at the property type distribution in Rio Quente, Apartment/Condo properties are the most common (96.5%), reflecting the local real estate landscape.
- Smaller segments like house, hotel/boutique (combined 3.6%) offer potential for unique stay experiences.
Rio Quente Airbnb Room Capacity Analysis (2026): Bedroom Distribution
Distribution of Listings by Number of Bedrooms
Room Capacity Insights for Rio Quente
- The dominant room capacity in Rio Quente is 1 bedroom listings, making up 77% of the market. This suggests a strong demand for properties suitable for couples or solo travelers.
- Together, 1 bedroom and 2 bedrooms properties represent 91.9% of the active Airbnb listings in Rio Quente, indicating a high concentration in these sizes.
- With over half the market (77%) consisting of studios or 1-bedroom units, Rio Quente is particularly well-suited for individuals or couples.
- Listings with 3+ bedrooms (5.3%) represent a smaller niche, potentially indicating an underserved market for larger group accommodations in Rio Quente.
Rio Quente Vacation Rental Guest Capacity Trends (2026)
Distribution of Listings by Guest Capacity
Guest Capacity Insights for Rio Quente
- The most common guest capacity trend in Rio Quente vacation rentals is listings accommodating 5 guests (48.6%). This suggests the primary traveler segment is likely larger groups.
- Properties designed for 5 guests and 4 guests dominate the Rio Quente STR market, accounting for 75.4% of listings.
- 20.0% of properties accommodate 6+ guests, serving the market segment for larger families or group travel in Rio Quente.
- On average, properties in Rio Quente are equipped to host 5.0 guests.
Rio Quente Airbnb Booking Patterns (2026): Available vs. Booked Days
Available Days Distribution
Booked Days Distribution
Booking Pattern Insights for Rio Quente
- The most common availability pattern in Rio Quente falls within the 271-366 days range, representing 58.2% of listings. This suggests many properties have significant open periods on their calendars.
- Approximately 90.6% of listings show high availability (181+ days open annually), indicating potential for increased bookings or specific owner usage patterns.
- For booked days, the 31-90 days range is most frequent in Rio Quente (35.2%), reflecting common guest stay durations or potential owner blocking patterns.
- A notable 10.7% of properties secure long booking periods (181+ days booked per year), highlighting successful long-term rental strategies or significant owner usage.
Rio Quente Airbnb Minimum Stay Requirements Analysis
Distribution of Listings by Minimum Night Requirement
1 Night
158 listings
40% of total
2 Nights
132 listings
33.4% of total
3 Nights
6 listings
1.5% of total
4-6 Nights
1 listings
0.3% of total
30+ Nights
98 listings
24.8% of total
Key Insights
- The most prevalent minimum stay requirement in Rio Quente is 1 Night, adopted by 40% of listings. This highlights the market's preference for shorter, flexible bookings.
- A strong majority (73.4%) of the Rio Quente Airbnb data shows acceptance of very short stays (1-2 nights), indicating a dynamic, high-turnover market.
- A significant segment (24.8%) caters to monthly stays (30+ nights) in Rio Quente, pointing to opportunities in the extended-stay market.
Recommendations
- Align with the market by considering a 1 Night minimum stay, as 40% of Rio Quente hosts use this setting.
- Explore offering discounts for stays of 30+ nights to attract the 24.8% of the market seeking extended stays.
- Adjust minimum nights based on seasonality – potentially shorter during low season and longer during peak demand periods in Rio Quente.
Rio Quente Airbnb Cancellation Policy Trends Analysis (2026)
Limited
3 listings
0.8% of total
Super Strict 30 Days
2 listings
0.5% of total
Flexible
116 listings
29.4% of total
Moderate
116 listings
29.4% of total
Firm
128 listings
32.4% of total
Strict
30 listings
7.6% of total
Cancellation Policy Insights for Rio Quente
- The prevailing Airbnb cancellation policy trend in Rio Quente is Firm, used by 32.4% of listings.
- There's a relatively balanced mix between guest-friendly (58.8%) and stricter (40.0%) policies, offering choices for different guest needs.
- Strict cancellation policies are quite rare (7.6%), potentially making listings with this policy less competitive unless justified by high demand or property type.
Recommendations for Hosts
- Consider adopting a Firm policy to align with the 32.4% market standard in Rio Quente.
- Using a Strict policy might deter some guests, as only 7.6% of listings use it. Evaluate if potential revenue protection outweighs possible lower booking rates.
- Regularly review your cancellation policy against competitors and market demand shifts in Rio Quente.
Rio Quente STR Booking Lead Time Analysis (2026)
Average Booking Lead Time by Month
Booking Lead Time Insights for Rio Quente
- The overall average booking lead time for vacation rentals in Rio Quente is 29 days.
- Guests book furthest in advance for stays during December (average 44 days), likely coinciding with peak travel demand or local events.
- The shortest booking windows occur for stays in February (average 19 days), indicating more last-minute travel plans during this time.
- Seasonally, Winter (32 days avg.) sees the longest lead times, while Summer (26 days avg.) has the shortest, reflecting typical travel planning cycles.
Recommendations for Hosts
- Use the overall average lead time (29 days) as a baseline for your pricing and availability strategy in Rio Quente.
- For December stays, consider implementing length-of-stay discounts or slightly higher rates for bookings made less than 44 days out to capitalize on advance planning.
- Target marketing efforts for the Winter season well in advance (at least 32 days) to capture early planners.
- Monitor your own booking lead times against these Rio Quente averages to identify opportunities for dynamic pricing adjustments.
Popular & Essential Airbnb Amenities in Rio Quente (2026)
Amenity Prevalence
Amenity Insights for Rio Quente
- Essential amenities in Rio Quente that guests expect include: TV, Air conditioning, Wifi. Lacking these (any) could significantly impact bookings.
- Popular amenities like Pool, Kitchen, Free parking on premises are common but not universal. Offering these can provide a competitive edge.
- A pool is a highly desired but not standard amenity, making it a key feature for attracting guests seeking leisure in Rio Quente.
Recommendations for Hosts
- Ensure your listing includes all essential amenities for Rio Quente: TV, Air conditioning, Wifi.
- Prioritize adding missing essentials: TV, Air conditioning, Wifi.
- Consider adding popular differentiators like Pool or Kitchen to increase appeal.
- Highlight unique or less common amenities you offer (e.g., hot tub, dedicated workspace, EV charger) in your listing description and photos.
- Regularly check competitor amenities in Rio Quente to stay competitive.
Rio Quente Airbnb Guest Demographics & Profile Analysis (2026)
Guest Profile Summary for Rio Quente
- The typical guest profile for Airbnb in Rio Quente consists of primarily domestic travelers (99%), often arriving from nearby Goiânia, typically belonging to the Post-2000s (Gen Z/Alpha) group (50%), primarily speaking Portuguese or English.
- Domestic travelers account for 98.5% of guests.
- Key international markets include Brazil (98.5%) and United States (0.6%).
- Top languages spoken are Portuguese (61.6%) followed by English (22.3%).
- A significant demographic segment is the Post-2000s (Gen Z/Alpha) group, representing 50% of guests.
Recommendations for Hosts
- Target domestic marketing efforts towards travelers from Goiânia and Goiás.
- Tailor amenities and listing descriptions to appeal to the dominant Post-2000s (Gen Z/Alpha) demographic (e.g., highlight fast WiFi, smart home features, local guides).
- Highlight unique local experiences or amenities relevant to the primary guest profile.
- Consider seasonal promotions aligned with peak travel times for key origin markets.
Nearby Short-Term Rental Market Comparison
How does the Rio Quente Airbnb market stack up against its neighbors? Compare key performance metrics like average monthly revenue, ADR, and occupancy rates in surrounding areas to understand the broader regional STR landscape.
| Market | Active Properties | Monthly Revenue | Daily Rate | Avg. Occupancy |
|---|---|---|---|---|
| Alexânia | 119 | $826 | $157.61 | 23% |
| Senador Canedo | 22 | $691 | $139.79 | 25% |
| Três Ranchos | 11 | $624 | $124.60 | 19% |
| Abadiânia | 30 | $621 | $106.06 | 25% |
| Santo Antônio do Descoberto | 15 | $590 | $129.95 | 22% |
| Luziânia | 20 | $588 | $120.76 | 23% |
| Bela Vista de Goiás | 19 | $494 | $134.07 | 18% |
| Hidrolândia | 17 | $472 | $181.07 | 16% |
| Caldas Novas | 2,732 | $432 | $65.63 | 32% |
| Aparecida de Goiânia | 76 | $397 | $60.21 | 36% |