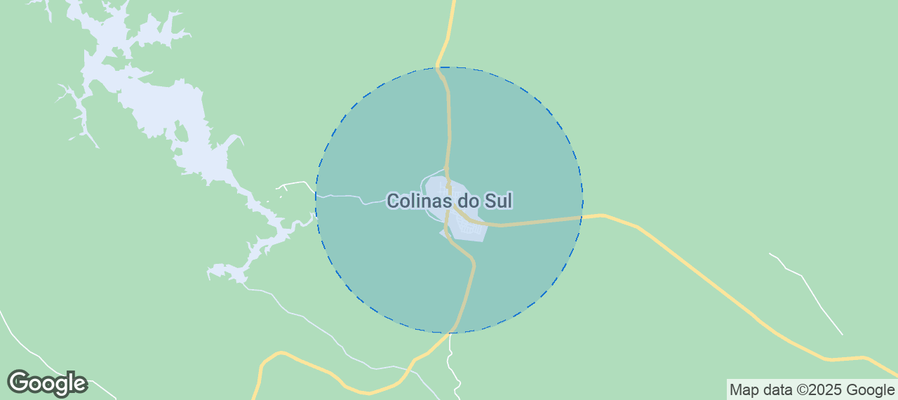
Colinas do Sul Airbnb Market Analysis 2026: Short Term Rental Data & Vacation Rental Statistics in Goiás, Brazil
Is Airbnb profitable in Colinas do Sul in 2026? Explore comprehensive Airbnb analytics for Colinas do Sul, Goiás, Brazil to uncover income potential. This 2026 STR market report for Colinas do Sul, based on AirROI data from February 2025 to January 2026, reveals key trends in the niche market of 21 active listings.
Whether you're considering an Airbnb investment in Colinas do Sul, optimizing your existing vacation rental, or exploring rental arbitrage opportunities, understanding the Colinas do Sul Airbnb data is crucial. Leveraging the low regulation environment is key to maximizing your short term rental income potential. Let's dive into the specifics.
Key Colinas do Sul Airbnb Performance Metrics Overview
Monthly Airbnb Revenue Variations & Income Potential in Colinas do Sul (2026)
Understanding the monthly revenue variations for Airbnb listings in Colinas do Sul is key to maximizing your short term rental income potential. Seasonality significantly impacts earnings. Our analysis, based on data from the past 12 months, shows that the peak revenue month for STRs in Colinas do Sul is typically November, while January often presents the lowest earnings, highlighting opportunities for strategic pricing adjustments during shoulder and low seasons. Explore the typical Airbnb income in Colinas do Sul across different performance tiers:
- Best-in-class properties (Top 10%) achieve $1,516+ monthly, often utilizing dynamic pricing and superior guest experiences.
- Strong performing properties (Top 25%) earn $237 or more, indicating effective management and desirable locations/amenities.
- Typical properties (Median) generate around $123 per month, representing the average market performance.
- Entry-level properties (Bottom 25%) see earnings around $65, often with potential for optimization.
Average Monthly Airbnb Earnings Trend in Colinas do Sul
Colinas do Sul Airbnb Occupancy Rate Trends (2026)
Maximize your bookings by understanding the Colinas do Sul STR occupancy trends. Seasonal demand shifts significantly influence how often properties are booked. Typically, Februarysees the highest demand (peak season occupancy), while January experiences the lowest (low season). Effective strategies, like adjusting minimum stays or offering promotions, can boost occupancy during slower periods. Here's how different property tiers perform in Colinas do Sul:
- Best-in-class properties (Top 10%) achieve 48%+ occupancy, indicating high desirability and potentially optimized availability.
- Strong performing properties (Top 25%) maintain 24% or higher occupancy, suggesting good market fit and guest satisfaction.
- Typical properties (Median) have an occupancy rate around 13%.
- Entry-level properties (Bottom 25%) average 9% occupancy, potentially facing higher vacancy.
Average Monthly Occupancy Rate Trend in Colinas do Sul
Average Daily Rate (ADR) Airbnb Trends in Colinas do Sul (2026)
Effective short term rental pricing strategy in Colinas do Sul involves understanding monthly ADR fluctuations. The Average Daily Rate (ADR) for Airbnb in Colinas do Sul typically peaks in December and dips lowest during February. Leveraging Airbnb dynamic pricing tools or strategies based on this seasonality can significantly boost revenue. Here's a look at the typical nightly rates achieved:
- Best-in-class properties (Top 10%) command rates of $104+ per night, often due to premium features or locations.
- Strong performing properties (Top 25%) achieve nightly rates of $47 or more.
- Typical properties (Median) charge around $34 per night.
- Entry-level properties (Bottom 25%) earn around $23 per night.
Average Daily Rate (ADR) Trend by Month in Colinas do Sul
Get Live Colinas do Sul Market Intelligence 👇
Explore Real-time Analytics
Airbnb Seasonality Analysis & Trends in Colinas do Sul (2026)
Peak Season (November, October, September)
- Revenue averages $738 per month
- Occupancy rates average 20.6%
- Daily rates average $47
Shoulder Season
- Revenue averages $448 per month
- Occupancy maintains around 22.3%
- Daily rates hold near $44
Low Season (January, March, May)
- Revenue drops to average $325 per month
- Occupancy decreases to average 16.4%
- Daily rates adjust to average $43
Seasonality Insights for Colinas do Sul
- The Airbnb seasonality in Colinas do Sul shows highly seasonal trends requiring careful strategy. While the sections above show seasonal averages, it's also insightful to look at the extremes:
- During the high season, the absolute peak month showcases Colinas do Sul's highest earning potential, with monthly revenues capable of climbing to $890, occupancy reaching a high of 27.8%, and ADRs peaking at $49.
- Conversely, the slowest single month of the year, typically falling within the low season, marks the market's lowest point. In this month, revenue might dip to $247, occupancy could drop to 11.0%, and ADRs may adjust down to $40.
- Understanding both the seasonal averages and these monthly peaks and troughs in revenue, occupancy, and ADR is crucial for maximizing your Airbnb profit potential in Colinas do Sul.
Seasonal Strategies for Maximizing Profit
- Peak Season: Maximize revenue through premium pricing and potentially longer minimum stays. Ensure high availability.
- Low Season: Offer competitive pricing, special promotions (e.g., extended stay discounts), and flexible cancellation policies. Target off-season travelers like remote workers or budget-conscious guests.
- Shoulder Seasons: Implement dynamic pricing that balances peak and low rates. Target weekend travelers or specific events. Offer slightly more flexible terms than peak season.
- Regularly analyze your own performance against these Colinas do Sul seasonality benchmarks and adjust your pricing and availability strategy accordingly.
Best Areas for Airbnb Investment in Colinas do Sul (2026)
Exploring the top neighborhoods for short-term rentals in Colinas do Sul? This section highlights key areas, outlining why they are attractive for hosts and guests, along with notable local attractions. Consider these locations based on your target guest profile and investment strategy.
| Neighborhood / Area | Why Host Here? (Target Guests & Appeal) | Key Attractions & Landmarks |
|---|---|---|
| Centro de Colinas do Sul | The central area is the heart of the town, providing easy access to local amenities and attractions. It's ideal for families and travelers looking for convenience. | Local markets, Cultural events, Restaurants and cafes, City park, Historical buildings |
| Represa do Rio do Peixe | A popular spot for outdoor enthusiasts with opportunities for fishing, boating, and camping. Attracts nature lovers and families seeking a getaway. | Fishing activities, Boating, Picnic areas, Nature trails, Camping sites |
| Praça Central | This central square is a hub for social activities and events. It attracts visitors looking for a taste of local culture and community life. | Local festivals, Art exhibits, Cafes and shops, Community games, Food stalls |
| Vale do Rio do Peixe | Known for its beautiful landscapes and tranquility, it's perfect for visitors looking to escape the hustle and bustle of urban life and enjoy nature. | Hiking trails, Scenic views, Wildlife watching, Photography spots, Stargazing opportunities |
| Cascata do Rio do Peixe | An impressive waterfall that is a major tourist attraction. Great for eco-tourism, swimming, and photography. | Waterfall trails, Swimming spots, Picnic areas, Photography opportunities, Guided tours |
| Setor Norte | An emerging residential area with a mix of local and newer developments. It offers a blend of urban and suburban living, appealing to various types of travelers. | Local dining, Shopping options, Parks and recreational spaces, Community markets, Cultural sites |
| Colinas do Sul Eco Park | An eco-friendly location offering nature-based activities and attractions. A great spot for eco-tourism and outdoor recreation. | Nature trails, Guided nature tours, Camping facilities, Biking paths, Wildlife experiences |
| Vila Jardim | A picturesque neighborhood with charming streets and local culture. Ideal for those looking for a quieter, more relaxed stay. | Artisan shops, Local cuisine, Gardens and parks, Cultural experiences, Art galleries |
Understanding Airbnb License Requirements & STR Laws in Colinas do Sul (2026)
While Colinas do Sul, Goiás, Brazil currently shows low STR regulations, specific Airbnb license requirements might still exist or change. Always verify the latest short term rental regulations and Airbnb license requirements directly with local government authorities for Colinas do Sul to ensure full compliance before hosting.
(Source: AirROI data, 2026, finding no licensed listings among those analyzed)
Top Performing Airbnb Properties in Colinas do Sul (2026)
Benchmark your potential! Explore examples of top-performing Airbnb properties in Colinas do Sulbased on Trailing Twelve Month (TTM) revenue. Analyze their characteristics, revenue, occupancy rate, and ADR to understand what drives success in this market.

Leviê • Private retreat with hot tub and view
Entire Place • 1 bedroom

Casa Aki
Entire Place • 2 bedrooms

Black Angico Cottage
Entire Place • 1 bedroom

Jasmine Cottage - Chapada dos Veadeiros
Entire Place • 2 bedrooms
Cottage Angico Preto
Entire Place • 2 bedrooms
Jade Cottage - Chapada dos Veadeiros
Entire Place • N/A
Note: Performance varies based on location, size, amenities, seasonality, and management quality. Data reflects the past 12 months.
Top Performing Airbnb Hosts in Colinas do Sul (2026)
Learn from the best! This table showcases top-performing Airbnb hosts in Colinas do Sul based on the number of properties managed and estimated total revenue over the past year. Analyze their scale and performance metrics.
| Host Name | Properties | Grossing Revenue | Stay Reviews | Avg Rating |
|---|---|---|---|---|
| Maurício Paes Leme | 1 | $43,185 | 86 | 4.98/5.0 |
| Alejandra | 3 | $4,378 | 202 | 4.72/5.0 |
| Taíssa | 3 | $3,961 | 126 | 4.75/5.0 |
| Carlos | 1 | $2,339 | 7 | 5.00/5.0 |
| Atais Aline | 2 | $1,369 | 30 | 4.92/5.0 |
| Cristiane | 3 | $1,114 | 17 | 4.92/5.0 |
| Marcim | 2 | $1,047 | 8 | 5.00/5.0 |
| Daiane Franciele Frrreira Lima | 1 | $831 | 53 | 4.77/5.0 |
| Luis Henrique | 1 | $726 | 1 | Not Rated |
| Ismael | 1 | $700 | 1 | Not Rated |
Analyzing the strategies of top hosts, such as their property selection, pricing, and guest communication, can offer valuable lessons for optimizing your own Airbnb operations in Colinas do Sul.
Dive Deeper: Advanced Colinas do Sul STR Market Data (2026)
Ready to unlock more insights? AirROI provides access to advanced metrics and comprehensive Airbnb data for Colinas do Sul. Explore detailed analytics beyond this report to refine your investment strategy, optimize pricing, and maximize your vacation rental profits.
Explore Advanced MetricsColinas do Sul Short-Term Rental Market Composition (2026): Property & Room Types
Room Type Distribution
Property Type Distribution
Market Composition Insights for Colinas do Sul
- The Colinas do Sul Airbnb market composition is heavily skewed towards Entire Home/Apt listings, which make up 95.2% of the 21 active rentals. This indicates strong guest preference for privacy and space.
- Looking at the property type distribution in Colinas do Sul, House properties are the most common (71.4%), reflecting the local real estate landscape.
- Houses represent a significant 71.4% portion, catering likely to families or larger groups.
- The presence of 9.5% Hotel/Boutique listings indicates integration with traditional hospitality.
- Smaller segments like unique stays, apartment/condo (combined 9.6%) offer potential for unique stay experiences.
Colinas do Sul Airbnb Room Capacity Analysis (2026): Bedroom Distribution
Distribution of Listings by Number of Bedrooms
Room Capacity Insights for Colinas do Sul
- The dominant room capacity in Colinas do Sul is 1 bedroom listings, making up 47.6% of the market. This suggests a strong demand for properties suitable for couples or solo travelers.
- Together, 1 bedroom and 2 bedrooms properties represent 85.7% of the active Airbnb listings in Colinas do Sul, indicating a high concentration in these sizes.
Colinas do Sul Vacation Rental Guest Capacity Trends (2026)
Distribution of Listings by Guest Capacity
Guest Capacity Insights for Colinas do Sul
- The most common guest capacity trend in Colinas do Sul vacation rentals is listings accommodating 4 guests (28.6%). This suggests the primary traveler segment is likely small families or groups.
- Properties designed for 4 guests and 2 guests dominate the Colinas do Sul STR market, accounting for 47.6% of listings.
- 23.8% of properties accommodate 6+ guests, serving the market segment for larger families or group travel in Colinas do Sul.
- On average, properties in Colinas do Sul are equipped to host 4.0 guests.
Colinas do Sul Airbnb Booking Patterns (2026): Available vs. Booked Days
Available Days Distribution
Booked Days Distribution
Booking Pattern Insights for Colinas do Sul
- The most common availability pattern in Colinas do Sul falls within the 271-366 days range, representing 95.2% of listings. This suggests many properties have significant open periods on their calendars.
- Approximately 95.2% of listings show high availability (181+ days open annually), indicating potential for increased bookings or specific owner usage patterns.
- For booked days, the 1-30 days range is most frequent in Colinas do Sul (52.4%), reflecting common guest stay durations or potential owner blocking patterns.
- A notable 4.8% of properties secure long booking periods (181+ days booked per year), highlighting successful long-term rental strategies or significant owner usage.
Colinas do Sul Airbnb Minimum Stay Requirements Analysis
Distribution of Listings by Minimum Night Requirement
1 Night
7 listings
33.3% of total
2 Nights
13 listings
61.9% of total
30+ Nights
1 listings
4.8% of total
Key Insights
- The most prevalent minimum stay requirement in Colinas do Sul is 2 Nights, adopted by 61.9% of listings. This highlights the market's preference for shorter, flexible bookings.
- A strong majority (95.2%) of the Colinas do Sul Airbnb data shows acceptance of very short stays (1-2 nights), indicating a dynamic, high-turnover market.
Recommendations
- Align with the market by considering a 2 Nights minimum stay, as 61.9% of Colinas do Sul hosts use this setting.
- Adjust minimum nights based on seasonality – potentially shorter during low season and longer during peak demand periods in Colinas do Sul.
Colinas do Sul Airbnb Cancellation Policy Trends Analysis (2026)
Flexible
5 listings
23.8% of total
Moderate
6 listings
28.6% of total
Firm
6 listings
28.6% of total
Strict
4 listings
19% of total
Cancellation Policy Insights for Colinas do Sul
- The prevailing Airbnb cancellation policy trend in Colinas do Sul is Moderate, used by 28.6% of listings.
- There's a relatively balanced mix between guest-friendly (52.4%) and stricter (47.6%) policies, offering choices for different guest needs.
Recommendations for Hosts
- Consider adopting a Moderate policy to align with the 28.6% market standard in Colinas do Sul.
- Regularly review your cancellation policy against competitors and market demand shifts in Colinas do Sul.
Colinas do Sul STR Booking Lead Time Analysis (2026)
Average Booking Lead Time by Month
Booking Lead Time Insights for Colinas do Sul
- The overall average booking lead time for vacation rentals in Colinas do Sul is 27 days.
- Guests book furthest in advance for stays during November (average 66 days), likely coinciding with peak travel demand or local events.
- The shortest booking windows occur for stays in February (average 11 days), indicating more last-minute travel plans during this time.
- Seasonally, Fall (33 days avg.) sees the longest lead times, while Winter (20 days avg.) has the shortest, reflecting typical travel planning cycles.
Recommendations for Hosts
- Use the overall average lead time (27 days) as a baseline for your pricing and availability strategy in Colinas do Sul.
- For November stays, consider implementing length-of-stay discounts or slightly higher rates for bookings made less than 66 days out to capitalize on advance planning.
- During February, focus on last-minute booking availability and promotions, as guests book with very short notice (11 days avg.).
- Target marketing efforts for the Fall season well in advance (at least 33 days) to capture early planners.
- Monitor your own booking lead times against these Colinas do Sul averages to identify opportunities for dynamic pricing adjustments.
Popular & Essential Airbnb Amenities in Colinas do Sul (2026)
Amenity Prevalence
Amenity Insights for Colinas do Sul
- Essential amenities in Colinas do Sul that guests expect include: Wifi. Lacking these (this) could significantly impact bookings.
- Popular amenities like Free parking on premises, Dishes and silverware, Kitchen are common but not universal. Offering these can provide a competitive edge.
Recommendations for Hosts
- Ensure your listing includes all essential amenities for Colinas do Sul: Wifi.
- Prioritize adding missing essentials: Wifi.
- Consider adding popular differentiators like Free parking on premises or Dishes and silverware to increase appeal.
- Highlight unique or less common amenities you offer (e.g., hot tub, dedicated workspace, EV charger) in your listing description and photos.
- Regularly check competitor amenities in Colinas do Sul to stay competitive.
Colinas do Sul Airbnb Guest Demographics & Profile Analysis (2026)
Guest Profile Summary for Colinas do Sul
- The typical guest profile for Airbnb in Colinas do Sul consists of primarily domestic travelers (95%), often arriving from nearby Brasilia, typically belonging to the Post-2000s (Gen Z/Alpha) group (50%), primarily speaking Portuguese or English.
- Domestic travelers account for 95.3% of guests.
- Key international markets include Brazil (95.3%) and New Zealand (2.3%).
- Top languages spoken are Portuguese (39.5%) followed by English (28.9%).
- A significant demographic segment is the Post-2000s (Gen Z/Alpha) group, representing 50% of guests.
Recommendations for Hosts
- Target domestic marketing efforts towards travelers from Brasilia and Brasília.
- Tailor amenities and listing descriptions to appeal to the dominant Post-2000s (Gen Z/Alpha) demographic (e.g., highlight fast WiFi, smart home features, local guides).
- Highlight unique local experiences or amenities relevant to the primary guest profile.
- Consider seasonal promotions aligned with peak travel times for key origin markets.
Nearby Short-Term Rental Market Comparison
How does the Colinas do Sul Airbnb market stack up against its neighbors? Compare key performance metrics like average monthly revenue, ADR, and occupancy rates in surrounding areas to understand the broader regional STR landscape.
| Market | Active Properties | Monthly Revenue | Daily Rate | Avg. Occupancy |
|---|---|---|---|---|
| Paranoá | 40 | $1,283 | $123.23 | 40% |
| Jardim Botânico | 56 | $994 | $105.50 | 39% |
| Pirenópolis | 1,571 | $848 | $122.51 | 28% |
| Santa Maria | 15 | $758 | $146.58 | 23% |
| Park Way | 25 | $751 | $91.48 | 28% |
| Ceilândia | 20 | $746 | $92.42 | 42% |
| Planaltina | 19 | $672 | $116.12 | 31% |
| Plano Piloto | 2,448 | $671 | $62.73 | 46% |
| Sobradinho | 80 | $661 | $103.99 | 33% |
| São Sebastião | 51 | $651 | $83.71 | 32% |