Caldas Novas Airbnb Market Analysis 2026: Short Term Rental Data & Vacation Rental Statistics in Goiás, Brazil
Is Airbnb profitable in Caldas Novas in 2026? Explore comprehensive Airbnb analytics for Caldas Novas, Goiás, Brazil to uncover income potential. This 2026 STR market report for Caldas Novas, based on AirROI data from February 2025 to January 2026, reveals key trends in the bustling market of 2,732 active listings.
Whether you're considering an Airbnb investment in Caldas Novas, optimizing your existing vacation rental, or exploring rental arbitrage opportunities, understanding the Caldas Novas Airbnb data is crucial. Leveraging the low regulation environment is key to maximizing your short term rental income potential. Let's dive into the specifics.
Key Caldas Novas Airbnb Performance Metrics Overview
Monthly Airbnb Revenue Variations & Income Potential in Caldas Novas (2026)
Understanding the monthly revenue variations for Airbnb listings in Caldas Novas is key to maximizing your short term rental income potential. Seasonality significantly impacts earnings. Our analysis, based on data from the past 12 months, shows that the peak revenue month for STRs in Caldas Novas is typically July, while February often presents the lowest earnings, highlighting opportunities for strategic pricing adjustments during shoulder and low seasons. Explore the typical Airbnb income in Caldas Novas across different performance tiers:
- Best-in-class properties (Top 10%) achieve $1,392+ monthly, often utilizing dynamic pricing and superior guest experiences.
- Strong performing properties (Top 25%) earn $846 or more, indicating effective management and desirable locations/amenities.
- Typical properties (Median) generate around $444 per month, representing the average market performance.
- Entry-level properties (Bottom 25%) see earnings around $213, often with potential for optimization.
Average Monthly Airbnb Earnings Trend in Caldas Novas
Caldas Novas Airbnb Occupancy Rate Trends (2026)
Maximize your bookings by understanding the Caldas Novas STR occupancy trends. Seasonal demand shifts significantly influence how often properties are booked. Typically, Julysees the highest demand (peak season occupancy), while April experiences the lowest (low season). Effective strategies, like adjusting minimum stays or offering promotions, can boost occupancy during slower periods. Here's how different property tiers perform in Caldas Novas:
- Best-in-class properties (Top 10%) achieve 74%+ occupancy, indicating high desirability and potentially optimized availability.
- Strong performing properties (Top 25%) maintain 49% or higher occupancy, suggesting good market fit and guest satisfaction.
- Typical properties (Median) have an occupancy rate around 27%.
- Entry-level properties (Bottom 25%) average 13% occupancy, potentially facing higher vacancy.
Average Monthly Occupancy Rate Trend in Caldas Novas
Average Daily Rate (ADR) Airbnb Trends in Caldas Novas (2026)
Effective short term rental pricing strategy in Caldas Novas involves understanding monthly ADR fluctuations. The Average Daily Rate (ADR) for Airbnb in Caldas Novas typically peaks in January and dips lowest during September. Leveraging Airbnb dynamic pricing tools or strategies based on this seasonality can significantly boost revenue. Here's a look at the typical nightly rates achieved:
- Best-in-class properties (Top 10%) command rates of $111+ per night, often due to premium features or locations.
- Strong performing properties (Top 25%) achieve nightly rates of $75 or more.
- Typical properties (Median) charge around $52 per night.
- Entry-level properties (Bottom 25%) earn around $38 per night.
Average Daily Rate (ADR) Trend by Month in Caldas Novas
Get Live Caldas Novas Market Intelligence 👇

Explore Real-time Analytics
Airbnb Seasonality Analysis & Trends in Caldas Novas (2026)
Peak Season (July, December, January)
- Revenue averages $883 per month
- Occupancy rates average 37.6%
- Daily rates average $77
Shoulder Season
- Revenue averages $628 per month
- Occupancy maintains around 33.4%
- Daily rates hold near $68
Low Season (February, April, May)
- Revenue drops to average $530 per month
- Occupancy decreases to average 30.3%
- Daily rates adjust to average $68
Seasonality Insights for Caldas Novas
- The Airbnb seasonality in Caldas Novas shows highly seasonal trends requiring careful strategy. While the sections above show seasonal averages, it's also insightful to look at the extremes:
- During the high season, the absolute peak month showcases Caldas Novas's highest earning potential, with monthly revenues capable of climbing to $997, occupancy reaching a high of 46.8%, and ADRs peaking at $79.
- Conversely, the slowest single month of the year, typically falling within the low season, marks the market's lowest point. In this month, revenue might dip to $526, occupancy could drop to 29.5%, and ADRs may adjust down to $66.
- Understanding both the seasonal averages and these monthly peaks and troughs in revenue, occupancy, and ADR is crucial for maximizing your Airbnb profit potential in Caldas Novas.
Seasonal Strategies for Maximizing Profit
- Peak Season: Maximize revenue through premium pricing and potentially longer minimum stays. Ensure high availability.
- Low Season: Offer competitive pricing, special promotions (e.g., extended stay discounts), and flexible cancellation policies. Target off-season travelers like remote workers or budget-conscious guests.
- Shoulder Seasons: Implement dynamic pricing that balances peak and low rates. Target weekend travelers or specific events. Offer slightly more flexible terms than peak season.
- Regularly analyze your own performance against these Caldas Novas seasonality benchmarks and adjust your pricing and availability strategy accordingly.
Best Areas for Airbnb Investment in Caldas Novas (2026)
Exploring the top neighborhoods for short-term rentals in Caldas Novas? This section highlights key areas, outlining why they are attractive for hosts and guests, along with notable local attractions. Consider these locations based on your target guest profile and investment strategy.
| Neighborhood / Area | Why Host Here? (Target Guests & Appeal) | Key Attractions & Landmarks |
|---|---|---|
| Water Park District | Caldas Novas is famous for its water parks, making this area highly sought after for families and tourists looking for entertainment and relaxation. | Acqua Park Di Roma, Caldas Novas Water Park, Jardim Japonês, Serra de Caldas State Park, Nautical Park |
| Central Caldas Novas | The central area provides easy access to markets, restaurants, and is close to major attractions, making it ideal for guests looking for convenience. | Liberdade Square, Caldas Novas Shopping, Museu de Cera, Cultural Center, Parque Estadual da Serra de Caldas |
| Hot Springs Area | Known for its natural hot springs, this area attracts visitors looking for wellness and relaxation. It's ideal for accommodations focused on spa and wellness. | Termas di Roma, Hot Park, Caldas Novas Thermal Water |
| Lagos do Sul | This area features beautiful lakes and resorts, perfect for buyers looking to invest in properties with scenic views and leisure opportunities. | Lagoa Thermas Parque, Park das Águas Quentes, Waterfall Park |
| Jardins Planalto | A residential area that is growing in popularity due to new developments and amenities, attracting both families and tourists seeking a more laid-back environment. | Shopping Jardins Planalto, Nearby malls, Cultural events, Local parks |
| Campeche | A serene neighborhood with a mix of residential and vacation properties, ideal for travelers seeking peace while still being close to the main attractions of Caldas Novas. | Caldas Novas Fair, Local restaurants, Natural parks, Community events |
| Pontal do Sul | This area is known for its expansive green areas and is becoming a hotspot for eco-tourism, appealing to nature lovers and those looking for outdoor activities. | Adventure parks, Ecological trails, Natural swimming pools |
| Parque das Fontes | A tourist favorite because of the numerous water sources and pools, making it a lucrative spot for hosting Airbnb properties focused on family vacations. | Fontes do Lagoa Quente, Thermal pools, Playgrounds for kids |
Understanding Airbnb License Requirements & STR Laws in Caldas Novas (2026)
While Caldas Novas, Goiás, Brazil currently shows low STR regulations, specific Airbnb license requirements might still exist or change. Always verify the latest short term rental regulations and Airbnb license requirements directly with local government authorities for Caldas Novas to ensure full compliance before hosting.
(Source: AirROI data, 2026, based on 0% licensed listings)
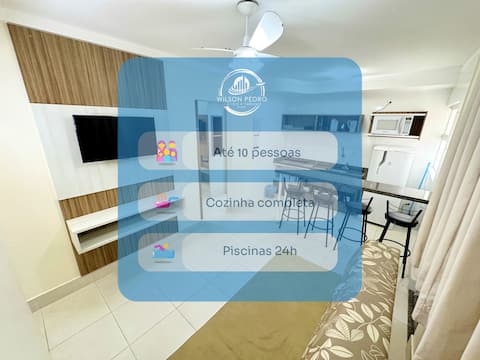
Top Performing Airbnb Properties in Caldas Novas (2026)
Benchmark your potential! Explore examples of top-performing Airbnb properties in Caldas Novasbased on Trailing Twelve Month (TTM) revenue. Analyze their characteristics, revenue, occupancy rate, and ADR to understand what drives success in this market.
Excellent apartment-Ilhas do Lago Caldas Nova
Entire Place • 1 bedroom

Spazzio di Roma with Acqua Park Water Park
Private Room • 1 bedroom

Lake Islands ct6 - a paradise in Caldas Novas
Entire Place • 1 bedroom

Spazio di Roma Including Acqua Park Water Park
Private Room • 1 bedroom

Spazio di Roma Including Acqua Park Water Park
Private Room • 1 bedroom
Lacqua diRoma I - Apto. 097
Entire Place • 3 bedrooms
Note: Performance varies based on location, size, amenities, seasonality, and management quality. Data reflects the past 12 months.
Top Performing Airbnb Hosts in Caldas Novas (2026)
Learn from the best! This table showcases top-performing Airbnb hosts in Caldas Novas based on the number of properties managed and estimated total revenue over the past year. Analyze their scale and performance metrics.
| Host Name | Properties | Grossing Revenue | Stay Reviews | Avg Rating |
|---|---|---|---|---|
| Wilson Pedro Imóveis E Turismo | 108 | $1,162,080 | 1300 | 4.83/5.0 |
| Só Casas Temporada | 25 | $466,395 | 223 | 4.56/5.0 |
| Ricardo | 40 | $351,166 | 4019 | 4.85/5.0 |
| Christiane | 1 | $280,061 | 9 | 4.89/5.0 |
| Elaine | 3 | $228,573 | 86 | 4.74/5.0 |
| Thiago | 16 | $214,414 | 3083 | 4.91/5.0 |
| Jc Temporada | 39 | $185,882 | 133 | 4.56/5.0 |
| Cleomar Francisco | 28 | $184,618 | 83 | 4.78/5.0 |
| DVtemporada | 21 | $176,764 | 662 | 4.77/5.0 |
| Inova Prime | 52 | $162,112 | 617 | 4.62/5.0 |
Analyzing the strategies of top hosts, such as their property selection, pricing, and guest communication, can offer valuable lessons for optimizing your own Airbnb operations in Caldas Novas.
Dive Deeper: Advanced Caldas Novas STR Market Data (2026)
Ready to unlock more insights? AirROI provides access to advanced metrics and comprehensive Airbnb data for Caldas Novas. Explore detailed analytics beyond this report to refine your investment strategy, optimize pricing, and maximize your vacation rental profits.
Explore Advanced MetricsCaldas Novas Short-Term Rental Market Composition (2026): Property & Room Types
Room Type Distribution
Property Type Distribution
Market Composition Insights for Caldas Novas
- The Caldas Novas Airbnb market composition is heavily skewed towards Entire Home/Apt listings, which make up 88.4% of the 2,732 active rentals. This indicates strong guest preference for privacy and space.
- Looking at the property type distribution in Caldas Novas, Apartment/Condo properties are the most common (85.9%), reflecting the local real estate landscape.
- The presence of 5.5% Hotel/Boutique listings indicates integration with traditional hospitality.
- Smaller segments like outdoor/unique, others (combined 0.4%) offer potential for unique stay experiences.
Caldas Novas Airbnb Room Capacity Analysis (2026): Bedroom Distribution
Distribution of Listings by Number of Bedrooms
Room Capacity Insights for Caldas Novas
- The dominant room capacity in Caldas Novas is 1 bedroom listings, making up 58.7% of the market. This suggests a strong demand for properties suitable for couples or solo travelers.
- Together, 1 bedroom and 2 bedrooms properties represent 87.3% of the active Airbnb listings in Caldas Novas, indicating a high concentration in these sizes.
- With over half the market (58.7%) consisting of studios or 1-bedroom units, Caldas Novas is particularly well-suited for individuals or couples.
- Listings with 3+ bedrooms (8.8%) represent a smaller niche, potentially indicating an underserved market for larger group accommodations in Caldas Novas.
Caldas Novas Vacation Rental Guest Capacity Trends (2026)
Distribution of Listings by Guest Capacity
Guest Capacity Insights for Caldas Novas
- The most common guest capacity trend in Caldas Novas vacation rentals is listings accommodating 5 guests (37.8%). This suggests the primary traveler segment is likely larger groups.
- Properties designed for 5 guests and 4 guests dominate the Caldas Novas STR market, accounting for 60.1% of listings.
- 35.0% of properties accommodate 6+ guests, serving the market segment for larger families or group travel in Caldas Novas.
- On average, properties in Caldas Novas are equipped to host 5.3 guests.
Caldas Novas Airbnb Booking Patterns (2026): Available vs. Booked Days
Available Days Distribution
Booked Days Distribution
Booking Pattern Insights for Caldas Novas
- The most common availability pattern in Caldas Novas falls within the 271-366 days range, representing 67.1% of listings. This suggests many properties have significant open periods on their calendars.
- Approximately 89.9% of listings show high availability (181+ days open annually), indicating potential for increased bookings or specific owner usage patterns.
- For booked days, the 31-90 days range is most frequent in Caldas Novas (36.9%), reflecting common guest stay durations or potential owner blocking patterns.
- A notable 11.1% of properties secure long booking periods (181+ days booked per year), highlighting successful long-term rental strategies or significant owner usage.
Caldas Novas Airbnb Minimum Stay Requirements Analysis
Distribution of Listings by Minimum Night Requirement
1 Night
1008 listings
36.9% of total
2 Nights
793 listings
29% of total
3 Nights
143 listings
5.2% of total
4-6 Nights
51 listings
1.9% of total
7-29 Nights
11 listings
0.4% of total
30+ Nights
726 listings
26.6% of total
Key Insights
- The most prevalent minimum stay requirement in Caldas Novas is 1 Night, adopted by 36.9% of listings. This highlights the market's preference for shorter, flexible bookings.
- A strong majority (65.9%) of the Caldas Novas Airbnb data shows acceptance of very short stays (1-2 nights), indicating a dynamic, high-turnover market.
- A significant segment (26.6%) caters to monthly stays (30+ nights) in Caldas Novas, pointing to opportunities in the extended-stay market.
Recommendations
- Align with the market by considering a 1 Night minimum stay, as 36.9% of Caldas Novas hosts use this setting.
- Explore offering discounts for stays of 30+ nights to attract the 26.6% of the market seeking extended stays.
- Adjust minimum nights based on seasonality – potentially shorter during low season and longer during peak demand periods in Caldas Novas.
Caldas Novas Airbnb Cancellation Policy Trends Analysis (2026)
Limited
36 listings
1.3% of total
Super Strict 60 Days
3 listings
0.1% of total
Super Strict 30 Days
72 listings
2.6% of total
Flexible
771 listings
28.3% of total
Moderate
606 listings
22.3% of total
Firm
876 listings
32.2% of total
Strict
358 listings
13.2% of total
Cancellation Policy Insights for Caldas Novas
- The prevailing Airbnb cancellation policy trend in Caldas Novas is Firm, used by 32.2% of listings.
- There's a relatively balanced mix between guest-friendly (50.6%) and stricter (45.4%) policies, offering choices for different guest needs.
Recommendations for Hosts
- Consider adopting a Firm policy to align with the 32.2% market standard in Caldas Novas.
- Using a Strict policy might deter some guests, as only 13.2% of listings use it. Evaluate if potential revenue protection outweighs possible lower booking rates.
- Regularly review your cancellation policy against competitors and market demand shifts in Caldas Novas.
Caldas Novas STR Booking Lead Time Analysis (2026)
Average Booking Lead Time by Month
Booking Lead Time Insights for Caldas Novas
- The overall average booking lead time for vacation rentals in Caldas Novas is 46 days.
- Guests book furthest in advance for stays during November (average 57 days), likely coinciding with peak travel demand or local events.
- The shortest booking windows occur for stays in February (average 27 days), indicating more last-minute travel plans during this time.
- Seasonally, Fall (44 days avg.) sees the longest lead times, while Spring (35 days avg.) has the shortest, reflecting typical travel planning cycles.
Recommendations for Hosts
- Use the overall average lead time (46 days) as a baseline for your pricing and availability strategy in Caldas Novas.
- For November stays, consider implementing length-of-stay discounts or slightly higher rates for bookings made less than 57 days out to capitalize on advance planning.
- Target marketing efforts for the Fall season well in advance (at least 44 days) to capture early planners.
- Monitor your own booking lead times against these Caldas Novas averages to identify opportunities for dynamic pricing adjustments.
Popular & Essential Airbnb Amenities in Caldas Novas (2026)
Amenity Prevalence
Amenity Insights for Caldas Novas
- Essential amenities in Caldas Novas that guests expect include: TV. Lacking these (this) could significantly impact bookings.
- Popular amenities like Air conditioning, Pool, Free parking on premises are common but not universal. Offering these can provide a competitive edge.
- A pool is a highly desired but not standard amenity, making it a key feature for attracting guests seeking leisure in Caldas Novas.
- Warning: Wifi is not universally provided but is considered essential globally. Ensure reliable Wifi is offered.
Recommendations for Hosts
- Ensure your listing includes all essential amenities for Caldas Novas: TV.
- Prioritize adding missing essentials: TV.
- Consider adding popular differentiators like Air conditioning or Pool to increase appeal.
- Highlight unique or less common amenities you offer (e.g., hot tub, dedicated workspace, EV charger) in your listing description and photos.
- Regularly check competitor amenities in Caldas Novas to stay competitive.
Caldas Novas Airbnb Guest Demographics & Profile Analysis (2026)
Guest Profile Summary for Caldas Novas
- The typical guest profile for Airbnb in Caldas Novas consists of primarily domestic travelers (98%), often arriving from nearby Goiânia, typically belonging to the Post-2000s (Gen Z/Alpha) group (50%), primarily speaking Portuguese or English.
- Domestic travelers account for 98.4% of guests.
- Key international markets include Brazil (98.4%) and United States (0.5%).
- Top languages spoken are Portuguese (65.3%) followed by English (20.4%).
- A significant demographic segment is the Post-2000s (Gen Z/Alpha) group, representing 50% of guests.
Recommendations for Hosts
- Target domestic marketing efforts towards travelers from Goiânia and Brasília.
- Tailor amenities and listing descriptions to appeal to the dominant Post-2000s (Gen Z/Alpha) demographic (e.g., highlight fast WiFi, smart home features, local guides).
- Highlight unique local experiences or amenities relevant to the primary guest profile.
- Consider seasonal promotions aligned with peak travel times for key origin markets.
Nearby Short-Term Rental Market Comparison
How does the Caldas Novas Airbnb market stack up against its neighbors? Compare key performance metrics like average monthly revenue, ADR, and occupancy rates in surrounding areas to understand the broader regional STR landscape.
| Market | Active Properties | Monthly Revenue | Daily Rate | Avg. Occupancy |
|---|---|---|---|---|
| Alexânia | 119 | $826 | $157.61 | 23% |
| Senador Canedo | 22 | $691 | $139.79 | 25% |
| Três Ranchos | 11 | $624 | $124.60 | 19% |
| Abadiânia | 30 | $621 | $106.06 | 25% |
| Santo Antônio do Descoberto | 15 | $590 | $129.95 | 22% |
| Luziânia | 20 | $588 | $120.76 | 23% |
| Bela Vista de Goiás | 19 | $494 | $134.07 | 18% |
| Hidrolândia | 17 | $472 | $181.07 | 16% |
| Rio Quente | 395 | $449 | $62.90 | 29% |
| Aparecida de Goiânia | 76 | $397 | $60.21 | 36% |