Alto Paraíso de Goiás Airbnb Market Analysis 2026: Short Term Rental Data & Vacation Rental Statistics in Goiás, Brazil
Is Airbnb profitable in Alto Paraíso de Goiás in 2026? Explore comprehensive Airbnb analytics for Alto Paraíso de Goiás, Goiás, Brazil to uncover income potential. This 2026 STR market report for Alto Paraíso de Goiás, based on AirROI data from February 2025 to January 2026, reveals key trends in the bustling market of 1,323 active listings.
Whether you're considering an Airbnb investment in Alto Paraíso de Goiás, optimizing your existing vacation rental, or exploring rental arbitrage opportunities, understanding the Alto Paraíso de Goiás Airbnb data is crucial. Leveraging the low regulation environment is key to maximizing your short term rental income potential. Let's dive into the specifics.
Key Alto Paraíso de Goiás Airbnb Performance Metrics Overview
Monthly Airbnb Revenue Variations & Income Potential in Alto Paraíso de Goiás (2026)
Understanding the monthly revenue variations for Airbnb listings in Alto Paraíso de Goiás is key to maximizing your short term rental income potential. Seasonality significantly impacts earnings. Our analysis, based on data from the past 12 months, shows that the peak revenue month for STRs in Alto Paraíso de Goiás is typically July, while February often presents the lowest earnings, highlighting opportunities for strategic pricing adjustments during shoulder and low seasons. Explore the typical Airbnb income in Alto Paraíso de Goiás across different performance tiers:
- Best-in-class properties (Top 10%) achieve $2,107+ monthly, often utilizing dynamic pricing and superior guest experiences.
- Strong performing properties (Top 25%) earn $1,114 or more, indicating effective management and desirable locations/amenities.
- Typical properties (Median) generate around $542 per month, representing the average market performance.
- Entry-level properties (Bottom 25%) see earnings around $242, often with potential for optimization.
Average Monthly Airbnb Earnings Trend in Alto Paraíso de Goiás
Alto Paraíso de Goiás Airbnb Occupancy Rate Trends (2026)
Maximize your bookings by understanding the Alto Paraíso de Goiás STR occupancy trends. Seasonal demand shifts significantly influence how often properties are booked. Typically, Julysees the highest demand (peak season occupancy), while January experiences the lowest (low season). Effective strategies, like adjusting minimum stays or offering promotions, can boost occupancy during slower periods. Here's how different property tiers perform in Alto Paraíso de Goiás:
- Best-in-class properties (Top 10%) achieve 68%+ occupancy, indicating high desirability and potentially optimized availability.
- Strong performing properties (Top 25%) maintain 48% or higher occupancy, suggesting good market fit and guest satisfaction.
- Typical properties (Median) have an occupancy rate around 26%.
- Entry-level properties (Bottom 25%) average 13% occupancy, potentially facing higher vacancy.
Average Monthly Occupancy Rate Trend in Alto Paraíso de Goiás
Average Daily Rate (ADR) Airbnb Trends in Alto Paraíso de Goiás (2026)
Effective short term rental pricing strategy in Alto Paraíso de Goiás involves understanding monthly ADR fluctuations. The Average Daily Rate (ADR) for Airbnb in Alto Paraíso de Goiás typically peaks in December and dips lowest during February. Leveraging Airbnb dynamic pricing tools or strategies based on this seasonality can significantly boost revenue. Here's a look at the typical nightly rates achieved:
- Best-in-class properties (Top 10%) command rates of $154+ per night, often due to premium features or locations.
- Strong performing properties (Top 25%) achieve nightly rates of $100 or more.
- Typical properties (Median) charge around $62 per night.
- Entry-level properties (Bottom 25%) earn around $40 per night.
Average Daily Rate (ADR) Trend by Month in Alto Paraíso de Goiás
Get Live Alto Paraíso de Goiás Market Intelligence 👇

Explore Real-time Analytics
Airbnb Seasonality Analysis & Trends in Alto Paraíso de Goiás (2026)
Peak Season (July, September, August)
- Revenue averages $1,102 per month
- Occupancy rates average 39.0%
- Daily rates average $84
Shoulder Season
- Revenue averages $874 per month
- Occupancy maintains around 31.6%
- Daily rates hold near $82
Low Season (January, February, November)
- Revenue drops to average $731 per month
- Occupancy decreases to average 26.5%
- Daily rates adjust to average $84
Seasonality Insights for Alto Paraíso de Goiás
- The Airbnb seasonality in Alto Paraíso de Goiás shows highly seasonal trends requiring careful strategy. While the sections above show seasonal averages, it's also insightful to look at the extremes:
- During the high season, the absolute peak month showcases Alto Paraíso de Goiás's highest earning potential, with monthly revenues capable of climbing to $1,318, occupancy reaching a high of 44.0%, and ADRs peaking at $94.
- Conversely, the slowest single month of the year, typically falling within the low season, marks the market's lowest point. In this month, revenue might dip to $618, occupancy could drop to 24.6%, and ADRs may adjust down to $74.
- Understanding both the seasonal averages and these monthly peaks and troughs in revenue, occupancy, and ADR is crucial for maximizing your Airbnb profit potential in Alto Paraíso de Goiás.
Seasonal Strategies for Maximizing Profit
- Peak Season: Maximize revenue through premium pricing and potentially longer minimum stays. Ensure high availability.
- Low Season: Offer competitive pricing, special promotions (e.g., extended stay discounts), and flexible cancellation policies. Target off-season travelers like remote workers or budget-conscious guests.
- Shoulder Seasons: Implement dynamic pricing that balances peak and low rates. Target weekend travelers or specific events. Offer slightly more flexible terms than peak season.
- Regularly analyze your own performance against these Alto Paraíso de Goiás seasonality benchmarks and adjust your pricing and availability strategy accordingly.
Best Areas for Airbnb Investment in Alto Paraíso de Goiás (2026)
Exploring the top neighborhoods for short-term rentals in Alto Paraíso de Goiás? This section highlights key areas, outlining why they are attractive for hosts and guests, along with notable local attractions. Consider these locations based on your target guest profile and investment strategy.
| Neighborhood / Area | Why Host Here? (Target Guests & Appeal) | Key Attractions & Landmarks |
|---|---|---|
| Centro | The main downtown area of Alto Paraíso, offering easy access to local amenities, shops, and restaurants. It's the perfect base for exploring the surrounding nature and attractions. | Local shops, Restaurants, Cultural events, Nearby bus station, Historical sites |
| Chapada dos Veadeiros National Park | This stunning national park attracts tourists for its breathtaking landscapes, waterfalls, and hiking trails. Ideal for eco-tourism and nature lovers. | Catarata dos Couros, Vale da Lua, Almécegas Falls, Hiking trails, Wildlife |
| Vila de São Jorge | A charming village that serves as a gateway to the national park, known for its rustic charm and community vibe. Attracts visitors for its artisan shops and local culture. | Artisan shops, Local cafes, Cultural festivals, Proximity to national park |
| Pousadas District | A district filled with various inns and guesthouses, catering to tourists looking for a cozy stay. Strong appeal to vacationers wishing for a relaxing getaway. | Pousadas and hostels, Nature-inspired accommodations, Community interactions |
| Praia do Sono | A beautiful beach area that is popular among tourists looking for a tranquil and scenic environment. Great for those seeking relaxation and nature. | Natural beauty, Swimming and relaxing, Camping options, Wildlife observation |
| Jardim de Maytreia | An established spiritual and wellness center that draws visitors interested in meditation and wellness retreats. Unique destination for holistic tourism. | Meditation spaces, Wellness workshops, Nature trails, Retreat events |
| Serra do Fogo | A scenic mountain area that is ideal for adventure tourism, including hiking and exploring nature. Attracts those seeking outdoor activities and stunning views. | Hiking routes, Panoramic views, Mountain biking, Wild nature |
| Cachoeira do Segredo | Noted for its stunning waterfall and natural beauty, this area is great for those looking to escape into nature. Attracts visitors for swimming and picnicking. | Waterfall, Swimming spots, Picnic areas, Wildflowers |
Understanding Airbnb License Requirements & STR Laws in Alto Paraíso de Goiás (2026)
While Alto Paraíso de Goiás, Goiás, Brazil currently shows low STR regulations, specific Airbnb license requirements might still exist or change. Always verify the latest short term rental regulations and Airbnb license requirements directly with local government authorities for Alto Paraíso de Goiás to ensure full compliance before hosting.
(Source: AirROI data, 2026, based on 0% licensed listings)
Top Performing Airbnb Properties in Alto Paraíso de Goiás (2026)
Benchmark your potential! Explore examples of top-performing Airbnb properties in Alto Paraíso de Goiásbased on Trailing Twelve Month (TTM) revenue. Analyze their characteristics, revenue, occupancy rate, and ADR to understand what drives success in this market.
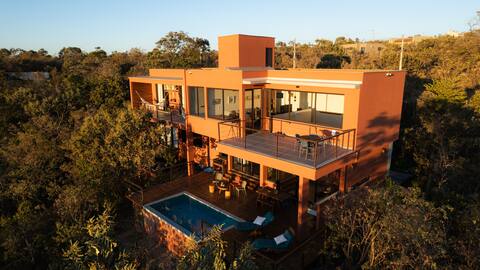
Amanhecer House - Pool, Privacy & View
Entire Place • 3 bedrooms

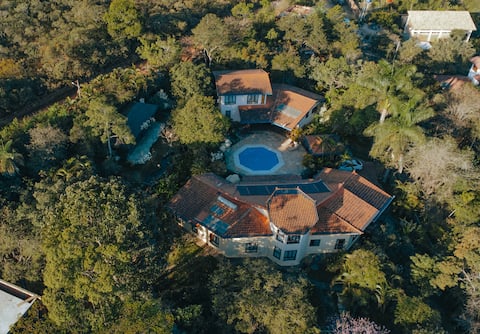
Estância Boa Vista - Entire home in Chapada
Entire Place • 6 bedrooms

Palipalan House and Chalet • Spectacular View and River •
Entire Place • 6 bedrooms
Houses 1 and 2 - Swimming Pool, Gourmet Area, Hydro, Sauna
Entire Place • 7 bedrooms

Casa Vista Zen
Entire Place • 4 bedrooms

VIP House in Chapada - Hot Tub and Spectacular View
Entire Place • 3 bedrooms
Note: Performance varies based on location, size, amenities, seasonality, and management quality. Data reflects the past 12 months.
Top Performing Airbnb Hosts in Alto Paraíso de Goiás (2026)
Learn from the best! This table showcases top-performing Airbnb hosts in Alto Paraíso de Goiás based on the number of properties managed and estimated total revenue over the past year. Analyze their scale and performance metrics.
| Host Name | Properties | Grossing Revenue | Stay Reviews | Avg Rating |
|---|---|---|---|---|
| Fabio | 9 | $309,648 | 451 | 4.83/5.0 |
| Erlandes | 8 | $149,277 | 301 | 4.97/5.0 |
| Elvis DiMatos | 3 | $138,278 | 113 | 4.99/5.0 |
| Rustik | 5 | $137,147 | 234 | 4.93/5.0 |
| Jessica Alexandra | 9 | $133,187 | 669 | 4.93/5.0 |
| Filipe Ragendra | 4 | $118,148 | 967 | 4.96/5.0 |
| Carlos | 3 | $110,894 | 382 | 4.99/5.0 |
| Monica | 1 | $104,661 | 37 | 5.00/5.0 |
| Augusto | 1 | $103,330 | 67 | 5.00/5.0 |
| Baguá Bangalôs | 4 | $99,867 | 14 | 5.00/5.0 |
Analyzing the strategies of top hosts, such as their property selection, pricing, and guest communication, can offer valuable lessons for optimizing your own Airbnb operations in Alto Paraíso de Goiás.
Dive Deeper: Advanced Alto Paraíso de Goiás STR Market Data (2026)
Ready to unlock more insights? AirROI provides access to advanced metrics and comprehensive Airbnb data for Alto Paraíso de Goiás. Explore detailed analytics beyond this report to refine your investment strategy, optimize pricing, and maximize your vacation rental profits.
Explore Advanced MetricsAlto Paraíso de Goiás Short-Term Rental Market Composition (2026): Property & Room Types
Room Type Distribution
Property Type Distribution
Market Composition Insights for Alto Paraíso de Goiás
- The Alto Paraíso de Goiás Airbnb market composition is heavily skewed towards Entire Home/Apt listings, which make up 77.6% of the 1,323 active rentals. This indicates strong guest preference for privacy and space.
- Looking at the property type distribution in Alto Paraíso de Goiás, House properties are the most common (66.1%), reflecting the local real estate landscape.
- Houses represent a significant 66.1% portion, catering likely to families or larger groups.
- The presence of 13.6% Hotel/Boutique listings indicates integration with traditional hospitality.
- Smaller segments like others, unique stays (combined 6.9%) offer potential for unique stay experiences.
Alto Paraíso de Goiás Airbnb Room Capacity Analysis (2026): Bedroom Distribution
Distribution of Listings by Number of Bedrooms
Room Capacity Insights for Alto Paraíso de Goiás
- The dominant room capacity in Alto Paraíso de Goiás is 1 bedroom listings, making up 45.5% of the market. This suggests a strong demand for properties suitable for couples or solo travelers.
- Together, 1 bedroom and 2 bedrooms properties represent 66.6% of the active Airbnb listings in Alto Paraíso de Goiás, indicating a high concentration in these sizes.
Alto Paraíso de Goiás Vacation Rental Guest Capacity Trends (2026)
Distribution of Listings by Guest Capacity
Guest Capacity Insights for Alto Paraíso de Goiás
- The most common guest capacity trend in Alto Paraíso de Goiás vacation rentals is listings accommodating 2 guests (22.4%). This suggests the primary traveler segment is likely couples or solo travelers.
- Properties designed for 2 guests and 4 guests dominate the Alto Paraíso de Goiás STR market, accounting for 42.9% of listings.
- 22.0% of properties accommodate 6+ guests, serving the market segment for larger families or group travel in Alto Paraíso de Goiás.
- On average, properties in Alto Paraíso de Goiás are equipped to host 3.5 guests.
Alto Paraíso de Goiás Airbnb Booking Patterns (2026): Available vs. Booked Days
Available Days Distribution
Booked Days Distribution
Booking Pattern Insights for Alto Paraíso de Goiás
- The most common availability pattern in Alto Paraíso de Goiás falls within the 271-366 days range, representing 65.5% of listings. This suggests many properties have significant open periods on their calendars.
- Approximately 89.2% of listings show high availability (181+ days open annually), indicating potential for increased bookings or specific owner usage patterns.
- For booked days, the 31-90 days range is most frequent in Alto Paraíso de Goiás (35%), reflecting common guest stay durations or potential owner blocking patterns.
- A notable 11.3% of properties secure long booking periods (181+ days booked per year), highlighting successful long-term rental strategies or significant owner usage.
Alto Paraíso de Goiás Airbnb Minimum Stay Requirements Analysis
Distribution of Listings by Minimum Night Requirement
1 Night
257 listings
19.4% of total
2 Nights
656 listings
49.6% of total
3 Nights
33 listings
2.5% of total
4-6 Nights
6 listings
0.5% of total
7-29 Nights
2 listings
0.2% of total
30+ Nights
369 listings
27.9% of total
Key Insights
- The most prevalent minimum stay requirement in Alto Paraíso de Goiás is 2 Nights, adopted by 49.6% of listings. This highlights the market's preference for shorter, flexible bookings.
- A strong majority (69.0%) of the Alto Paraíso de Goiás Airbnb data shows acceptance of very short stays (1-2 nights), indicating a dynamic, high-turnover market.
- A significant segment (27.9%) caters to monthly stays (30+ nights) in Alto Paraíso de Goiás, pointing to opportunities in the extended-stay market.
Recommendations
- Align with the market by considering a 2 Nights minimum stay, as 49.6% of Alto Paraíso de Goiás hosts use this setting.
- If feasible, allowing 1-night stays, especially midweek or during low season, could capture last-minute bookings, as only 19.4% currently do.
- A 2-night minimum appears standard (49.6%). Consider this for weekends or peak periods.
- Explore offering discounts for stays of 30+ nights to attract the 27.9% of the market seeking extended stays.
- Adjust minimum nights based on seasonality – potentially shorter during low season and longer during peak demand periods in Alto Paraíso de Goiás.
Alto Paraíso de Goiás Airbnb Cancellation Policy Trends Analysis (2026)
Limited
20 listings
1.5% of total
Super Strict 60 Days
2 listings
0.2% of total
Super Strict 30 Days
1 listings
0.1% of total
Non-refundable
3 listings
0.2% of total
Refundable
3 listings
0.2% of total
Flexible
214 listings
16.2% of total
Moderate
308 listings
23.4% of total
Firm
581 listings
44.1% of total
Strict
186 listings
14.1% of total
Cancellation Policy Insights for Alto Paraíso de Goiás
- The prevailing Airbnb cancellation policy trend in Alto Paraíso de Goiás is Firm, used by 44.1% of listings.
- A majority (58.2%) of hosts in Alto Paraíso de Goiás utilize Firm or Strict policies, indicating a market where hosts prioritize booking security.
Recommendations for Hosts
- Consider adopting a Firm policy to align with the 44.1% market standard in Alto Paraíso de Goiás.
- Using a Strict policy might deter some guests, as only 14.1% of listings use it. Evaluate if potential revenue protection outweighs possible lower booking rates.
- Regularly review your cancellation policy against competitors and market demand shifts in Alto Paraíso de Goiás.
Alto Paraíso de Goiás STR Booking Lead Time Analysis (2026)
Average Booking Lead Time by Month
Booking Lead Time Insights for Alto Paraíso de Goiás
- The overall average booking lead time for vacation rentals in Alto Paraíso de Goiás is 34 days.
- Guests book furthest in advance for stays during December (average 50 days), likely coinciding with peak travel demand or local events.
- The shortest booking windows occur for stays in March (average 25 days), indicating more last-minute travel plans during this time.
- Seasonally, Summer (37 days avg.) sees the longest lead times, while Fall (29 days avg.) has the shortest, reflecting typical travel planning cycles.
Recommendations for Hosts
- Use the overall average lead time (34 days) as a baseline for your pricing and availability strategy in Alto Paraíso de Goiás.
- For December stays, consider implementing length-of-stay discounts or slightly higher rates for bookings made less than 50 days out to capitalize on advance planning.
- Target marketing efforts for the Summer season well in advance (at least 37 days) to capture early planners.
- Monitor your own booking lead times against these Alto Paraíso de Goiás averages to identify opportunities for dynamic pricing adjustments.
Popular & Essential Airbnb Amenities in Alto Paraíso de Goiás (2026)
Amenity Prevalence
Amenity Insights for Alto Paraíso de Goiás
- Essential amenities in Alto Paraíso de Goiás that guests expect include: Wifi. Lacking these (this) could significantly impact bookings.
- Popular amenities like Kitchen, Free parking on premises, Hot water are common but not universal. Offering these can provide a competitive edge.
Recommendations for Hosts
- Ensure your listing includes all essential amenities for Alto Paraíso de Goiás: Wifi.
- Prioritize adding missing essentials: Wifi.
- Consider adding popular differentiators like Kitchen or Free parking on premises to increase appeal.
- Highlight unique or less common amenities you offer (e.g., hot tub, dedicated workspace, EV charger) in your listing description and photos.
- Regularly check competitor amenities in Alto Paraíso de Goiás to stay competitive.
Alto Paraíso de Goiás Airbnb Guest Demographics & Profile Analysis (2026)
Guest Profile Summary for Alto Paraíso de Goiás
- The typical guest profile for Airbnb in Alto Paraíso de Goiás consists of primarily domestic travelers (94%), often arriving from nearby Brasília, typically belonging to the Post-2000s (Gen Z/Alpha) group (50%), primarily speaking Portuguese or English.
- Domestic travelers account for 93.5% of guests.
- Key international markets include Brazil (93.5%) and United States (1.6%).
- Top languages spoken are Portuguese (41.3%) followed by English (32.6%).
- A significant demographic segment is the Post-2000s (Gen Z/Alpha) group, representing 50% of guests.
Recommendations for Hosts
- Target domestic marketing efforts towards travelers from Brasília and São Paulo.
- Tailor amenities and listing descriptions to appeal to the dominant Post-2000s (Gen Z/Alpha) demographic (e.g., highlight fast WiFi, smart home features, local guides).
- Highlight unique local experiences or amenities relevant to the primary guest profile.
- Consider seasonal promotions aligned with peak travel times for key origin markets.
Nearby Short-Term Rental Market Comparison
How does the Alto Paraíso de Goiás Airbnb market stack up against its neighbors? Compare key performance metrics like average monthly revenue, ADR, and occupancy rates in surrounding areas to understand the broader regional STR landscape.
| Market | Active Properties | Monthly Revenue | Daily Rate | Avg. Occupancy |
|---|---|---|---|---|
| Paranoá | 40 | $1,283 | $123.23 | 40% |
| Jardim Botânico | 56 | $994 | $105.50 | 39% |
| Pirenópolis | 1,571 | $848 | $122.51 | 28% |
| Santa Maria | 15 | $758 | $146.58 | 23% |
| Park Way | 25 | $751 | $91.48 | 28% |
| Ceilândia | 20 | $746 | $92.42 | 42% |
| Planaltina | 19 | $672 | $116.12 | 31% |
| Plano Piloto | 2,448 | $671 | $62.73 | 46% |
| Sobradinho | 80 | $661 | $103.99 | 33% |
| São Sebastião | 51 | $651 | $83.71 | 32% |