Samambaia Airbnb Market Analysis 2026: Short Term Rental Data & Vacation Rental Statistics in Federal District, Brazil
Is Airbnb profitable in Samambaia in 2026? Explore comprehensive Airbnb analytics for Samambaia, Federal District, Brazil to uncover income potential. This 2026 STR market report for Samambaia, based on AirROI data from February 2025 to January 2026, reveals key trends in the niche market of 35 active listings.
Whether you're considering an Airbnb investment in Samambaia, optimizing your existing vacation rental, or exploring rental arbitrage opportunities, understanding the Samambaia Airbnb data is crucial. Leveraging the low regulation environment is key to maximizing your short term rental income potential. Let's dive into the specifics.
Key Samambaia Airbnb Performance Metrics Overview
Monthly Airbnb Revenue Variations & Income Potential in Samambaia (2026)
Understanding the monthly revenue variations for Airbnb listings in Samambaia is key to maximizing your short term rental income potential. Seasonality significantly impacts earnings. Our analysis, based on data from the past 12 months, shows that the peak revenue month for STRs in Samambaia is typically March, while May often presents the lowest earnings, highlighting opportunities for strategic pricing adjustments during shoulder and low seasons. Explore the typical Airbnb income in Samambaia across different performance tiers:
- Best-in-class properties (Top 10%) achieve $546+ monthly, often utilizing dynamic pricing and superior guest experiences.
- Strong performing properties (Top 25%) earn $383 or more, indicating effective management and desirable locations/amenities.
- Typical properties (Median) generate around $202 per month, representing the average market performance.
- Entry-level properties (Bottom 25%) see earnings around $91, often with potential for optimization.
Average Monthly Airbnb Earnings Trend in Samambaia
Samambaia Airbnb Occupancy Rate Trends (2026)
Maximize your bookings by understanding the Samambaia STR occupancy trends. Seasonal demand shifts significantly influence how often properties are booked. Typically, Marchsees the highest demand (peak season occupancy), while May experiences the lowest (low season). Effective strategies, like adjusting minimum stays or offering promotions, can boost occupancy during slower periods. Here's how different property tiers perform in Samambaia:
- Best-in-class properties (Top 10%) achieve 69%+ occupancy, indicating high desirability and potentially optimized availability.
- Strong performing properties (Top 25%) maintain 45% or higher occupancy, suggesting good market fit and guest satisfaction.
- Typical properties (Median) have an occupancy rate around 23%.
- Entry-level properties (Bottom 25%) average 12% occupancy, potentially facing higher vacancy.
Average Monthly Occupancy Rate Trend in Samambaia
Average Daily Rate (ADR) Airbnb Trends in Samambaia (2026)
Effective short term rental pricing strategy in Samambaia involves understanding monthly ADR fluctuations. The Average Daily Rate (ADR) for Airbnb in Samambaia typically peaks in August and dips lowest during September. Leveraging Airbnb dynamic pricing tools or strategies based on this seasonality can significantly boost revenue. Here's a look at the typical nightly rates achieved:
- Best-in-class properties (Top 10%) command rates of $60+ per night, often due to premium features or locations.
- Strong performing properties (Top 25%) achieve nightly rates of $48 or more.
- Typical properties (Median) charge around $26 per night.
- Entry-level properties (Bottom 25%) earn around $20 per night.
Average Daily Rate (ADR) Trend by Month in Samambaia
Get Live Samambaia Market Intelligence 👇

Explore Real-time Analytics
Airbnb Seasonality Analysis & Trends in Samambaia (2026)
Peak Season (March, December, April)
- Revenue averages $347 per month
- Occupancy rates average 38.3%
- Daily rates average $44
Shoulder Season
- Revenue averages $261 per month
- Occupancy maintains around 29.4%
- Daily rates hold near $44
Low Season (May, June, September)
- Revenue drops to average $216 per month
- Occupancy decreases to average 24.6%
- Daily rates adjust to average $45
Seasonality Insights for Samambaia
- The Airbnb seasonality in Samambaia shows moderate seasonality with distinct peak and low periods. While the sections above show seasonal averages, it's also insightful to look at the extremes:
- During the high season, the absolute peak month showcases Samambaia's highest earning potential, with monthly revenues capable of climbing to $390, occupancy reaching a high of 43.9%, and ADRs peaking at $51.
- Conversely, the slowest single month of the year, typically falling within the low season, marks the market's lowest point. In this month, revenue might dip to $204, occupancy could drop to 20.3%, and ADRs may adjust down to $36.
- Understanding both the seasonal averages and these monthly peaks and troughs in revenue, occupancy, and ADR is crucial for maximizing your Airbnb profit potential in Samambaia.
Seasonal Strategies for Maximizing Profit
- Peak Season: Maximize revenue through premium pricing and potentially longer minimum stays. Ensure high availability.
- Low Season: Offer competitive pricing, special promotions (e.g., extended stay discounts), and flexible cancellation policies. Target off-season travelers like remote workers or budget-conscious guests.
- Shoulder Seasons: Implement dynamic pricing that balances peak and low rates. Target weekend travelers or specific events. Offer slightly more flexible terms than peak season.
- Regularly analyze your own performance against these Samambaia seasonality benchmarks and adjust your pricing and availability strategy accordingly.
Best Areas for Airbnb Investment in Samambaia (2026)
Exploring the top neighborhoods for short-term rentals in Samambaia? This section highlights key areas, outlining why they are attractive for hosts and guests, along with notable local attractions. Consider these locations based on your target guest profile and investment strategy.
| Neighborhood / Area | Why Host Here? (Target Guests & Appeal) | Key Attractions & Landmarks |
|---|---|---|
| Samambaia Norte | One of the most popular areas in Samambaia, known for its residential comfort and accessibility. It attracts both families and visitors due to its local shops and parks. | Cultural Center of Samambaia, Parque da Cidade Samambaia, Local markets and food stalls |
| Samambaia Sul | Valued for its affordable living and community spirit, this area is suitable for hosting families and shorter-term visitors who want a home-like environment. | Samambaia Shopping, Parque Nativo, Cascavel Park |
| Arniqueiras | A nearby neighborhood known for its quiet atmosphere and proximity to major roads, making it a convenient spot for guests traveling in and out of the city. | Local cafes, Nearby shopping centers, Easy access to public transportation |
| Nova Samambaia | This developing area is gaining popularity for its new infrastructure and potential for investment opportunities in short-term rentals. | Local parks, Newer residential developments, Community events |
| Bonde do Porto | Known for its local culture and community events, this area attracts visitors interested in experiencing the authentic lifestyle of Samambaia. | Cultural events, Local eateries, Community parks |
| Mato Grosso | An area with growing appeal due to its natural surroundings and recreational opportunities for tourists looking for outdoor activities. | Nature trails, Parks and recreational areas, Outdoor markets |
| Centro de Samambaia | The central hub of activity with numerous amenities, restaurants, and vibrant nightlife, suitable for visitors wanting to stay close to the action. | Shopping areas, Restaurants and bars, Cultural festivals |
| Taguatinga | Just adjacent to Samambaia, Taguatinga offers a bustling urban atmosphere with a range of attractions and is a viable option for short-term rentals. | Taguatinga Shopping, Local artisan markets, Parks and recreational facilities |
Understanding Airbnb License Requirements & STR Laws in Samambaia (2026)
While Samambaia, Federal District, Brazil currently shows low STR regulations, specific Airbnb license requirements might still exist or change. Always verify the latest short term rental regulations and Airbnb license requirements directly with local government authorities for Samambaia to ensure full compliance before hosting.
(Source: AirROI data, 2026, finding no licensed listings among those analyzed)
Top Performing Airbnb Properties in Samambaia (2026)
Benchmark your potential! Explore examples of top-performing Airbnb properties in Samambaiabased on Trailing Twelve Month (TTM) revenue. Analyze their characteristics, revenue, occupancy rate, and ADR to understand what drives success in this market.
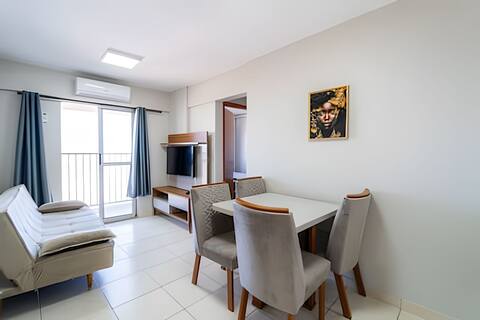
Ap 2Qts, Up to 5 guests, Parking, Elevator
Entire Place • 2 bedrooms
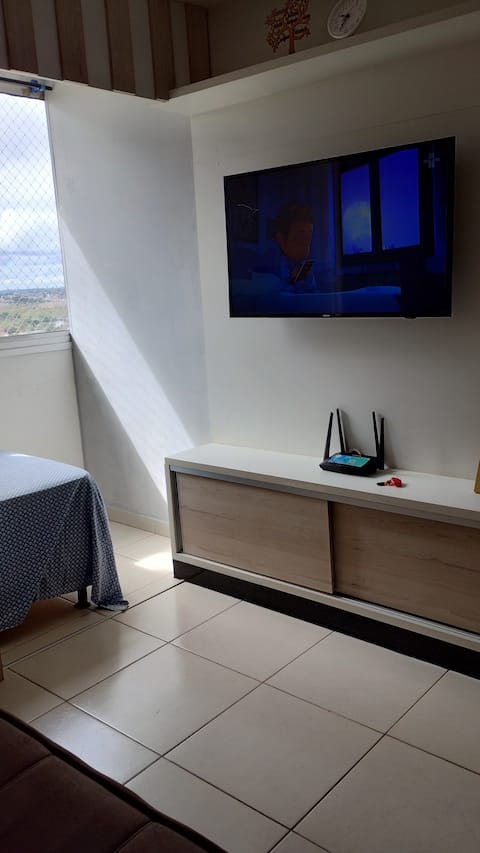
Your home away from home. 25 minutes from JK airport
Entire Place • 1 bedroom
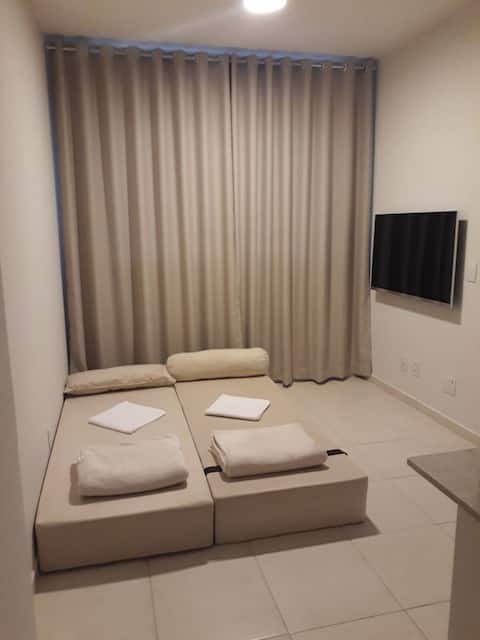
Comfort in Samambaia - We rent monthly
Entire Place • 1 bedroom

A haven of peace and coziness
Entire Place • 1 bedroom

Parking space, Swimming pool, Wi-Fi! Airport and Metro nearby!
Entire Place • 1 bedroom
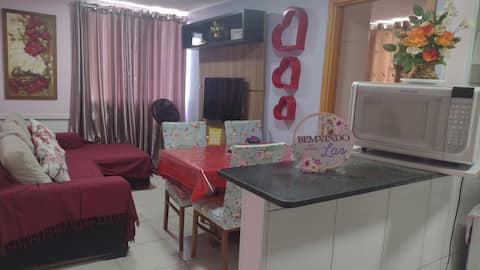
My Little Corner of Rest, Panoramic View of the Federal District.
Entire Place • 1 bedroom
Note: Performance varies based on location, size, amenities, seasonality, and management quality. Data reflects the past 12 months.
Top Performing Airbnb Hosts in Samambaia (2026)
Learn from the best! This table showcases top-performing Airbnb hosts in Samambaia based on the number of properties managed and estimated total revenue over the past year. Analyze their scale and performance metrics.
| Host Name | Properties | Grossing Revenue | Stay Reviews | Avg Rating |
|---|---|---|---|---|
| Juliano Barboza | 9 | $11,166 | 218 | 4.69/5.0 |
| Janio Jr Catito | 2 | $8,870 | 16 | 4.82/5.0 |
| Rodrigo | 4 | $8,271 | 11 | 5.00/5.0 |
| Maria Eugenia | 2 | $6,289 | 71 | 4.93/5.0 |
| Nilva | 1 | $5,310 | 42 | 4.83/5.0 |
| Leonardo | 1 | $4,783 | 85 | 4.84/5.0 |
| Felipe | 1 | $4,604 | 89 | 4.92/5.0 |
| Israel | 1 | $4,225 | 86 | 4.50/5.0 |
| Paulo | 1 | $4,115 | 215 | 4.99/5.0 |
| Aquila | 2 | $3,083 | 84 | 4.91/5.0 |
Analyzing the strategies of top hosts, such as their property selection, pricing, and guest communication, can offer valuable lessons for optimizing your own Airbnb operations in Samambaia.
Dive Deeper: Advanced Samambaia STR Market Data (2026)
Ready to unlock more insights? AirROI provides access to advanced metrics and comprehensive Airbnb data for Samambaia. Explore detailed analytics beyond this report to refine your investment strategy, optimize pricing, and maximize your vacation rental profits.
Explore Advanced MetricsSamambaia Short-Term Rental Market Composition (2026): Property & Room Types
Room Type Distribution
Property Type Distribution
Market Composition Insights for Samambaia
- The Samambaia Airbnb market composition is heavily skewed towards Entire Home/Apt listings, which make up 100% of the 35 active rentals. This indicates strong guest preference for privacy and space.
- Looking at the property type distribution in Samambaia, Apartment/Condo properties are the most common (91.4%), reflecting the local real estate landscape.
Samambaia Airbnb Room Capacity Analysis (2026): Bedroom Distribution
Distribution of Listings by Number of Bedrooms
Room Capacity Insights for Samambaia
- The dominant room capacity in Samambaia is 1 bedroom listings, making up 60% of the market. This suggests a strong demand for properties suitable for couples or solo travelers.
- Together, 1 bedroom and 2 bedrooms properties represent 94.3% of the active Airbnb listings in Samambaia, indicating a high concentration in these sizes.
- With over half the market (60%) consisting of studios or 1-bedroom units, Samambaia is particularly well-suited for individuals or couples.
- Listings with 3+ bedrooms (5.7%) represent a smaller niche, potentially indicating an underserved market for larger group accommodations in Samambaia.
Samambaia Vacation Rental Guest Capacity Trends (2026)
Distribution of Listings by Guest Capacity
Guest Capacity Insights for Samambaia
- The most common guest capacity trend in Samambaia vacation rentals is listings accommodating 4 guests (28.6%). This suggests the primary traveler segment is likely small families or groups.
- Properties designed for 4 guests and 5 guests dominate the Samambaia STR market, accounting for 51.5% of listings.
- 28.6% of properties accommodate 6+ guests, serving the market segment for larger families or group travel in Samambaia.
- On average, properties in Samambaia are equipped to host 4.9 guests.
Samambaia Airbnb Booking Patterns (2026): Available vs. Booked Days
Available Days Distribution
Booked Days Distribution
Booking Pattern Insights for Samambaia
- The most common availability pattern in Samambaia falls within the 271-366 days range, representing 71.4% of listings. This suggests many properties have significant open periods on their calendars.
- Approximately 94.3% of listings show high availability (181+ days open annually), indicating potential for increased bookings or specific owner usage patterns.
- For booked days, the 31-90 days range is most frequent in Samambaia (51.4%), reflecting common guest stay durations or potential owner blocking patterns.
- A notable 5.7% of properties secure long booking periods (181+ days booked per year), highlighting successful long-term rental strategies or significant owner usage.
Samambaia Airbnb Minimum Stay Requirements Analysis
Distribution of Listings by Minimum Night Requirement
1 Night
18 listings
51.4% of total
2 Nights
7 listings
20% of total
3 Nights
3 listings
8.6% of total
4-6 Nights
1 listings
2.9% of total
30+ Nights
6 listings
17.1% of total
Key Insights
- The most prevalent minimum stay requirement in Samambaia is 1 Night, adopted by 51.4% of listings. This highlights the market's preference for shorter, flexible bookings.
- A strong majority (71.4%) of the Samambaia Airbnb data shows acceptance of very short stays (1-2 nights), indicating a dynamic, high-turnover market.
- A significant segment (17.1%) caters to monthly stays (30+ nights) in Samambaia, pointing to opportunities in the extended-stay market.
Recommendations
- Align with the market by considering a 1 Night minimum stay, as 51.4% of Samambaia hosts use this setting.
- Explore offering discounts for stays of 30+ nights to attract the 17.1% of the market seeking extended stays.
- Adjust minimum nights based on seasonality – potentially shorter during low season and longer during peak demand periods in Samambaia.
Samambaia Airbnb Cancellation Policy Trends Analysis (2026)
Flexible
16 listings
45.7% of total
Moderate
5 listings
14.3% of total
Firm
8 listings
22.9% of total
Strict
6 listings
17.1% of total
Cancellation Policy Insights for Samambaia
- The prevailing Airbnb cancellation policy trend in Samambaia is Flexible, used by 45.7% of listings.
- There's a relatively balanced mix between guest-friendly (60.0%) and stricter (40.0%) policies, offering choices for different guest needs.
Recommendations for Hosts
- Consider adopting a Flexible policy to align with the 45.7% market standard in Samambaia.
- Regularly review your cancellation policy against competitors and market demand shifts in Samambaia.
Samambaia STR Booking Lead Time Analysis (2026)
Average Booking Lead Time by Month
Booking Lead Time Insights for Samambaia
- The overall average booking lead time for vacation rentals in Samambaia is 11 days.
- Guests book furthest in advance for stays during December (average 19 days), likely coinciding with peak travel demand or local events.
- The shortest booking windows occur for stays in June (average 5 days), indicating more last-minute travel plans during this time.
- Seasonally, Winter (13 days avg.) sees the longest lead times, while Spring (6 days avg.) has the shortest, reflecting typical travel planning cycles.
Recommendations for Hosts
- Use the overall average lead time (11 days) as a baseline for your pricing and availability strategy in Samambaia.
- Target marketing efforts for the Winter season well in advance (at least 13 days) to capture early planners.
- Monitor your own booking lead times against these Samambaia averages to identify opportunities for dynamic pricing adjustments.
Popular & Essential Airbnb Amenities in Samambaia (2026)
Amenity Prevalence
Amenity Insights for Samambaia
- Essential amenities in Samambaia that guests expect include: Kitchen. Lacking these (this) could significantly impact bookings.
- Popular amenities like Wifi, Hot water, TV are common but not universal. Offering these can provide a competitive edge.
- Warning: Wifi is not universally provided but is considered essential globally. Ensure reliable Wifi is offered.
Recommendations for Hosts
- Ensure your listing includes all essential amenities for Samambaia: Kitchen.
- Consider adding popular differentiators like Wifi or Hot water to increase appeal.
- Highlight unique or less common amenities you offer (e.g., hot tub, dedicated workspace, EV charger) in your listing description and photos.
- Regularly check competitor amenities in Samambaia to stay competitive.
Samambaia Airbnb Guest Demographics & Profile Analysis (2026)
Guest Profile Summary for Samambaia
- The typical guest profile for Airbnb in Samambaia consists of primarily domestic travelers (97%), often arriving from nearby Brasilia, typically belonging to the Post-2000s (Gen Z/Alpha) group (50%), primarily speaking Portuguese or English.
- Domestic travelers account for 97.1% of guests.
- Key international markets include Brazil (97.1%) and United States (1.4%).
- Top languages spoken are Portuguese (53.6%) followed by English (27.7%).
- A significant demographic segment is the Post-2000s (Gen Z/Alpha) group, representing 50% of guests.
Recommendations for Hosts
- Target domestic marketing efforts towards travelers from Brasilia and Brasília.
- Tailor amenities and listing descriptions to appeal to the dominant Post-2000s (Gen Z/Alpha) demographic (e.g., highlight fast WiFi, smart home features, local guides).
- Highlight unique local experiences or amenities relevant to the primary guest profile.
- Consider seasonal promotions aligned with peak travel times for key origin markets.
Nearby Short-Term Rental Market Comparison
How does the Samambaia Airbnb market stack up against its neighbors? Compare key performance metrics like average monthly revenue, ADR, and occupancy rates in surrounding areas to understand the broader regional STR landscape.
| Market | Active Properties | Monthly Revenue | Daily Rate | Avg. Occupancy |
|---|---|---|---|---|
| Paranoá | 40 | $1,283 | $123.23 | 40% |
| Jardim Botânico | 56 | $994 | $105.50 | 39% |
| Pirenópolis | 1,571 | $848 | $122.51 | 28% |
| Alexânia | 119 | $826 | $157.61 | 23% |
| Santa Maria | 15 | $758 | $146.58 | 23% |
| Park Way | 25 | $751 | $91.48 | 28% |
| Ceilândia | 20 | $746 | $92.42 | 42% |
| Senador Canedo | 22 | $691 | $139.79 | 25% |
| Planaltina | 19 | $672 | $116.12 | 31% |
| Plano Piloto | 2,448 | $671 | $62.73 | 46% |