Planaltina Airbnb Market Analysis 2026: Short Term Rental Data & Vacation Rental Statistics in Federal District, Brazil
Is Airbnb profitable in Planaltina in 2026? Explore comprehensive Airbnb analytics for Planaltina, Federal District, Brazil to uncover income potential. This 2026 STR market report for Planaltina, based on AirROI data from February 2025 to January 2026, reveals key trends in the niche market of 19 active listings.
Whether you're considering an Airbnb investment in Planaltina, optimizing your existing vacation rental, or exploring rental arbitrage opportunities, understanding the Planaltina Airbnb data is crucial. Leveraging the low regulation environment is key to maximizing your short term rental income potential. Let's dive into the specifics.
Key Planaltina Airbnb Performance Metrics Overview
Monthly Airbnb Revenue Variations & Income Potential in Planaltina (2026)
Understanding the monthly revenue variations for Airbnb listings in Planaltina is key to maximizing your short term rental income potential. Seasonality significantly impacts earnings. Our analysis, based on data from the past 12 months, shows that the peak revenue month for STRs in Planaltina is typically December, while April often presents the lowest earnings, highlighting opportunities for strategic pricing adjustments during shoulder and low seasons. Explore the typical Airbnb income in Planaltina across different performance tiers:
- Best-in-class properties (Top 10%) achieve $2,094+ monthly, often utilizing dynamic pricing and superior guest experiences.
- Strong performing properties (Top 25%) earn $1,186 or more, indicating effective management and desirable locations/amenities.
- Typical properties (Median) generate around $515 per month, representing the average market performance.
- Entry-level properties (Bottom 25%) see earnings around $292, often with potential for optimization.
Average Monthly Airbnb Earnings Trend in Planaltina
Planaltina Airbnb Occupancy Rate Trends (2026)
Maximize your bookings by understanding the Planaltina STR occupancy trends. Seasonal demand shifts significantly influence how often properties are booked. Typically, Augustsees the highest demand (peak season occupancy), while April experiences the lowest (low season). Effective strategies, like adjusting minimum stays or offering promotions, can boost occupancy during slower periods. Here's how different property tiers perform in Planaltina:
- Best-in-class properties (Top 10%) achieve 73%+ occupancy, indicating high desirability and potentially optimized availability.
- Strong performing properties (Top 25%) maintain 54% or higher occupancy, suggesting good market fit and guest satisfaction.
- Typical properties (Median) have an occupancy rate around 33%.
- Entry-level properties (Bottom 25%) average 17% occupancy, potentially facing higher vacancy.
Average Monthly Occupancy Rate Trend in Planaltina
Average Daily Rate (ADR) Airbnb Trends in Planaltina (2026)
Effective short term rental pricing strategy in Planaltina involves understanding monthly ADR fluctuations. The Average Daily Rate (ADR) for Airbnb in Planaltina typically peaks in December and dips lowest during February. Leveraging Airbnb dynamic pricing tools or strategies based on this seasonality can significantly boost revenue. Here's a look at the typical nightly rates achieved:
- Best-in-class properties (Top 10%) command rates of $208+ per night, often due to premium features or locations.
- Strong performing properties (Top 25%) achieve nightly rates of $131 or more.
- Typical properties (Median) charge around $89 per night.
- Entry-level properties (Bottom 25%) earn around $28 per night.
Average Daily Rate (ADR) Trend by Month in Planaltina
Get Live Planaltina Market Intelligence 👇

Explore Real-time Analytics
Airbnb Seasonality Analysis & Trends in Planaltina (2026)
Peak Season (December, August, June)
- Revenue averages $1,283 per month
- Occupancy rates average 40.9%
- Daily rates average $98
Shoulder Season
- Revenue averages $968 per month
- Occupancy maintains around 39.7%
- Daily rates hold near $100
Low Season (February, April, November)
- Revenue drops to average $720 per month
- Occupancy decreases to average 29.3%
- Daily rates adjust to average $94
Seasonality Insights for Planaltina
- The Airbnb seasonality in Planaltina shows highly seasonal trends requiring careful strategy. While the sections above show seasonal averages, it's also insightful to look at the extremes:
- During the high season, the absolute peak month showcases Planaltina's highest earning potential, with monthly revenues capable of climbing to $1,405, occupancy reaching a high of 46.8%, and ADRs peaking at $117.
- Conversely, the slowest single month of the year, typically falling within the low season, marks the market's lowest point. In this month, revenue might dip to $614, occupancy could drop to 22.1%, and ADRs may adjust down to $86.
- Understanding both the seasonal averages and these monthly peaks and troughs in revenue, occupancy, and ADR is crucial for maximizing your Airbnb profit potential in Planaltina.
Seasonal Strategies for Maximizing Profit
- Peak Season: Maximize revenue through premium pricing and potentially longer minimum stays. Ensure high availability.
- Low Season: Offer competitive pricing, special promotions (e.g., extended stay discounts), and flexible cancellation policies. Target off-season travelers like remote workers or budget-conscious guests.
- Shoulder Seasons: Implement dynamic pricing that balances peak and low rates. Target weekend travelers or specific events. Offer slightly more flexible terms than peak season.
- Regularly analyze your own performance against these Planaltina seasonality benchmarks and adjust your pricing and availability strategy accordingly.
Best Areas for Airbnb Investment in Planaltina (2026)
Exploring the top neighborhoods for short-term rentals in Planaltina? This section highlights key areas, outlining why they are attractive for hosts and guests, along with notable local attractions. Consider these locations based on your target guest profile and investment strategy.
| Neighborhood / Area | Why Host Here? (Target Guests & Appeal) | Key Attractions & Landmarks |
|---|---|---|
| Centro | The heart of Planaltina with easy access to shopping, dining, and local culture. It's a convenient area for guests looking to explore the city. | Mercado Municipal, Praça do Relógio, Igreja de Nossa Senhora da Conceição, Shopping Planaltina, Museu de Planaltina |
| Setor O | A residential area with a growing number of local amenities and proximity to schools and parks, appealing to families and longer-term guests. | Parque da Cidade, Escola Municipal, Praça da Juventude, Cafés locais, Comércio local |
| Jardim Roriz | A suburban area closer to nature, perfect for guests who appreciate quiet surroundings and green spaces, yet not far from the city center. | Parque Jardim Roriz, Praça da Paz, Área Verde do Roriz, Restaurantes locais, Pontos turísticos da cidade |
| Setor S | A vibrant area with several entertainment options and close proximity to key transport links, making it attractive for tourists and business travelers alike. | Restaurantes e bares, Praça do Trabalhador, Centro Esportivo, Shopping local, Eventos culturais |
| Gama | An emerging suburb with affordable housing options that cater to young travelers and backpackers, offering a homey feel and local experiences. | Feira Livre, Cultura local, Praça do Gama, Escola de Música, Atividades recreativas |
| Setor A | This area provides a balance between residential calm and access to city amenities, ideal for families and visitors looking for comfort. | Mercado do Setor A, Parque Recreativo, Órgãos culturais, Feira de Artesanato, Cafés e bistrôs |
| Planaltina Norte | A rapidly developing area with new infrastructure and facilities, appealing to younger crowds and those looking for value in their stay. | Shopping Open Mall, Parques menores, Cafés e espaços abertos, Escolas, Eventos comunitários |
| Setor L | Known for its artistic community and local events, this area attracts creatives and those looking for a unique cultural experience during their stay. | Estúdios de arte, Feiras culturais, Eventos artísticos, Praças com música ao vivo, Cafés temáticos |
Understanding Airbnb License Requirements & STR Laws in Planaltina (2026)
While Planaltina, Federal District, Brazil currently shows low STR regulations, specific Airbnb license requirements might still exist or change. Always verify the latest short term rental regulations and Airbnb license requirements directly with local government authorities for Planaltina to ensure full compliance before hosting.
(Source: AirROI data, 2026, finding no licensed listings among those analyzed)
Top Performing Airbnb Properties in Planaltina (2026)
Benchmark your potential! Explore examples of top-performing Airbnb properties in Planaltinabased on Trailing Twelve Month (TTM) revenue. Analyze their characteristics, revenue, occupancy rate, and ADR to understand what drives success in this market.
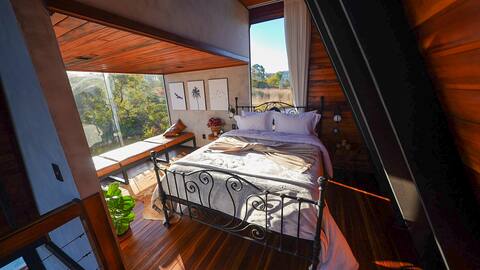
O Paraíso Achado – Cozy cabin in the mountains
Entire Place • 1 bedroom

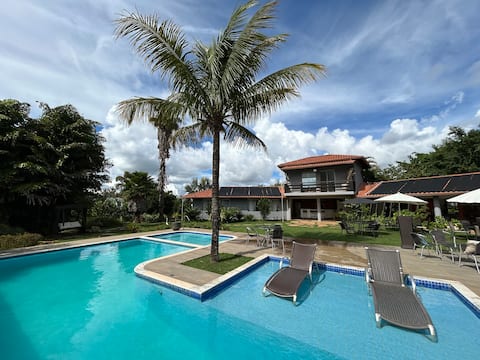
Retreat with swimming pool in a gated community
Entire Place • 2 bedrooms
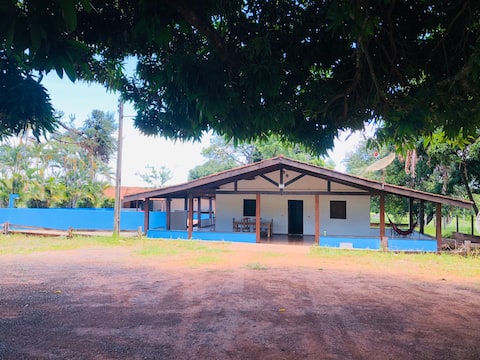
Rancho Solar - Events and Accommodation in Brasília
Entire Place • 5 bedrooms

Vila do Mirante
Entire Place • 1 bedroom
Espaço Farm, the ideal place for your event!
Entire Place • 8 bedrooms

Haras Villa-Verde with heated pool
Entire Place • 3 bedrooms
Note: Performance varies based on location, size, amenities, seasonality, and management quality. Data reflects the past 12 months.
Top Performing Airbnb Hosts in Planaltina (2026)
Learn from the best! This table showcases top-performing Airbnb hosts in Planaltina based on the number of properties managed and estimated total revenue over the past year. Analyze their scale and performance metrics.
| Host Name | Properties | Grossing Revenue | Stay Reviews | Avg Rating |
|---|---|---|---|---|
| Alessandra | 1 | $49,121 | 71 | 4.96/5.0 |
| Carmem | 1 | $17,073 | 36 | 4.92/5.0 |
| Regina | 1 | $15,732 | 14 | 5.00/5.0 |
| Diogo | 1 | $13,970 | 362 | 4.97/5.0 |
| Reuven | 2 | $11,298 | 195 | 4.97/5.0 |
| Denise | 1 | $10,180 | 21 | 4.90/5.0 |
| Juliano | 1 | $7,952 | 30 | 4.83/5.0 |
| Wilson | 1 | $5,273 | 13 | 5.00/5.0 |
| Antonio | 1 | $4,968 | 14 | 5.00/5.0 |
| Bárbara | 1 | $3,972 | 47 | 4.83/5.0 |
Analyzing the strategies of top hosts, such as their property selection, pricing, and guest communication, can offer valuable lessons for optimizing your own Airbnb operations in Planaltina.
Dive Deeper: Advanced Planaltina STR Market Data (2026)
Ready to unlock more insights? AirROI provides access to advanced metrics and comprehensive Airbnb data for Planaltina. Explore detailed analytics beyond this report to refine your investment strategy, optimize pricing, and maximize your vacation rental profits.
Explore Advanced MetricsPlanaltina Short-Term Rental Market Composition (2026): Property & Room Types
Room Type Distribution
Property Type Distribution
Market Composition Insights for Planaltina
- The Planaltina Airbnb market composition is heavily skewed towards Entire Home/Apt listings, which make up 94.7% of the 19 active rentals. This indicates strong guest preference for privacy and space.
- Looking at the property type distribution in Planaltina, House properties are the most common (52.6%), reflecting the local real estate landscape.
- Houses represent a significant 52.6% portion, catering likely to families or larger groups.
- The presence of 5.3% Hotel/Boutique listings indicates integration with traditional hospitality.
Planaltina Airbnb Room Capacity Analysis (2026): Bedroom Distribution
Distribution of Listings by Number of Bedrooms
Room Capacity Insights for Planaltina
- The dominant room capacity in Planaltina is 1 bedroom listings, making up 26.3% of the market. This suggests a strong demand for properties suitable for couples or solo travelers.
- Together, 1 bedroom and 5+ bedrooms properties represent 47.4% of the active Airbnb listings in Planaltina, indicating a high concentration in these sizes.
- A significant 52.7% of listings offer 3+ bedrooms, catering to larger groups and families seeking more space in Planaltina.
Planaltina Vacation Rental Guest Capacity Trends (2026)
Distribution of Listings by Guest Capacity
Guest Capacity Insights for Planaltina
- The most common guest capacity trend in Planaltina vacation rentals is listings accommodating 8+ guests (52.6%). This suggests the primary traveler segment is likely larger groups.
- Properties designed for 8+ guests and 2 guests dominate the Planaltina STR market, accounting for 73.7% of listings.
- 57.9% of properties accommodate 6+ guests, serving the market segment for larger families or group travel in Planaltina.
- On average, properties in Planaltina are equipped to host 5.8 guests.
Planaltina Airbnb Booking Patterns (2026): Available vs. Booked Days
Available Days Distribution
Booked Days Distribution
Booking Pattern Insights for Planaltina
- The most common availability pattern in Planaltina falls within the 271-366 days range, representing 57.9% of listings. This suggests many properties have significant open periods on their calendars.
- Approximately 84.2% of listings show high availability (181+ days open annually), indicating potential for increased bookings or specific owner usage patterns.
- For booked days, the 1-30 days range is most frequent in Planaltina (36.8%), reflecting common guest stay durations or potential owner blocking patterns.
- A notable 15.8% of properties secure long booking periods (181+ days booked per year), highlighting successful long-term rental strategies or significant owner usage.
Planaltina Airbnb Minimum Stay Requirements Analysis
Distribution of Listings by Minimum Night Requirement
1 Night
10 listings
52.6% of total
2 Nights
7 listings
36.8% of total
3 Nights
1 listings
5.3% of total
30+ Nights
1 listings
5.3% of total
Key Insights
- The most prevalent minimum stay requirement in Planaltina is 1 Night, adopted by 52.6% of listings. This highlights the market's preference for shorter, flexible bookings.
- A strong majority (89.4%) of the Planaltina Airbnb data shows acceptance of very short stays (1-2 nights), indicating a dynamic, high-turnover market.
Recommendations
- Align with the market by considering a 1 Night minimum stay, as 52.6% of Planaltina hosts use this setting.
- Explore offering discounts for stays of 30+ nights to attract the 5.3% of the market seeking extended stays.
- Adjust minimum nights based on seasonality – potentially shorter during low season and longer during peak demand periods in Planaltina.
Planaltina Airbnb Cancellation Policy Trends Analysis (2026)
Limited
1 listings
5.3% of total
Flexible
8 listings
42.1% of total
Moderate
5 listings
26.3% of total
Firm
5 listings
26.3% of total
Cancellation Policy Insights for Planaltina
- The prevailing Airbnb cancellation policy trend in Planaltina is Flexible, used by 42.1% of listings.
- There's a relatively balanced mix between guest-friendly (68.4%) and stricter (26.3%) policies, offering choices for different guest needs.
Recommendations for Hosts
- Consider adopting a Flexible policy to align with the 42.1% market standard in Planaltina.
- Regularly review your cancellation policy against competitors and market demand shifts in Planaltina.
Planaltina STR Booking Lead Time Analysis (2026)
Average Booking Lead Time by Month
Booking Lead Time Insights for Planaltina
- The overall average booking lead time for vacation rentals in Planaltina is 20 days.
- Guests book furthest in advance for stays during May (average 49 days), likely coinciding with peak travel demand or local events.
- The shortest booking windows occur for stays in March (average 13 days), indicating more last-minute travel plans during this time.
- Seasonally, Spring (34 days avg.) sees the longest lead times, while Fall (19 days avg.) has the shortest, reflecting typical travel planning cycles.
Recommendations for Hosts
- Use the overall average lead time (20 days) as a baseline for your pricing and availability strategy in Planaltina.
- For May stays, consider implementing length-of-stay discounts or slightly higher rates for bookings made less than 49 days out to capitalize on advance planning.
- Target marketing efforts for the Spring season well in advance (at least 34 days) to capture early planners.
- Monitor your own booking lead times against these Planaltina averages to identify opportunities for dynamic pricing adjustments.
Popular & Essential Airbnb Amenities in Planaltina (2026)
Amenity Prevalence
Amenity Insights for Planaltina
- Popular amenities like Free parking on premises, Wifi, Kitchen are common but not universal. Offering these can provide a competitive edge.
- Warning: Wifi is not universally provided but is considered essential globally. Ensure reliable Wifi is offered.
Recommendations for Hosts
- Consider adding popular differentiators like Free parking on premises or Wifi to increase appeal.
- Highlight unique or less common amenities you offer (e.g., hot tub, dedicated workspace, EV charger) in your listing description and photos.
- Regularly check competitor amenities in Planaltina to stay competitive.
Planaltina Airbnb Guest Demographics & Profile Analysis (2026)
Guest Profile Summary for Planaltina
- The typical guest profile for Airbnb in Planaltina consists of primarily domestic travelers (97%), often arriving from nearby Brasília, typically belonging to the Post-2000s (Gen Z/Alpha) group (50%), primarily speaking Portuguese or English.
- Domestic travelers account for 97.3% of guests.
- Key international markets include Brazil (97.3%) and Argentina (0.9%).
- Top languages spoken are Portuguese (48%) followed by English (29.3%).
- A significant demographic segment is the Post-2000s (Gen Z/Alpha) group, representing 50% of guests.
Recommendations for Hosts
- Target domestic marketing efforts towards travelers from Brasília and Brasilia.
- Tailor amenities and listing descriptions to appeal to the dominant Post-2000s (Gen Z/Alpha) demographic (e.g., highlight fast WiFi, smart home features, local guides).
- Highlight unique local experiences or amenities relevant to the primary guest profile.
- Consider seasonal promotions aligned with peak travel times for key origin markets.
Nearby Short-Term Rental Market Comparison
How does the Planaltina Airbnb market stack up against its neighbors? Compare key performance metrics like average monthly revenue, ADR, and occupancy rates in surrounding areas to understand the broader regional STR landscape.
| Market | Active Properties | Monthly Revenue | Daily Rate | Avg. Occupancy |
|---|---|---|---|---|
| Paranoá | 40 | $1,283 | $123.23 | 40% |
| Jardim Botânico | 56 | $994 | $105.50 | 39% |
| Pirenópolis | 1,571 | $848 | $122.51 | 28% |
| Alexânia | 119 | $826 | $157.61 | 23% |
| Santa Maria | 15 | $758 | $146.58 | 23% |
| Park Way | 25 | $751 | $91.48 | 28% |
| Ceilândia | 20 | $746 | $92.42 | 42% |
| Plano Piloto | 2,448 | $671 | $62.73 | 46% |
| Sobradinho | 80 | $661 | $103.99 | 33% |
| São Sebastião | 51 | $651 | $83.71 | 32% |