Park Way Airbnb Market Analysis 2026: Short Term Rental Data & Vacation Rental Statistics in Federal District, Brazil
Is Airbnb profitable in Park Way in 2026? Explore comprehensive Airbnb analytics for Park Way, Federal District, Brazil to uncover income potential. This 2026 STR market report for Park Way, based on AirROI data from February 2025 to January 2026, reveals key trends in the niche market of 25 active listings.
Whether you're considering an Airbnb investment in Park Way, optimizing your existing vacation rental, or exploring rental arbitrage opportunities, understanding the Park Way Airbnb data is crucial. Leveraging the low regulation environment is key to maximizing your short term rental income potential. Let's dive into the specifics.
Key Park Way Airbnb Performance Metrics Overview
Monthly Airbnb Revenue Variations & Income Potential in Park Way (2026)
Understanding the monthly revenue variations for Airbnb listings in Park Way is key to maximizing your short term rental income potential. Seasonality significantly impacts earnings. Our analysis, based on data from the past 12 months, shows that the peak revenue month for STRs in Park Way is typically November, while January often presents the lowest earnings, highlighting opportunities for strategic pricing adjustments during shoulder and low seasons. Explore the typical Airbnb income in Park Way across different performance tiers:
- Best-in-class properties (Top 10%) achieve $3,108+ monthly, often utilizing dynamic pricing and superior guest experiences.
- Strong performing properties (Top 25%) earn $1,414 or more, indicating effective management and desirable locations/amenities.
- Typical properties (Median) generate around $494 per month, representing the average market performance.
- Entry-level properties (Bottom 25%) see earnings around $193, often with potential for optimization.
Average Monthly Airbnb Earnings Trend in Park Way
Park Way Airbnb Occupancy Rate Trends (2026)
Maximize your bookings by understanding the Park Way STR occupancy trends. Seasonal demand shifts significantly influence how often properties are booked. Typically, Novembersees the highest demand (peak season occupancy), while January experiences the lowest (low season). Effective strategies, like adjusting minimum stays or offering promotions, can boost occupancy during slower periods. Here's how different property tiers perform in Park Way:
- Best-in-class properties (Top 10%) achieve 75%+ occupancy, indicating high desirability and potentially optimized availability.
- Strong performing properties (Top 25%) maintain 49% or higher occupancy, suggesting good market fit and guest satisfaction.
- Typical properties (Median) have an occupancy rate around 19%.
- Entry-level properties (Bottom 25%) average 10% occupancy, potentially facing higher vacancy.
Average Monthly Occupancy Rate Trend in Park Way
Average Daily Rate (ADR) Airbnb Trends in Park Way (2026)
Effective short term rental pricing strategy in Park Way involves understanding monthly ADR fluctuations. The Average Daily Rate (ADR) for Airbnb in Park Way typically peaks in June and dips lowest during February. Leveraging Airbnb dynamic pricing tools or strategies based on this seasonality can significantly boost revenue. Here's a look at the typical nightly rates achieved:
- Best-in-class properties (Top 10%) command rates of $179+ per night, often due to premium features or locations.
- Strong performing properties (Top 25%) achieve nightly rates of $88 or more.
- Typical properties (Median) charge around $53 per night.
- Entry-level properties (Bottom 25%) earn around $41 per night.
Average Daily Rate (ADR) Trend by Month in Park Way
Get Live Park Way Market Intelligence 👇

Explore Real-time Analytics
Airbnb Seasonality Analysis & Trends in Park Way (2026)
Peak Season (November, April, August)
- Revenue averages $1,280 per month
- Occupancy rates average 38.5%
- Daily rates average $85
Shoulder Season
- Revenue averages $1,061 per month
- Occupancy maintains around 30.5%
- Daily rates hold near $86
Low Season (January, February, September)
- Revenue drops to average $930 per month
- Occupancy decreases to average 27.4%
- Daily rates adjust to average $83
Seasonality Insights for Park Way
- The Airbnb seasonality in Park Way shows moderate seasonality with distinct peak and low periods. While the sections above show seasonal averages, it's also insightful to look at the extremes:
- During the high season, the absolute peak month showcases Park Way's highest earning potential, with monthly revenues capable of climbing to $1,363, occupancy reaching a high of 44.0%, and ADRs peaking at $89.
- Conversely, the slowest single month of the year, typically falling within the low season, marks the market's lowest point. In this month, revenue might dip to $902, occupancy could drop to 25.2%, and ADRs may adjust down to $79.
- Understanding both the seasonal averages and these monthly peaks and troughs in revenue, occupancy, and ADR is crucial for maximizing your Airbnb profit potential in Park Way.
Seasonal Strategies for Maximizing Profit
- Peak Season: Maximize revenue through premium pricing and potentially longer minimum stays. Ensure high availability.
- Low Season: Offer competitive pricing, special promotions (e.g., extended stay discounts), and flexible cancellation policies. Target off-season travelers like remote workers or budget-conscious guests.
- Shoulder Seasons: Implement dynamic pricing that balances peak and low rates. Target weekend travelers or specific events. Offer slightly more flexible terms than peak season.
- Regularly analyze your own performance against these Park Way seasonality benchmarks and adjust your pricing and availability strategy accordingly.
Best Areas for Airbnb Investment in Park Way (2026)
Exploring the top neighborhoods for short-term rentals in Park Way? This section highlights key areas, outlining why they are attractive for hosts and guests, along with notable local attractions. Consider these locations based on your target guest profile and investment strategy.
| Neighborhood / Area | Why Host Here? (Target Guests & Appeal) | Key Attractions & Landmarks |
|---|---|---|
| Asa Sul | A prime location known for its upscale residential areas and proximity to cultural attractions. It is popular among both locals and tourists who appreciate its parks and shopping options. | Parque da Cidade, Catedral Metropolitana, Palácio da Alvorada, Shopping Conjunto Nacional, Teatro Nacional Cláudio Santoro |
| Asa Norte | Similar to Asa Sul, but with a different vibe. It has a mix of residential and commercial spaces, attracting visitors who enjoy its diverse dining options and nightlife. | Lago Paranoá, Feira da ASA Norte, Parque Olhos d'Água, Shopping Iguatemi, Universidade de Brasília |
| Plano Piloto | The heart of Brasília known for its modernist architecture and design. A must-visit for tourists interested in architecture and history. Offers unique Airbnb options in a culturally rich area. | Congresso Nacional, Palácio do Planalto, Catedral Metropolitana de Brasília, Museu da Cidade, Jardim Botânico de Brasília |
| Sudoeste | A well-planned residential area that is gaining popularity among tourists for its peaceful ambiance and proximity to parks and restaurants. | Parque da Cidade Sarah Kubitschek, Feira de Artesanato da CIDADE','Bancos no Sudoeste','Praça do Relógio, Restaurantes e bares regionais |
| Noroeste | An emerging neighborhood with a young and vibrant atmosphere. It is popular for its new developments and modern living, appealing to a younger demographic. | Parque Burle Marx, Shopping Norte, Lago do Noroeste, Feira do Noroeste |
| Taguatinga | A large neighborhood known for its shopping and dining experiences, Taguatinga is attractive to tourists looking to experience local culture and lifestyle. | Taguaparque, Shopping Taguatinga, Igreja São Paulo, Estádio Nacional Mané Garrincha |
| Gama | A historic area offering a more rural vibe with local culture. It appeals to those looking for a unique Airbnb experience away from the city bustle. | Cachoeira do Gama, Quintal do Gama, Parque Ecológico do Gama, Igreja São Sebastião, Feira do Gama |
| Ceilândia | Known for its rich cultural diversity and local markets, Ceilândia is a great place for travelers interested in experiencing the authentic grassroots vibe of the Federal District. | Feira do Setor O, Igreja dos Tios, Estádio de Ceilândia, Parque da Escola, Cinemas e teatros locais |
Understanding Airbnb License Requirements & STR Laws in Park Way (2026)
While Park Way, Federal District, Brazil currently shows low STR regulations, specific Airbnb license requirements might still exist or change. Always verify the latest short term rental regulations and Airbnb license requirements directly with local government authorities for Park Way to ensure full compliance before hosting.
(Source: AirROI data, 2026, finding no licensed listings among those analyzed)
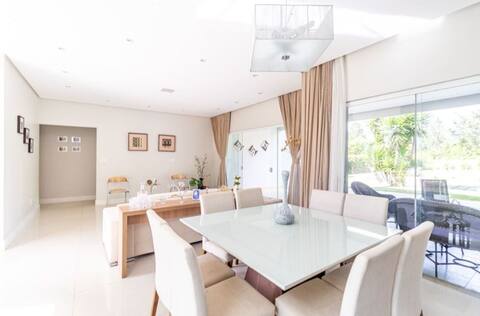
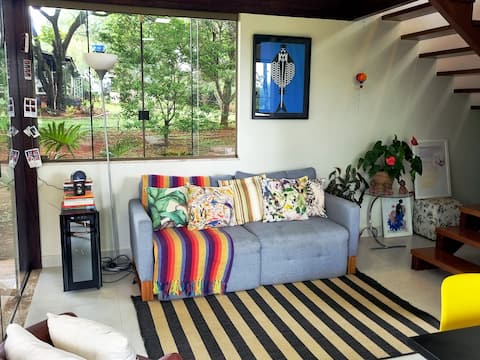
Top Performing Airbnb Properties in Park Way (2026)
Benchmark your potential! Explore examples of top-performing Airbnb properties in Park Waybased on Trailing Twelve Month (TTM) revenue. Analyze their characteristics, revenue, occupancy rate, and ADR to understand what drives success in this market.

Casa Park Way 28 Living in harmony with Nature
Entire Place • 6 bedrooms
House in Brasília Federal District
Entire Place • 4 bedrooms

Comfortable, spacious mansion for leisure and work
Entire Place • 8 bedrooms
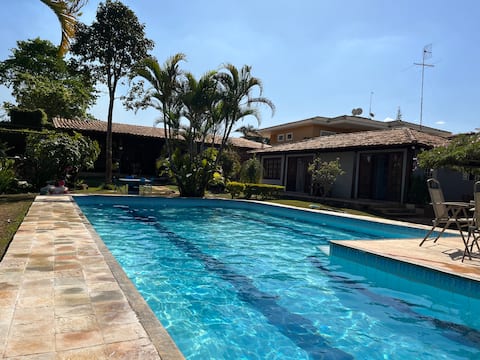
Cottage with pool and barbecue area on Park Way
Entire Place • 2 bedrooms

Casa Jardim (10 minutes from the airport)
Entire Place • 1 bedroom
1-bedroom HOUSE on Park Way 10 minutes from the airport
Entire Place • 1 bedroom
Note: Performance varies based on location, size, amenities, seasonality, and management quality. Data reflects the past 12 months.
Top Performing Airbnb Hosts in Park Way (2026)
Learn from the best! This table showcases top-performing Airbnb hosts in Park Way based on the number of properties managed and estimated total revenue over the past year. Analyze their scale and performance metrics.
| Host Name | Properties | Grossing Revenue | Stay Reviews | Avg Rating |
|---|---|---|---|---|
| Eliane | 1 | $55,340 | 76 | 4.99/5.0 |
| Maurício | 1 | $37,511 | 42 | 4.88/5.0 |
| Alberto | 2 | $31,185 | 15 | 5.00/5.0 |
| Bernardo | 1 | $15,266 | 117 | 4.82/5.0 |
| Cristiane | 1 | $12,150 | 37 | 4.97/5.0 |
| Clara | 1 | $12,097 | 24 | 4.96/5.0 |
| Naira | 1 | $9,580 | 12 | 5.00/5.0 |
| Rafaela Orlandini | 3 | $9,343 | 312 | 4.88/5.0 |
| Cerrado Experience | 1 | $9,261 | 80 | 4.95/5.0 |
| Flavia | 3 | $8,518 | 134 | 4.93/5.0 |
Analyzing the strategies of top hosts, such as their property selection, pricing, and guest communication, can offer valuable lessons for optimizing your own Airbnb operations in Park Way.
Dive Deeper: Advanced Park Way STR Market Data (2026)
Ready to unlock more insights? AirROI provides access to advanced metrics and comprehensive Airbnb data for Park Way. Explore detailed analytics beyond this report to refine your investment strategy, optimize pricing, and maximize your vacation rental profits.
Explore Advanced MetricsPark Way Short-Term Rental Market Composition (2026): Property & Room Types
Room Type Distribution
Property Type Distribution
Market Composition Insights for Park Way
- The Park Way Airbnb market composition is heavily skewed towards Entire Home/Apt listings, which make up 84% of the 25 active rentals. This indicates strong guest preference for privacy and space.
- Looking at the property type distribution in Park Way, House properties are the most common (80%), reflecting the local real estate landscape.
- Houses represent a significant 80% portion, catering likely to families or larger groups.
- The presence of 8% Hotel/Boutique listings indicates integration with traditional hospitality.
- Smaller segments like outdoor/unique (combined 4.0%) offer potential for unique stay experiences.
Park Way Airbnb Room Capacity Analysis (2026): Bedroom Distribution
Distribution of Listings by Number of Bedrooms
Room Capacity Insights for Park Way
- The dominant room capacity in Park Way is 1 bedroom listings, making up 32% of the market. This suggests a strong demand for properties suitable for couples or solo travelers.
- Together, 1 bedroom and 2 bedrooms properties represent 52.0% of the active Airbnb listings in Park Way, indicating a high concentration in these sizes.
- A significant 36.0% of listings offer 3+ bedrooms, catering to larger groups and families seeking more space in Park Way.
Park Way Vacation Rental Guest Capacity Trends (2026)
Distribution of Listings by Guest Capacity
Guest Capacity Insights for Park Way
- The most common guest capacity trend in Park Way vacation rentals is listings accommodating 2 guests (32%). This suggests the primary traveler segment is likely couples or solo travelers.
- Properties designed for 2 guests and 8+ guests dominate the Park Way STR market, accounting for 48.0% of listings.
- 36.0% of properties accommodate 6+ guests, serving the market segment for larger families or group travel in Park Way.
- On average, properties in Park Way are equipped to host 4.0 guests.
Park Way Airbnb Booking Patterns (2026): Available vs. Booked Days
Available Days Distribution
Booked Days Distribution
Booking Pattern Insights for Park Way
- The most common availability pattern in Park Way falls within the 271-366 days range, representing 64% of listings. This suggests many properties have significant open periods on their calendars.
- Approximately 88.0% of listings show high availability (181+ days open annually), indicating potential for increased bookings or specific owner usage patterns.
- For booked days, the 91-180 days range is most frequent in Park Way (32%), reflecting common guest stay durations or potential owner blocking patterns.
- A notable 12.0% of properties secure long booking periods (181+ days booked per year), highlighting successful long-term rental strategies or significant owner usage.
Park Way Airbnb Minimum Stay Requirements Analysis
Distribution of Listings by Minimum Night Requirement
1 Night
17 listings
68% of total
2 Nights
3 listings
12% of total
3 Nights
2 listings
8% of total
30+ Nights
3 listings
12% of total
Key Insights
- The most prevalent minimum stay requirement in Park Way is 1 Night, adopted by 68% of listings. This highlights the market's preference for shorter, flexible bookings.
- A strong majority (80.0%) of the Park Way Airbnb data shows acceptance of very short stays (1-2 nights), indicating a dynamic, high-turnover market.
- A significant segment (12%) caters to monthly stays (30+ nights) in Park Way, pointing to opportunities in the extended-stay market.
Recommendations
- Align with the market by considering a 1 Night minimum stay, as 68% of Park Way hosts use this setting.
- Explore offering discounts for stays of 30+ nights to attract the 12% of the market seeking extended stays.
- Adjust minimum nights based on seasonality – potentially shorter during low season and longer during peak demand periods in Park Way.
Park Way Airbnb Cancellation Policy Trends Analysis (2026)
Flexible
5 listings
20% of total
Moderate
5 listings
20% of total
Firm
12 listings
48% of total
Strict
3 listings
12% of total
Cancellation Policy Insights for Park Way
- The prevailing Airbnb cancellation policy trend in Park Way is Firm, used by 48% of listings.
- A majority (60.0%) of hosts in Park Way utilize Firm or Strict policies, indicating a market where hosts prioritize booking security.
Recommendations for Hosts
- Consider adopting a Firm policy to align with the 48% market standard in Park Way.
- Using a Strict policy might deter some guests, as only 12% of listings use it. Evaluate if potential revenue protection outweighs possible lower booking rates.
- Regularly review your cancellation policy against competitors and market demand shifts in Park Way.
Park Way STR Booking Lead Time Analysis (2026)
Average Booking Lead Time by Month
Booking Lead Time Insights for Park Way
- The overall average booking lead time for vacation rentals in Park Way is 22 days.
- Guests book furthest in advance for stays during January (average 32 days), likely coinciding with peak travel demand or local events.
- The shortest booking windows occur for stays in March (average 5 days), indicating more last-minute travel plans during this time.
- Seasonally, Winter (24 days avg.) sees the longest lead times, while Fall (12 days avg.) has the shortest, reflecting typical travel planning cycles.
Recommendations for Hosts
- Use the overall average lead time (22 days) as a baseline for your pricing and availability strategy in Park Way.
- During March, focus on last-minute booking availability and promotions, as guests book with very short notice (5 days avg.).
- Target marketing efforts for the Winter season well in advance (at least 24 days) to capture early planners.
- Monitor your own booking lead times against these Park Way averages to identify opportunities for dynamic pricing adjustments.
Popular & Essential Airbnb Amenities in Park Way (2026)
Amenity Prevalence
Amenity Insights for Park Way
- Essential amenities in Park Way that guests expect include: Dishes and silverware, Wifi, Backyard, Free parking on premises, TV. Lacking these (any) could significantly impact bookings.
- Popular amenities like Kitchen, Bed linens, Refrigerator are common but not universal. Offering these can provide a competitive edge.
Recommendations for Hosts
- Ensure your listing includes all essential amenities for Park Way: Dishes and silverware, Wifi, Backyard, Free parking on premises, TV.
- Prioritize adding missing essentials: TV.
- Consider adding popular differentiators like Kitchen or Bed linens to increase appeal.
- Highlight unique or less common amenities you offer (e.g., hot tub, dedicated workspace, EV charger) in your listing description and photos.
- Regularly check competitor amenities in Park Way to stay competitive.
Park Way Airbnb Guest Demographics & Profile Analysis (2026)
Guest Profile Summary for Park Way
- The typical guest profile for Airbnb in Park Way consists of primarily domestic travelers (92%), often arriving from nearby Brasília, typically belonging to the Post-2000s (Gen Z/Alpha) group (50%), primarily speaking Portuguese or English.
- Domestic travelers account for 91.8% of guests.
- Key international markets include Brazil (91.8%) and United States (5.5%).
- Top languages spoken are Portuguese (38.9%) followed by English (33.3%).
- A significant demographic segment is the Post-2000s (Gen Z/Alpha) group, representing 50% of guests.
Recommendations for Hosts
- Target domestic marketing efforts towards travelers from Brasília and Brasilia.
- Tailor amenities and listing descriptions to appeal to the dominant Post-2000s (Gen Z/Alpha) demographic (e.g., highlight fast WiFi, smart home features, local guides).
- Highlight unique local experiences or amenities relevant to the primary guest profile.
- Consider seasonal promotions aligned with peak travel times for key origin markets.
Nearby Short-Term Rental Market Comparison
How does the Park Way Airbnb market stack up against its neighbors? Compare key performance metrics like average monthly revenue, ADR, and occupancy rates in surrounding areas to understand the broader regional STR landscape.
| Market | Active Properties | Monthly Revenue | Daily Rate | Avg. Occupancy |
|---|---|---|---|---|
| Paranoá | 40 | $1,283 | $123.23 | 40% |
| Jardim Botânico | 56 | $994 | $105.50 | 39% |
| Pirenópolis | 1,571 | $848 | $122.51 | 28% |
| Alexânia | 119 | $826 | $157.61 | 23% |
| Santa Maria | 15 | $758 | $146.58 | 23% |
| Ceilândia | 20 | $746 | $92.42 | 42% |
| Planaltina | 19 | $672 | $116.12 | 31% |
| Plano Piloto | 2,448 | $671 | $62.73 | 46% |
| Sobradinho | 80 | $661 | $103.99 | 33% |
| São Sebastião | 51 | $651 | $83.71 | 32% |