Paranoá Airbnb Market Analysis 2026: Short Term Rental Data & Vacation Rental Statistics in Federal District, Brazil
Is Airbnb profitable in Paranoá in 2026? Explore comprehensive Airbnb analytics for Paranoá, Federal District, Brazil to uncover income potential. This 2026 STR market report for Paranoá, based on AirROI data from February 2025 to January 2026, reveals key trends in the niche market of 40 active listings.
Whether you're considering an Airbnb investment in Paranoá, optimizing your existing vacation rental, or exploring rental arbitrage opportunities, understanding the Paranoá Airbnb data is crucial. Leveraging the low regulation environment is key to maximizing your short term rental income potential. Let's dive into the specifics.
Key Paranoá Airbnb Performance Metrics Overview
Monthly Airbnb Revenue Variations & Income Potential in Paranoá (2026)
Understanding the monthly revenue variations for Airbnb listings in Paranoá is key to maximizing your short term rental income potential. Seasonality significantly impacts earnings. Our analysis, based on data from the past 12 months, shows that the peak revenue month for STRs in Paranoá is typically December, while February often presents the lowest earnings, highlighting opportunities for strategic pricing adjustments during shoulder and low seasons. Explore the typical Airbnb income in Paranoá across different performance tiers:
- Best-in-class properties (Top 10%) achieve $3,760+ monthly, often utilizing dynamic pricing and superior guest experiences.
- Strong performing properties (Top 25%) earn $2,426 or more, indicating effective management and desirable locations/amenities.
- Typical properties (Median) generate around $1,026 per month, representing the average market performance.
- Entry-level properties (Bottom 25%) see earnings around $518, often with potential for optimization.
Average Monthly Airbnb Earnings Trend in Paranoá
Paranoá Airbnb Occupancy Rate Trends (2026)
Maximize your bookings by understanding the Paranoá STR occupancy trends. Seasonal demand shifts significantly influence how often properties are booked. Typically, Novembersees the highest demand (peak season occupancy), while February experiences the lowest (low season). Effective strategies, like adjusting minimum stays or offering promotions, can boost occupancy during slower periods. Here's how different property tiers perform in Paranoá:
- Best-in-class properties (Top 10%) achieve 76%+ occupancy, indicating high desirability and potentially optimized availability.
- Strong performing properties (Top 25%) maintain 59% or higher occupancy, suggesting good market fit and guest satisfaction.
- Typical properties (Median) have an occupancy rate around 40%.
- Entry-level properties (Bottom 25%) average 22% occupancy, potentially facing higher vacancy.
Average Monthly Occupancy Rate Trend in Paranoá
Average Daily Rate (ADR) Airbnb Trends in Paranoá (2026)
Effective short term rental pricing strategy in Paranoá involves understanding monthly ADR fluctuations. The Average Daily Rate (ADR) for Airbnb in Paranoá typically peaks in December and dips lowest during February. Leveraging Airbnb dynamic pricing tools or strategies based on this seasonality can significantly boost revenue. Here's a look at the typical nightly rates achieved:
- Best-in-class properties (Top 10%) command rates of $249+ per night, often due to premium features or locations.
- Strong performing properties (Top 25%) achieve nightly rates of $149 or more.
- Typical properties (Median) charge around $90 per night.
- Entry-level properties (Bottom 25%) earn around $49 per night.
Average Daily Rate (ADR) Trend by Month in Paranoá
Get Live Paranoá Market Intelligence 👇

Explore Real-time Analytics
Airbnb Seasonality Analysis & Trends in Paranoá (2026)
Peak Season (December, March, July)
- Revenue averages $2,150 per month
- Occupancy rates average 44.4%
- Daily rates average $126
Shoulder Season
- Revenue averages $1,705 per month
- Occupancy maintains around 42.5%
- Daily rates hold near $124
Low Season (February, August, September)
- Revenue drops to average $1,437 per month
- Occupancy decreases to average 37.4%
- Daily rates adjust to average $115
Seasonality Insights for Paranoá
- The Airbnb seasonality in Paranoá shows moderate seasonality with distinct peak and low periods. While the sections above show seasonal averages, it's also insightful to look at the extremes:
- During the high season, the absolute peak month showcases Paranoá's highest earning potential, with monthly revenues capable of climbing to $2,399, occupancy reaching a high of 48.6%, and ADRs peaking at $145.
- Conversely, the slowest single month of the year, typically falling within the low season, marks the market's lowest point. In this month, revenue might dip to $1,274, occupancy could drop to 35.8%, and ADRs may adjust down to $105.
- Understanding both the seasonal averages and these monthly peaks and troughs in revenue, occupancy, and ADR is crucial for maximizing your Airbnb profit potential in Paranoá.
Seasonal Strategies for Maximizing Profit
- Peak Season: Maximize revenue through premium pricing and potentially longer minimum stays. Ensure high availability.
- Low Season: Offer competitive pricing, special promotions (e.g., extended stay discounts), and flexible cancellation policies. Target off-season travelers like remote workers or budget-conscious guests.
- Shoulder Seasons: Implement dynamic pricing that balances peak and low rates. Target weekend travelers or specific events. Offer slightly more flexible terms than peak season.
- Regularly analyze your own performance against these Paranoá seasonality benchmarks and adjust your pricing and availability strategy accordingly.
Best Areas for Airbnb Investment in Paranoá (2026)
Exploring the top neighborhoods for short-term rentals in Paranoá? This section highlights key areas, outlining why they are attractive for hosts and guests, along with notable local attractions. Consider these locations based on your target guest profile and investment strategy.
| Neighborhood / Area | Why Host Here? (Target Guests & Appeal) | Key Attractions & Landmarks |
|---|---|---|
| Lago Paranoá | A beautiful man-made lake that is the centerpiece of Paranoá, offering water sports, scenic views, and relaxation opportunities. Attracts both locals and tourists seeking leisure activities and waterfront experiences. | Parque da Cidade Sarah Kubitschek, Clube do Lago, Praia do Pontão, Ilha do Lago, Caminho dos Pioneiros |
| Setor de Mansões | An upscale neighborhood featuring luxurious homes and green spaces, appealing to those looking for a peaceful retreat while still being close to city amenities. | Jardim Botânico de Brasília, Museu de Valores, Ponte JK, Praça dos Três Poderes, Palácio da Alvorada |
| Avenida do Planalto | A busy avenue that connects several important areas of Paranoá, providing convenience for guests to access shops, restaurants, and local attractions. | Centro Comercial, Estádio Bezerrão, Parque da Cidade, Feira dos Importados |
| Paranoá Waterfront | Directly along the shores of Lago Paranoá, providing stunning sunrise and sunset views, perfect for guests seeking a picturesque and serene environment. | Restaurantes com vista para o lago, Eventos e festivais ao ar livre, Locais para piquenique, Espaços para camping |
| Setor de Recreio | Known for its recreational areas and parks, ideal for families and those looking to enjoy outdoor activities and nature. | Parque dos Ipes, Parque Ecológico do Descobrimento, trilhas para caminhada, áreas de lazer |
| Centro de Paranoá | The heart of the town with essential services and local culture, attractive to tourists who wish to experience the local lifestyle. | Igreja de São Sebastião, Mercado Municipal, porteira da cidade, eventos culturais locais |
| Setor de Chácaras | An area with large plots and green spaces, popular for those seeking a rural feel while still being accessible to urban conveniences. | Chácaras e sítios, Feiras de produtos orgânicos, Caminhadas por trilhas rurais |
| Parque Nacional de Brasília | Nearby natural reserve, offering a chance for guests to connect with nature and explore the unique Brazilian flora and fauna. | Caminhadas e trilhas, observação de aves, espelhos d'água, pontos para piquenique |
Understanding Airbnb License Requirements & STR Laws in Paranoá (2026)
While Paranoá, Federal District, Brazil currently shows low STR regulations, specific Airbnb license requirements might still exist or change. Always verify the latest short term rental regulations and Airbnb license requirements directly with local government authorities for Paranoá to ensure full compliance before hosting.
(Source: AirROI data, 2026, finding no licensed listings among those analyzed)
Top Performing Airbnb Properties in Paranoá (2026)
Benchmark your potential! Explore examples of top-performing Airbnb properties in Paranoábased on Trailing Twelve Month (TTM) revenue. Analyze their characteristics, revenue, occupancy rate, and ADR to understand what drives success in this market.
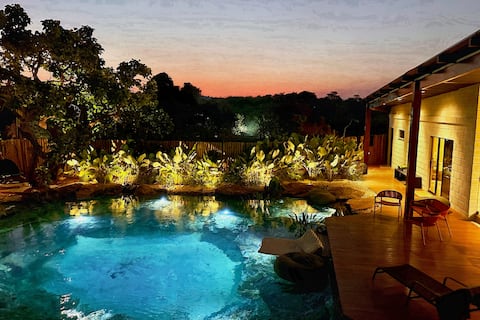
Natural Pool 2 Suites Mawê Falls
Entire Place • 2 bedrooms
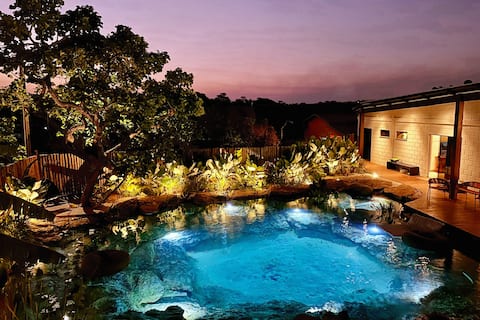
Natural Pool Suite Casal Mawê Falls
Entire Place • 1 bedroom

Microcasa Brasília lakefront incredible view hydro
Entire Place • 1 bedroom
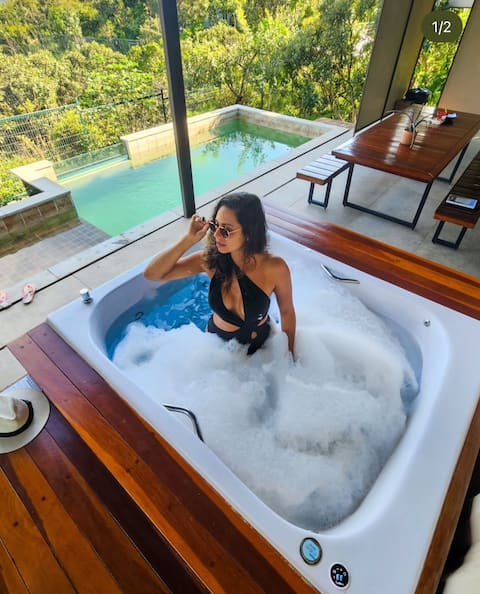
Ipê Amendoim Bathtub and pool with a view
Entire Place • 1 bedroom
Cabana Ipê - Mountain Refuge
Entire Place • 1 bedroom

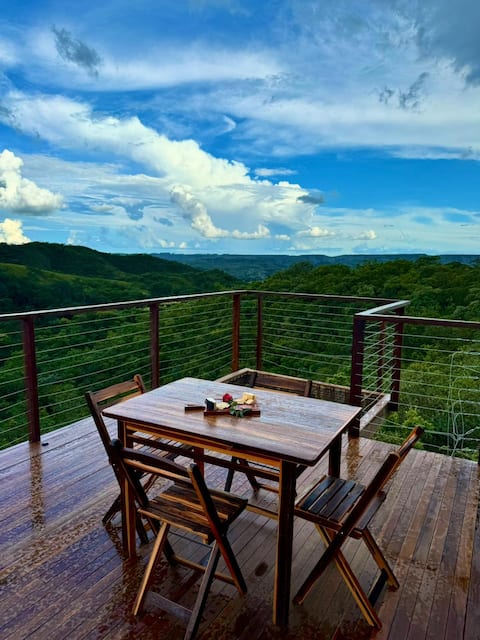
Ipê Tabaco Perfect view, sunset and bathtub
Entire Place • 2 bedrooms
Note: Performance varies based on location, size, amenities, seasonality, and management quality. Data reflects the past 12 months.
Top Performing Airbnb Hosts in Paranoá (2026)
Learn from the best! This table showcases top-performing Airbnb hosts in Paranoá based on the number of properties managed and estimated total revenue over the past year. Analyze their scale and performance metrics.
| Host Name | Properties | Grossing Revenue | Stay Reviews | Avg Rating |
|---|---|---|---|---|
| Vale Dos Ipês | 6 | $169,876 | 819 | 4.91/5.0 |
| Ana Maria | 2 | $163,415 | 102 | 4.95/5.0 |
| Rafaela Orlandini | 1 | $38,609 | 296 | 4.93/5.0 |
| Rodrigo Lins | 1 | $37,940 | 7 | 5.00/5.0 |
| Ygna Victory | 1 | $31,202 | 63 | 4.87/5.0 |
| Ádamo | 3 | $27,723 | 266 | 4.83/5.0 |
| Victor Gabriel | 1 | $21,712 | 30 | 4.93/5.0 |
| Daniel | 2 | $18,456 | 217 | 4.98/5.0 |
| Simone | 1 | $14,228 | 89 | 4.89/5.0 |
| Angela | 1 | $14,219 | 156 | 4.85/5.0 |
Analyzing the strategies of top hosts, such as their property selection, pricing, and guest communication, can offer valuable lessons for optimizing your own Airbnb operations in Paranoá.
Dive Deeper: Advanced Paranoá STR Market Data (2026)
Ready to unlock more insights? AirROI provides access to advanced metrics and comprehensive Airbnb data for Paranoá. Explore detailed analytics beyond this report to refine your investment strategy, optimize pricing, and maximize your vacation rental profits.
Explore Advanced MetricsParanoá Short-Term Rental Market Composition (2026): Property & Room Types
Room Type Distribution
Property Type Distribution
Market Composition Insights for Paranoá
- The Paranoá Airbnb market composition is heavily skewed towards Entire Home/Apt listings, which make up 95% of the 40 active rentals. This indicates strong guest preference for privacy and space.
- Looking at the property type distribution in Paranoá, House properties are the most common (50%), reflecting the local real estate landscape.
- Houses represent a significant 50% portion, catering likely to families or larger groups.
- The presence of 17.5% Hotel/Boutique listings indicates integration with traditional hospitality.
Paranoá Airbnb Room Capacity Analysis (2026): Bedroom Distribution
Distribution of Listings by Number of Bedrooms
Room Capacity Insights for Paranoá
- The dominant room capacity in Paranoá is 1 bedroom listings, making up 37.5% of the market. This suggests a strong demand for properties suitable for couples or solo travelers.
- Together, 1 bedroom and 2 bedrooms properties represent 72.5% of the active Airbnb listings in Paranoá, indicating a high concentration in these sizes.
Paranoá Vacation Rental Guest Capacity Trends (2026)
Distribution of Listings by Guest Capacity
Guest Capacity Insights for Paranoá
- The most common guest capacity trend in Paranoá vacation rentals is listings accommodating 8+ guests (25%). This suggests the primary traveler segment is likely larger groups.
- Properties designed for 8+ guests and 4 guests dominate the Paranoá STR market, accounting for 45.0% of listings.
- 35.0% of properties accommodate 6+ guests, serving the market segment for larger families or group travel in Paranoá.
- On average, properties in Paranoá are equipped to host 4.5 guests.
Paranoá Airbnb Booking Patterns (2026): Available vs. Booked Days
Available Days Distribution
Booked Days Distribution
Booking Pattern Insights for Paranoá
- The most common availability pattern in Paranoá falls within the 271-366 days range, representing 42.5% of listings. This suggests many properties have significant open periods on their calendars.
- Approximately 80.0% of listings show high availability (181+ days open annually), indicating potential for increased bookings or specific owner usage patterns.
- For booked days, the 91-180 days range is most frequent in Paranoá (37.5%), reflecting common guest stay durations or potential owner blocking patterns.
- A notable 20.0% of properties secure long booking periods (181+ days booked per year), highlighting successful long-term rental strategies or significant owner usage.
Paranoá Airbnb Minimum Stay Requirements Analysis
Distribution of Listings by Minimum Night Requirement
1 Night
22 listings
55% of total
2 Nights
8 listings
20% of total
3 Nights
4 listings
10% of total
4-6 Nights
2 listings
5% of total
30+ Nights
4 listings
10% of total
Key Insights
- The most prevalent minimum stay requirement in Paranoá is 1 Night, adopted by 55% of listings. This highlights the market's preference for shorter, flexible bookings.
- A strong majority (75.0%) of the Paranoá Airbnb data shows acceptance of very short stays (1-2 nights), indicating a dynamic, high-turnover market.
Recommendations
- Align with the market by considering a 1 Night minimum stay, as 55% of Paranoá hosts use this setting.
- Explore offering discounts for stays of 30+ nights to attract the 10% of the market seeking extended stays.
- Adjust minimum nights based on seasonality – potentially shorter during low season and longer during peak demand periods in Paranoá.
Paranoá Airbnb Cancellation Policy Trends Analysis (2026)
Refundable
1 listings
2.5% of total
Non-refundable
3 listings
7.5% of total
Flexible
7 listings
17.5% of total
Moderate
10 listings
25% of total
Firm
10 listings
25% of total
Strict
9 listings
22.5% of total
Cancellation Policy Insights for Paranoá
- The prevailing Airbnb cancellation policy trend in Paranoá is Moderate, used by 25% of listings.
- There's a relatively balanced mix between guest-friendly (42.5%) and stricter (47.5%) policies, offering choices for different guest needs.
Recommendations for Hosts
- Consider adopting a Moderate policy to align with the 25% market standard in Paranoá.
- Regularly review your cancellation policy against competitors and market demand shifts in Paranoá.
Paranoá STR Booking Lead Time Analysis (2026)
Average Booking Lead Time by Month
Booking Lead Time Insights for Paranoá
- The overall average booking lead time for vacation rentals in Paranoá is 29 days.
- Guests book furthest in advance for stays during September (average 42 days), likely coinciding with peak travel demand or local events.
- The shortest booking windows occur for stays in March (average 16 days), indicating more last-minute travel plans during this time.
- Seasonally, Fall (34 days avg.) sees the longest lead times, while Spring (21 days avg.) has the shortest, reflecting typical travel planning cycles.
Recommendations for Hosts
- Use the overall average lead time (29 days) as a baseline for your pricing and availability strategy in Paranoá.
- For September stays, consider implementing length-of-stay discounts or slightly higher rates for bookings made less than 42 days out to capitalize on advance planning.
- Target marketing efforts for the Fall season well in advance (at least 34 days) to capture early planners.
- Monitor your own booking lead times against these Paranoá averages to identify opportunities for dynamic pricing adjustments.
Popular & Essential Airbnb Amenities in Paranoá (2026)
Amenity Prevalence
Amenity Insights for Paranoá
- Essential amenities in Paranoá that guests expect include: Wifi, Kitchen, TV, Cooking basics. Lacking these (any) could significantly impact bookings.
- Popular amenities like Free parking on premises, Dishes and silverware, Bed linens are common but not universal. Offering these can provide a competitive edge.
Recommendations for Hosts
- Ensure your listing includes all essential amenities for Paranoá: Wifi, Kitchen, TV, Cooking basics.
- Prioritize adding missing essentials: Kitchen, TV, Cooking basics.
- Consider adding popular differentiators like Free parking on premises or Dishes and silverware to increase appeal.
- Highlight unique or less common amenities you offer (e.g., hot tub, dedicated workspace, EV charger) in your listing description and photos.
- Regularly check competitor amenities in Paranoá to stay competitive.
Paranoá Airbnb Guest Demographics & Profile Analysis (2026)
Guest Profile Summary for Paranoá
- The typical guest profile for Airbnb in Paranoá consists of primarily domestic travelers (96%), often arriving from nearby Brasília, typically belonging to the Post-2000s (Gen Z/Alpha) group (50%), primarily speaking Portuguese or English.
- Domestic travelers account for 96.0% of guests.
- Key international markets include Brazil (96%) and United States (1.2%).
- Top languages spoken are Portuguese (45.4%) followed by English (30.5%).
- A significant demographic segment is the Post-2000s (Gen Z/Alpha) group, representing 50% of guests.
Recommendations for Hosts
- Target domestic marketing efforts towards travelers from Brasília and Brasilia.
- Tailor amenities and listing descriptions to appeal to the dominant Post-2000s (Gen Z/Alpha) demographic (e.g., highlight fast WiFi, smart home features, local guides).
- Highlight unique local experiences or amenities relevant to the primary guest profile.
- Consider seasonal promotions aligned with peak travel times for key origin markets.
Nearby Short-Term Rental Market Comparison
How does the Paranoá Airbnb market stack up against its neighbors? Compare key performance metrics like average monthly revenue, ADR, and occupancy rates in surrounding areas to understand the broader regional STR landscape.
| Market | Active Properties | Monthly Revenue | Daily Rate | Avg. Occupancy |
|---|---|---|---|---|
| Jardim Botânico | 56 | $994 | $105.50 | 39% |
| Pirenópolis | 1,571 | $848 | $122.51 | 28% |
| Alexânia | 119 | $826 | $157.61 | 23% |
| Santa Maria | 15 | $758 | $146.58 | 23% |
| Park Way | 25 | $751 | $91.48 | 28% |
| Ceilândia | 20 | $746 | $92.42 | 42% |
| Planaltina | 19 | $672 | $116.12 | 31% |
| Plano Piloto | 2,448 | $671 | $62.73 | 46% |
| Sobradinho | 80 | $661 | $103.99 | 33% |
| São Sebastião | 51 | $651 | $83.71 | 32% |