Gama Airbnb Market Analysis 2026: Short Term Rental Data & Vacation Rental Statistics in Federal District, Brazil
Is Airbnb profitable in Gama in 2026? Explore comprehensive Airbnb analytics for Gama, Federal District, Brazil to uncover income potential. This 2026 STR market report for Gama, based on AirROI data from February 2025 to January 2026, reveals key trends in the niche market of 22 active listings.
Whether you're considering an Airbnb investment in Gama, optimizing your existing vacation rental, or exploring rental arbitrage opportunities, understanding the Gama Airbnb data is crucial. Leveraging the low regulation environment is key to maximizing your short term rental income potential. Let's dive into the specifics.
Key Gama Airbnb Performance Metrics Overview
Monthly Airbnb Revenue Variations & Income Potential in Gama (2026)
Understanding the monthly revenue variations for Airbnb listings in Gama is key to maximizing your short term rental income potential. Seasonality significantly impacts earnings. Our analysis, based on data from the past 12 months, shows that the peak revenue month for STRs in Gama is typically November, while August often presents the lowest earnings, highlighting opportunities for strategic pricing adjustments during shoulder and low seasons. Explore the typical Airbnb income in Gama across different performance tiers:
- Best-in-class properties (Top 10%) achieve $1,769+ monthly, often utilizing dynamic pricing and superior guest experiences.
- Strong performing properties (Top 25%) earn $1,015 or more, indicating effective management and desirable locations/amenities.
- Typical properties (Median) generate around $587 per month, representing the average market performance.
- Entry-level properties (Bottom 25%) see earnings around $346, often with potential for optimization.
Average Monthly Airbnb Earnings Trend in Gama
Gama Airbnb Occupancy Rate Trends (2026)
Maximize your bookings by understanding the Gama STR occupancy trends. Seasonal demand shifts significantly influence how often properties are booked. Typically, Augustsees the highest demand (peak season occupancy), while October experiences the lowest (low season). Effective strategies, like adjusting minimum stays or offering promotions, can boost occupancy during slower periods. Here's how different property tiers perform in Gama:
- Best-in-class properties (Top 10%) achieve 69%+ occupancy, indicating high desirability and potentially optimized availability.
- Strong performing properties (Top 25%) maintain 51% or higher occupancy, suggesting good market fit and guest satisfaction.
- Typical properties (Median) have an occupancy rate around 26%.
- Entry-level properties (Bottom 25%) average 15% occupancy, potentially facing higher vacancy.
Average Monthly Occupancy Rate Trend in Gama
Average Daily Rate (ADR) Airbnb Trends in Gama (2026)
Effective short term rental pricing strategy in Gama involves understanding monthly ADR fluctuations. The Average Daily Rate (ADR) for Airbnb in Gama typically peaks in December and dips lowest during February. Leveraging Airbnb dynamic pricing tools or strategies based on this seasonality can significantly boost revenue. Here's a look at the typical nightly rates achieved:
- Best-in-class properties (Top 10%) command rates of $194+ per night, often due to premium features or locations.
- Strong performing properties (Top 25%) achieve nightly rates of $153 or more.
- Typical properties (Median) charge around $46 per night.
- Entry-level properties (Bottom 25%) earn around $27 per night.
Average Daily Rate (ADR) Trend by Month in Gama
Get Live Gama Market Intelligence 👇

Explore Real-time Analytics
Airbnb Seasonality Analysis & Trends in Gama (2026)
Peak Season (November, December, January)
- Revenue averages $1,229 per month
- Occupancy rates average 33.7%
- Daily rates average $101
Shoulder Season
- Revenue averages $855 per month
- Occupancy maintains around 35.1%
- Daily rates hold near $87
Low Season (February, June, August)
- Revenue drops to average $614 per month
- Occupancy decreases to average 33.1%
- Daily rates adjust to average $80
Seasonality Insights for Gama
- The Airbnb seasonality in Gama shows highly seasonal trends requiring careful strategy. While the sections above show seasonal averages, it's also insightful to look at the extremes:
- During the high season, the absolute peak month showcases Gama's highest earning potential, with monthly revenues capable of climbing to $1,406, occupancy reaching a high of 38.7%, and ADRs peaking at $103.
- Conversely, the slowest single month of the year, typically falling within the low season, marks the market's lowest point. In this month, revenue might dip to $575, occupancy could drop to 24.3%, and ADRs may adjust down to $75.
- Understanding both the seasonal averages and these monthly peaks and troughs in revenue, occupancy, and ADR is crucial for maximizing your Airbnb profit potential in Gama.
Seasonal Strategies for Maximizing Profit
- Peak Season: Maximize revenue through premium pricing and potentially longer minimum stays. Ensure high availability.
- Low Season: Offer competitive pricing, special promotions (e.g., extended stay discounts), and flexible cancellation policies. Target off-season travelers like remote workers or budget-conscious guests.
- Shoulder Seasons: Implement dynamic pricing that balances peak and low rates. Target weekend travelers or specific events. Offer slightly more flexible terms than peak season.
- Regularly analyze your own performance against these Gama seasonality benchmarks and adjust your pricing and availability strategy accordingly.
Best Areas for Airbnb Investment in Gama (2026)
Exploring the top neighborhoods for short-term rentals in Gama? This section highlights key areas, outlining why they are attractive for hosts and guests, along with notable local attractions. Consider these locations based on your target guest profile and investment strategy.
| Neighborhood / Area | Why Host Here? (Target Guests & Appeal) | Key Attractions & Landmarks |
|---|---|---|
| Setor Oeste | A vibrant neighborhood with a mix of residential and commercial properties. It's close to shopping centers and has a variety of restaurants and bars, making it popular among both tourists and locals. | Park Way, Shopping Iguatemi, Igreja do Carmo, Parque da Cidade, Palácio da Alvorada |
| Setor Norte | This area features nice parks and is not far from the central region, making it attractive for those who want a more local living experience while still being close to the city attractions. | Parque Nacional de Brasília, Centro Cultural Banco do Brasil, Estádio Mane Garrincha, Catedral Metropolitana, Praça dos Três Poderes |
| Asa Sul | Known for its tree-lined streets and residential charm, Asa Sul is close to shopping, dining, and cultural attractions. It’s favored by both business travelers and families. | Estádio Nacional de Brasília, Parque da Água Mineral, Teatro Nacional, Shopping Pátio Brasil, Esplanada dos Ministérios |
| Lago Sul | An upscale neighborhood known for its beautiful views of the lake and luxurious properties. This area is sought after by tourists looking for a serene environment with access to the lake. | Lago Paranoá, Jardim Botânico, Centro de Convenções Ulysses Guimarães, Restaurantes à beira do lago, Praia do Pontão |
| Águas Claras | A rapidly developing area with a vibrant community and a mix of apartments and services. It's becoming a hotspot for younger travelers and families due to its affordability and amenities. | Parque Águas Claras, Shopping DF Plaza, Vila do Comércio, Centro Cultural, Diversos parques e praças na região |
| Taguatinga | A bustling district with a mix of residential and commercial spaces. It’s well-connected and offers a variety of entertainment options, appealing to both tourists and locals. | Taguatinga Shopping, Feira da Torre, Igreja São Paulo, Praça do Relógio, Teatro Taguatinga |
| Ceilândia | A unique blend of local culture and urban development. Popular for those looking to experience the local lifestyle and culture while still being within reach of Brasília's main attractions. | Ceilândia Centro, Catedral de Ceilândia, Parque da Cidade Estrutural, Mercado Central, Igreja do O, Feira do Sol |
| Sobradinho | A quieter area on the outskirts of Brasília, offering access to nature and a more rural lifestyle. A good option for those seeking tranquility away from the city center. | Centro de Sobradinho, Parque Natural Municipal de Sobradinho, Igreja de Nossa Senhora da Conceição, Feira de Sobradinho, Rodoviária de Sobradinho |
Understanding Airbnb License Requirements & STR Laws in Gama (2026)
While Gama, Federal District, Brazil currently shows low STR regulations, specific Airbnb license requirements might still exist or change. Always verify the latest short term rental regulations and Airbnb license requirements directly with local government authorities for Gama to ensure full compliance before hosting.
(Source: AirROI data, 2026, finding no licensed listings among those analyzed)
Top Performing Airbnb Properties in Gama (2026)
Benchmark your potential! Explore examples of top-performing Airbnb properties in Gamabased on Trailing Twelve Month (TTM) revenue. Analyze their characteristics, revenue, occupancy rate, and ADR to understand what drives success in this market.
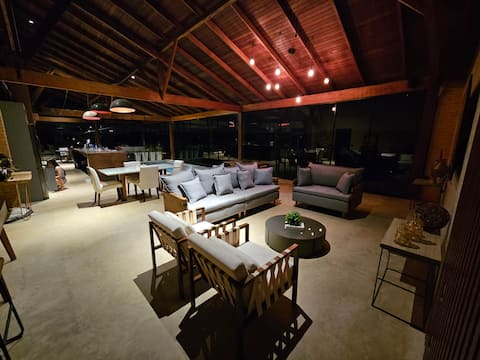
Casa de Campo Cury Estate
Entire Place • 3 bedrooms

Palmeiras Events and Day Use Space | 8:00 a.m.
Entire Place • N/A
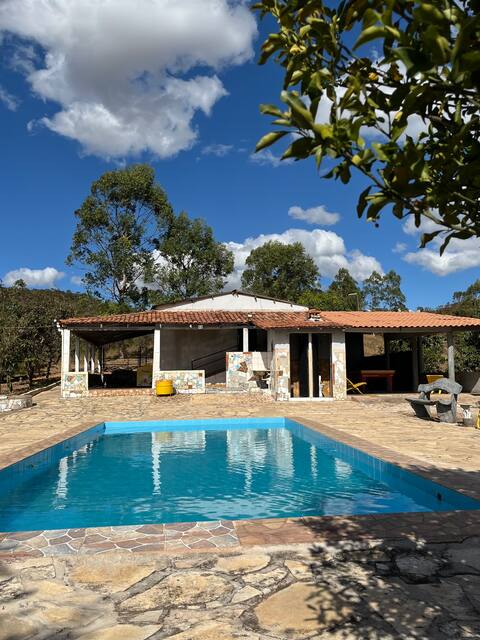
Beautiful and comfortable farmhouse, with pool.
Entire Place • 3 bedrooms
Chácara Nativa
Entire Place • 3 bedrooms

RANCHO JENIPAPO - FANTASTIC COUNTRY HOUSE
Entire Place • 4 bedrooms

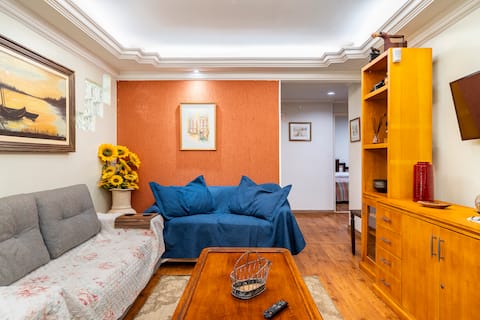
Beautiful farmhouse in Brasília
Entire Place • 2 bedrooms
Note: Performance varies based on location, size, amenities, seasonality, and management quality. Data reflects the past 12 months.
Top Performing Airbnb Hosts in Gama (2026)
Learn from the best! This table showcases top-performing Airbnb hosts in Gama based on the number of properties managed and estimated total revenue over the past year. Analyze their scale and performance metrics.
| Host Name | Properties | Grossing Revenue | Stay Reviews | Avg Rating |
|---|---|---|---|---|
| Estância Cury | 1 | $30,334 | 22 | 4.91/5.0 |
| Dayanne | 1 | $11,708 | 12 | 5.00/5.0 |
| Moacir | 1 | $10,969 | 57 | 4.96/5.0 |
| Caroline | 1 | $10,770 | 4 | 4.50/5.0 |
| Joao | 1 | $10,036 | 76 | 4.96/5.0 |
| Edmilson | 1 | $8,538 | 32 | 4.84/5.0 |
| Kennedy | 1 | $7,911 | 27 | 4.93/5.0 |
| Pamela Castro | 1 | $6,253 | 111 | 4.81/5.0 |
| Jose Adilson | 1 | $5,868 | 36 | 4.72/5.0 |
| Janio Jr Catito | 1 | $5,436 | 10 | 4.50/5.0 |
Analyzing the strategies of top hosts, such as their property selection, pricing, and guest communication, can offer valuable lessons for optimizing your own Airbnb operations in Gama.
Dive Deeper: Advanced Gama STR Market Data (2026)
Ready to unlock more insights? AirROI provides access to advanced metrics and comprehensive Airbnb data for Gama. Explore detailed analytics beyond this report to refine your investment strategy, optimize pricing, and maximize your vacation rental profits.
Explore Advanced MetricsGama Short-Term Rental Market Composition (2026): Property & Room Types
Room Type Distribution
Property Type Distribution
Market Composition Insights for Gama
- The Gama Airbnb market composition is heavily skewed towards Entire Home/Apt listings, which make up 100% of the 22 active rentals. This indicates strong guest preference for privacy and space.
- Looking at the property type distribution in Gama, House properties are the most common (68.2%), reflecting the local real estate landscape.
- Houses represent a significant 68.2% portion, catering likely to families or larger groups.
- The presence of 13.6% Hotel/Boutique listings indicates integration with traditional hospitality.
- Smaller segments like outdoor/unique (combined 4.5%) offer potential for unique stay experiences.
Gama Airbnb Room Capacity Analysis (2026): Bedroom Distribution
Distribution of Listings by Number of Bedrooms
Room Capacity Insights for Gama
- The dominant room capacity in Gama is 3 bedrooms listings, making up 27.3% of the market. This suggests a strong demand for properties suitable for families or small groups.
- Together, 3 bedrooms and 1 bedroom properties represent 54.6% of the active Airbnb listings in Gama, indicating a high concentration in these sizes.
- A significant 50.0% of listings offer 3+ bedrooms, catering to larger groups and families seeking more space in Gama.
Gama Vacation Rental Guest Capacity Trends (2026)
Distribution of Listings by Guest Capacity
Guest Capacity Insights for Gama
- The most common guest capacity trend in Gama vacation rentals is listings accommodating 8+ guests (59.1%). This suggests the primary traveler segment is likely larger groups.
- Properties designed for 8+ guests and 2 guests dominate the Gama STR market, accounting for 77.3% of listings.
- 63.6% of properties accommodate 6+ guests, serving the market segment for larger families or group travel in Gama.
- On average, properties in Gama are equipped to host 6.1 guests.
Gama Airbnb Booking Patterns (2026): Available vs. Booked Days
Available Days Distribution
Booked Days Distribution
Booking Pattern Insights for Gama
- The most common availability pattern in Gama falls within the 271-366 days range, representing 77.3% of listings. This suggests many properties have significant open periods on their calendars.
- Approximately 90.9% of listings show high availability (181+ days open annually), indicating potential for increased bookings or specific owner usage patterns.
- For booked days, the 31-90 days range is most frequent in Gama (40.9%), reflecting common guest stay durations or potential owner blocking patterns.
- A notable 9.1% of properties secure long booking periods (181+ days booked per year), highlighting successful long-term rental strategies or significant owner usage.
Gama Airbnb Minimum Stay Requirements Analysis
Distribution of Listings by Minimum Night Requirement
1 Night
9 listings
40.9% of total
2 Nights
10 listings
45.5% of total
3 Nights
1 listings
4.5% of total
7-29 Nights
1 listings
4.5% of total
30+ Nights
1 listings
4.5% of total
Key Insights
- The most prevalent minimum stay requirement in Gama is 2 Nights, adopted by 45.5% of listings. This highlights the market's preference for shorter, flexible bookings.
- A strong majority (86.4%) of the Gama Airbnb data shows acceptance of very short stays (1-2 nights), indicating a dynamic, high-turnover market.
Recommendations
- Align with the market by considering a 2 Nights minimum stay, as 45.5% of Gama hosts use this setting.
- Adjust minimum nights based on seasonality – potentially shorter during low season and longer during peak demand periods in Gama.
Gama Airbnb Cancellation Policy Trends Analysis (2026)
Flexible
9 listings
40.9% of total
Moderate
7 listings
31.8% of total
Firm
4 listings
18.2% of total
Strict
2 listings
9.1% of total
Cancellation Policy Insights for Gama
- The prevailing Airbnb cancellation policy trend in Gama is Flexible, used by 40.9% of listings.
- The market strongly favors guest-friendly terms, with 72.7% of listings offering Flexible or Moderate policies. This suggests guests in Gama may expect booking flexibility.
- Strict cancellation policies are quite rare (9.1%), potentially making listings with this policy less competitive unless justified by high demand or property type.
Recommendations for Hosts
- Consider adopting a Flexible policy to align with the 40.9% market standard in Gama.
- Using a Strict policy might deter some guests, as only 9.1% of listings use it. Evaluate if potential revenue protection outweighs possible lower booking rates.
- Regularly review your cancellation policy against competitors and market demand shifts in Gama.
Gama STR Booking Lead Time Analysis (2026)
Average Booking Lead Time by Month
Booking Lead Time Insights for Gama
- The overall average booking lead time for vacation rentals in Gama is 36 days.
- Guests book furthest in advance for stays during December (average 67 days), likely coinciding with peak travel demand or local events.
- The shortest booking windows occur for stays in February (average 13 days), indicating more last-minute travel plans during this time.
- Seasonally, Winter (36 days avg.) sees the longest lead times, while Spring (29 days avg.) has the shortest, reflecting typical travel planning cycles.
Recommendations for Hosts
- Use the overall average lead time (36 days) as a baseline for your pricing and availability strategy in Gama.
- For December stays, consider implementing length-of-stay discounts or slightly higher rates for bookings made less than 67 days out to capitalize on advance planning.
- During February, focus on last-minute booking availability and promotions, as guests book with very short notice (13 days avg.).
- Target marketing efforts for the Winter season well in advance (at least 36 days) to capture early planners.
- Monitor your own booking lead times against these Gama averages to identify opportunities for dynamic pricing adjustments.
Popular & Essential Airbnb Amenities in Gama (2026)
Amenity Prevalence
Amenity Insights for Gama
- Essential amenities in Gama that guests expect include: Kitchen. Lacking these (this) could significantly impact bookings.
- Popular amenities like Wifi, TV, Pets allowed are common but not universal. Offering these can provide a competitive edge.
- Warning: Wifi is not universally provided but is considered essential globally. Ensure reliable Wifi is offered.
Recommendations for Hosts
- Ensure your listing includes all essential amenities for Gama: Kitchen.
- Consider adding popular differentiators like Wifi or TV to increase appeal.
- Highlight unique or less common amenities you offer (e.g., hot tub, dedicated workspace, EV charger) in your listing description and photos.
- Regularly check competitor amenities in Gama to stay competitive.
Gama Airbnb Guest Demographics & Profile Analysis (2026)
Guest Profile Summary for Gama
- The typical guest profile for Airbnb in Gama consists of primarily domestic travelers (89%), often arriving from nearby Distrito Federal, typically belonging to the Post-2000s (Gen Z/Alpha) group (50%), primarily speaking Portuguese or English.
- Domestic travelers account for 88.9% of guests.
- Key international markets include Brazil (88.9%) and United States (2.2%).
- Top languages spoken are Portuguese (40.7%) followed by English (37%).
- A significant demographic segment is the Post-2000s (Gen Z/Alpha) group, representing 50% of guests.
Recommendations for Hosts
- Target domestic marketing efforts towards travelers from Distrito Federal and Brasília.
- Tailor amenities and listing descriptions to appeal to the dominant Post-2000s (Gen Z/Alpha) demographic (e.g., highlight fast WiFi, smart home features, local guides).
- Highlight unique local experiences or amenities relevant to the primary guest profile.
- Consider seasonal promotions aligned with peak travel times for key origin markets.
Nearby Short-Term Rental Market Comparison
How does the Gama Airbnb market stack up against its neighbors? Compare key performance metrics like average monthly revenue, ADR, and occupancy rates in surrounding areas to understand the broader regional STR landscape.
| Market | Active Properties | Monthly Revenue | Daily Rate | Avg. Occupancy |
|---|---|---|---|---|
| Paranoá | 40 | $1,283 | $123.23 | 40% |
| Jardim Botânico | 56 | $994 | $105.50 | 39% |
| Pirenópolis | 1,571 | $848 | $122.51 | 28% |
| Alexânia | 119 | $826 | $157.61 | 23% |
| Santa Maria | 15 | $758 | $146.58 | 23% |
| Park Way | 25 | $751 | $91.48 | 28% |
| Ceilândia | 20 | $746 | $92.42 | 42% |
| Senador Canedo | 22 | $691 | $139.79 | 25% |
| Planaltina | 19 | $672 | $116.12 | 31% |
| Plano Piloto | 2,448 | $671 | $62.73 | 46% |