Arniqueira Airbnb Market Analysis 2026: Short Term Rental Data & Vacation Rental Statistics in Federal District, Brazil
Is Airbnb profitable in Arniqueira in 2026? Explore comprehensive Airbnb analytics for Arniqueira, Federal District, Brazil to uncover income potential. This 2026 STR market report for Arniqueira, based on AirROI data from February 2025 to January 2026, reveals key trends in the niche market of 66 active listings.
Whether you're considering an Airbnb investment in Arniqueira, optimizing your existing vacation rental, or exploring rental arbitrage opportunities, understanding the Arniqueira Airbnb data is crucial. Leveraging the low regulation environment is key to maximizing your short term rental income potential. Let's dive into the specifics.
Key Arniqueira Airbnb Performance Metrics Overview
Monthly Airbnb Revenue Variations & Income Potential in Arniqueira (2026)
Understanding the monthly revenue variations for Airbnb listings in Arniqueira is key to maximizing your short term rental income potential. Seasonality significantly impacts earnings. Our analysis, based on data from the past 12 months, shows that the peak revenue month for STRs in Arniqueira is typically October, while February often presents the lowest earnings, highlighting opportunities for strategic pricing adjustments during shoulder and low seasons. Explore the typical Airbnb income in Arniqueira across different performance tiers:
- Best-in-class properties (Top 10%) achieve $1,459+ monthly, often utilizing dynamic pricing and superior guest experiences.
- Strong performing properties (Top 25%) earn $424 or more, indicating effective management and desirable locations/amenities.
- Typical properties (Median) generate around $213 per month, representing the average market performance.
- Entry-level properties (Bottom 25%) see earnings around $96, often with potential for optimization.
Average Monthly Airbnb Earnings Trend in Arniqueira
Arniqueira Airbnb Occupancy Rate Trends (2026)
Maximize your bookings by understanding the Arniqueira STR occupancy trends. Seasonal demand shifts significantly influence how often properties are booked. Typically, Novembersees the highest demand (peak season occupancy), while December experiences the lowest (low season). Effective strategies, like adjusting minimum stays or offering promotions, can boost occupancy during slower periods. Here's how different property tiers perform in Arniqueira:
- Best-in-class properties (Top 10%) achieve 73%+ occupancy, indicating high desirability and potentially optimized availability.
- Strong performing properties (Top 25%) maintain 52% or higher occupancy, suggesting good market fit and guest satisfaction.
- Typical properties (Median) have an occupancy rate around 28%.
- Entry-level properties (Bottom 25%) average 13% occupancy, potentially facing higher vacancy.
Average Monthly Occupancy Rate Trend in Arniqueira
Average Daily Rate (ADR) Airbnb Trends in Arniqueira (2026)
Effective short term rental pricing strategy in Arniqueira involves understanding monthly ADR fluctuations. The Average Daily Rate (ADR) for Airbnb in Arniqueira typically peaks in January and dips lowest during February. Leveraging Airbnb dynamic pricing tools or strategies based on this seasonality can significantly boost revenue. Here's a look at the typical nightly rates achieved:
- Best-in-class properties (Top 10%) command rates of $174+ per night, often due to premium features or locations.
- Strong performing properties (Top 25%) achieve nightly rates of $56 or more.
- Typical properties (Median) charge around $20 per night.
- Entry-level properties (Bottom 25%) earn around $16 per night.
Average Daily Rate (ADR) Trend by Month in Arniqueira
Get Live Arniqueira Market Intelligence 👇

Explore Real-time Analytics
Airbnb Seasonality Analysis & Trends in Arniqueira (2026)
Peak Season (October, June, May)
- Revenue averages $808 per month
- Occupancy rates average 38.6%
- Daily rates average $60
Shoulder Season
- Revenue averages $505 per month
- Occupancy maintains around 33.1%
- Daily rates hold near $76
Low Season (February, April, September)
- Revenue drops to average $397 per month
- Occupancy decreases to average 34.9%
- Daily rates adjust to average $62
Seasonality Insights for Arniqueira
- The Airbnb seasonality in Arniqueira shows highly seasonal trends requiring careful strategy. While the sections above show seasonal averages, it's also insightful to look at the extremes:
- During the high season, the absolute peak month showcases Arniqueira's highest earning potential, with monthly revenues capable of climbing to $1,077, occupancy reaching a high of 42.0%, and ADRs peaking at $109.
- Conversely, the slowest single month of the year, typically falling within the low season, marks the market's lowest point. In this month, revenue might dip to $311, occupancy could drop to 23.2%, and ADRs may adjust down to $57.
- Understanding both the seasonal averages and these monthly peaks and troughs in revenue, occupancy, and ADR is crucial for maximizing your Airbnb profit potential in Arniqueira.
Seasonal Strategies for Maximizing Profit
- Peak Season: Maximize revenue through premium pricing and potentially longer minimum stays. Ensure high availability.
- Low Season: Offer competitive pricing, special promotions (e.g., extended stay discounts), and flexible cancellation policies. Target off-season travelers like remote workers or budget-conscious guests.
- Shoulder Seasons: Implement dynamic pricing that balances peak and low rates. Target weekend travelers or specific events. Offer slightly more flexible terms than peak season.
- Regularly analyze your own performance against these Arniqueira seasonality benchmarks and adjust your pricing and availability strategy accordingly.
Best Areas for Airbnb Investment in Arniqueira (2026)
Exploring the top neighborhoods for short-term rentals in Arniqueira? This section highlights key areas, outlining why they are attractive for hosts and guests, along with notable local attractions. Consider these locations based on your target guest profile and investment strategy.
| Neighborhood / Area | Why Host Here? (Target Guests & Appeal) | Key Attractions & Landmarks |
|---|---|---|
| Arniqueira | A rapidly growing neighborhood in the Federal District, known for its residential developments and proximity to nature. Ideal for families and travelers looking for a peaceful retreat while still being close to urban amenities. | Parque Nacional de Brasília, Vale do Amanhecer, Cultural facilities, Local markets, Green spaces |
| Gama | Known for its affordable housing and family-friendly environment. Gama is a hub for local culture and community events, attracting tourists who appreciate authenticity and local experiences. | Parks and recreation areas, Local festivals, Gama's historical sites, Traditional Brazilian cuisine |
| Santa Maria | A suburban neighborhood that offers a mix of urban and rural living. It's an affordable option for travelers looking for convenient access to Brasília's attractions while enjoying a quieter stay. | Cultural landmarks, Shopping centers, Natural parks, Culinary experiences |
| Taguatinga | A bustling commercial hub with a vibrant nightlife and shopping options. It attracts both business travelers and casual tourists looking for entertainment and convenience. | Shopping Taguatinga, Local nightlife, Cultural theaters, Art galleries |
| Ceilândia | A dynamic and diverse neighborhood, Ceilândia has a rich cultural scene and offers a unique experience for visitors looking to engage with the local community. | Cultural festivals, Local markets, Art installations, Historical sites |
| Sobradinho | Surrounded by natural beauty, Sobradinho is a serene place for visitors seeking tranquility and outdoor activities, perfect for nature lovers. | Natural parks, Outdoor adventures, Local cuisine, Cultural events |
| Águas Claras | A modern and rapidly growing area with plenty of residential buildings, shops, and restaurants. It offers easy access to the metro and is appealing to urban travelers. | Shopping malls, Fine dining, Public parks, Urban art |
| Planaltina | Rich in history and community spirit, Planaltina offers visitors insight into the local way of life and Brazilian culture, making it an attractive location for authentic experiences. | Cultural heritage sites, Natural parks, Local events, Traditional markets |
Understanding Airbnb License Requirements & STR Laws in Arniqueira (2026)
While Arniqueira, Federal District, Brazil currently shows low STR regulations, specific Airbnb license requirements might still exist or change. Always verify the latest short term rental regulations and Airbnb license requirements directly with local government authorities for Arniqueira to ensure full compliance before hosting.
(Source: AirROI data, 2026, finding no licensed listings among those analyzed)
Top Performing Airbnb Properties in Arniqueira (2026)
Benchmark your potential! Explore examples of top-performing Airbnb properties in Arniqueirabased on Trailing Twelve Month (TTM) revenue. Analyze their characteristics, revenue, occupancy rate, and ADR to understand what drives success in this market.

Urban Farm - max 40 guests - 4km from Águas Claras
Entire Place • 6 bedrooms
Tropical house - 4km from ÁguasClaras - 23 guests
Entire Place • 3 bedrooms

Balneário Muriaé
Entire Place • 4 bedrooms
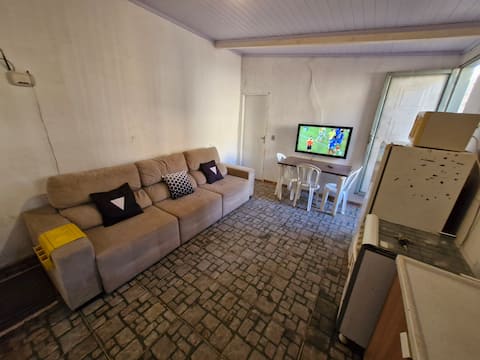
08b Cmc House With Parking
Entire Place • 2 bedrooms
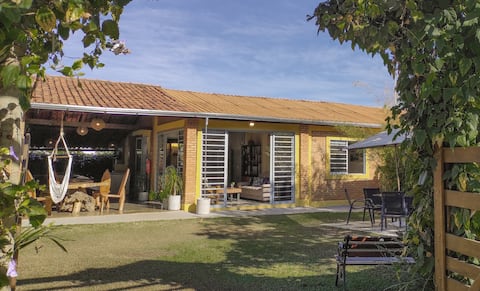
Garden House - 4km from Águas Claras - up to 21 p.
Entire Place • 3 bedrooms

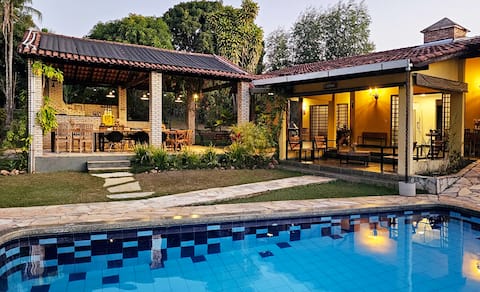
House with pool for season or events
Entire Place • 3 bedrooms
Note: Performance varies based on location, size, amenities, seasonality, and management quality. Data reflects the past 12 months.
Top Performing Airbnb Hosts in Arniqueira (2026)
Learn from the best! This table showcases top-performing Airbnb hosts in Arniqueira based on the number of properties managed and estimated total revenue over the past year. Analyze their scale and performance metrics.
| Host Name | Properties | Grossing Revenue | Stay Reviews | Avg Rating |
|---|---|---|---|---|
| Emanoel | 3 | $90,612 | 629 | 4.93/5.0 |
| Divino Jose | 6 | $36,673 | 262 | 4.71/5.0 |
| Sergio Henriques | 1 | $26,675 | 16 | 5.00/5.0 |
| Lucas | 1 | $16,374 | 38 | 4.92/5.0 |
| Anderson Rodrigues Estrela | 8 | $13,857 | 88 | 4.92/5.0 |
| Eneusa | 9 | $12,545 | 301 | 4.84/5.0 |
| Edilaine | 1 | $9,526 | 9 | 4.89/5.0 |
| Suely | 1 | $8,230 | 34 | 4.94/5.0 |
| Fabiola | 1 | $7,759 | 58 | 4.95/5.0 |
| Humberto | 11 | $6,087 | 111 | 4.51/5.0 |
Analyzing the strategies of top hosts, such as their property selection, pricing, and guest communication, can offer valuable lessons for optimizing your own Airbnb operations in Arniqueira.
Dive Deeper: Advanced Arniqueira STR Market Data (2026)
Ready to unlock more insights? AirROI provides access to advanced metrics and comprehensive Airbnb data for Arniqueira. Explore detailed analytics beyond this report to refine your investment strategy, optimize pricing, and maximize your vacation rental profits.
Explore Advanced MetricsArniqueira Short-Term Rental Market Composition (2026): Property & Room Types
Room Type Distribution
Property Type Distribution
Market Composition Insights for Arniqueira
- The Arniqueira Airbnb market composition is heavily skewed towards Entire Home/Apt listings, which make up 83.3% of the 66 active rentals. This indicates strong guest preference for privacy and space.
- Looking at the property type distribution in Arniqueira, Apartment/Condo properties are the most common (51.5%), reflecting the local real estate landscape.
- Houses represent a significant 45.5% portion, catering likely to families or larger groups.
- Smaller segments like others, hotel/boutique (combined 3.0%) offer potential for unique stay experiences.
Arniqueira Airbnb Room Capacity Analysis (2026): Bedroom Distribution
Distribution of Listings by Number of Bedrooms
Room Capacity Insights for Arniqueira
- The dominant room capacity in Arniqueira is 1 bedroom listings, making up 45.5% of the market. This suggests a strong demand for properties suitable for couples or solo travelers.
- Together, 1 bedroom and 2 bedrooms properties represent 59.1% of the active Airbnb listings in Arniqueira, indicating a high concentration in these sizes.
Arniqueira Vacation Rental Guest Capacity Trends (2026)
Distribution of Listings by Guest Capacity
Guest Capacity Insights for Arniqueira
- The most common guest capacity trend in Arniqueira vacation rentals is listings accommodating 8+ guests (28.8%). This suggests the primary traveler segment is likely larger groups.
- Properties designed for 8+ guests and 2 guests dominate the Arniqueira STR market, accounting for 45.5% of listings.
- 36.4% of properties accommodate 6+ guests, serving the market segment for larger families or group travel in Arniqueira.
- On average, properties in Arniqueira are equipped to host 4.3 guests.
Arniqueira Airbnb Booking Patterns (2026): Available vs. Booked Days
Available Days Distribution
Booked Days Distribution
Booking Pattern Insights for Arniqueira
- The most common availability pattern in Arniqueira falls within the 271-366 days range, representing 60.6% of listings. This suggests many properties have significant open periods on their calendars.
- Approximately 90.9% of listings show high availability (181+ days open annually), indicating potential for increased bookings or specific owner usage patterns.
- For booked days, the 31-90 days range is most frequent in Arniqueira (36.4%), reflecting common guest stay durations or potential owner blocking patterns.
- A notable 9.1% of properties secure long booking periods (181+ days booked per year), highlighting successful long-term rental strategies or significant owner usage.
Arniqueira Airbnb Minimum Stay Requirements Analysis
Distribution of Listings by Minimum Night Requirement
1 Night
40 listings
60.6% of total
2 Nights
8 listings
12.1% of total
3 Nights
2 listings
3% of total
4-6 Nights
3 listings
4.5% of total
30+ Nights
13 listings
19.7% of total
Key Insights
- The most prevalent minimum stay requirement in Arniqueira is 1 Night, adopted by 60.6% of listings. This highlights the market's preference for shorter, flexible bookings.
- A strong majority (72.7%) of the Arniqueira Airbnb data shows acceptance of very short stays (1-2 nights), indicating a dynamic, high-turnover market.
- A significant segment (19.7%) caters to monthly stays (30+ nights) in Arniqueira, pointing to opportunities in the extended-stay market.
Recommendations
- Align with the market by considering a 1 Night minimum stay, as 60.6% of Arniqueira hosts use this setting.
- Explore offering discounts for stays of 30+ nights to attract the 19.7% of the market seeking extended stays.
- Adjust minimum nights based on seasonality – potentially shorter during low season and longer during peak demand periods in Arniqueira.
Arniqueira Airbnb Cancellation Policy Trends Analysis (2026)
Limited
1 listings
1.5% of total
Flexible
29 listings
43.9% of total
Moderate
15 listings
22.7% of total
Firm
13 listings
19.7% of total
Strict
8 listings
12.1% of total
Cancellation Policy Insights for Arniqueira
- The prevailing Airbnb cancellation policy trend in Arniqueira is Flexible, used by 43.9% of listings.
- There's a relatively balanced mix between guest-friendly (66.6%) and stricter (31.8%) policies, offering choices for different guest needs.
Recommendations for Hosts
- Consider adopting a Flexible policy to align with the 43.9% market standard in Arniqueira.
- Using a Strict policy might deter some guests, as only 12.1% of listings use it. Evaluate if potential revenue protection outweighs possible lower booking rates.
- Regularly review your cancellation policy against competitors and market demand shifts in Arniqueira.
Arniqueira STR Booking Lead Time Analysis (2026)
Average Booking Lead Time by Month
Booking Lead Time Insights for Arniqueira
- The overall average booking lead time for vacation rentals in Arniqueira is 13 days.
- Guests book furthest in advance for stays during July (average 27 days), likely coinciding with peak travel demand or local events.
- The shortest booking windows occur for stays in October (average 8 days), indicating more last-minute travel plans during this time.
- Seasonally, Summer (18 days avg.) sees the longest lead times, while Fall (11 days avg.) has the shortest, reflecting typical travel planning cycles.
Recommendations for Hosts
- Use the overall average lead time (13 days) as a baseline for your pricing and availability strategy in Arniqueira.
- For July stays, consider implementing length-of-stay discounts or slightly higher rates for bookings made less than 27 days out to capitalize on advance planning.
- Target marketing efforts for the Summer season well in advance (at least 18 days) to capture early planners.
- Monitor your own booking lead times against these Arniqueira averages to identify opportunities for dynamic pricing adjustments.
Popular & Essential Airbnb Amenities in Arniqueira (2026)
Amenity Prevalence
Amenity Insights for Arniqueira
- Essential amenities in Arniqueira that guests expect include: TV, Wifi. Lacking these (any) could significantly impact bookings.
- Popular amenities like Kitchen, Cooking basics, Free parking on premises are common but not universal. Offering these can provide a competitive edge.
Recommendations for Hosts
- Ensure your listing includes all essential amenities for Arniqueira: TV, Wifi.
- Prioritize adding missing essentials: Wifi.
- Consider adding popular differentiators like Kitchen or Cooking basics to increase appeal.
- Highlight unique or less common amenities you offer (e.g., hot tub, dedicated workspace, EV charger) in your listing description and photos.
- Regularly check competitor amenities in Arniqueira to stay competitive.
Arniqueira Airbnb Guest Demographics & Profile Analysis (2026)
Guest Profile Summary for Arniqueira
- The typical guest profile for Airbnb in Arniqueira consists of primarily domestic travelers (93%), often arriving from nearby São Paulo, typically belonging to the Post-2000s (Gen Z/Alpha) group (50%), primarily speaking Portuguese or English.
- Domestic travelers account for 93.2% of guests.
- Key international markets include Brazil (93.2%) and Germany (2%).
- Top languages spoken are Portuguese (53%) followed by English (27.8%).
- A significant demographic segment is the Post-2000s (Gen Z/Alpha) group, representing 50% of guests.
Recommendations for Hosts
- Target domestic marketing efforts towards travelers from São Paulo and Brasília.
- Tailor amenities and listing descriptions to appeal to the dominant Post-2000s (Gen Z/Alpha) demographic (e.g., highlight fast WiFi, smart home features, local guides).
- Highlight unique local experiences or amenities relevant to the primary guest profile.
- Consider seasonal promotions aligned with peak travel times for key origin markets.
Nearby Short-Term Rental Market Comparison
How does the Arniqueira Airbnb market stack up against its neighbors? Compare key performance metrics like average monthly revenue, ADR, and occupancy rates in surrounding areas to understand the broader regional STR landscape.
| Market | Active Properties | Monthly Revenue | Daily Rate | Avg. Occupancy |
|---|---|---|---|---|
| Jardim Botânico | 56 | $994 | $105.50 | 39% |
| Pirenópolis | 1,571 | $848 | $122.51 | 28% |
| Alexânia | 119 | $826 | $157.61 | 23% |
| Santa Maria | 15 | $758 | $146.58 | 23% |
| Park Way | 25 | $751 | $91.48 | 28% |
| Ceilândia | 20 | $746 | $92.42 | 42% |
| Senador Canedo | 22 | $691 | $139.79 | 25% |
| Planaltina | 19 | $672 | $116.12 | 31% |
| Plano Piloto | 2,448 | $671 | $62.73 | 46% |
| Paranoá | 40 | $1,283 | $123.23 | 40% |