São Mateus Airbnb Market Analysis 2026: Short Term Rental Data & Vacation Rental Statistics in Espírito Santo, Brazil
Is Airbnb profitable in São Mateus in 2026? Explore comprehensive Airbnb analytics for São Mateus, Espírito Santo, Brazil to uncover income potential. This 2026 STR market report for São Mateus, based on AirROI data from February 2025 to January 2026, reveals key trends in the niche market of 177 active listings.
Whether you're considering an Airbnb investment in São Mateus, optimizing your existing vacation rental, or exploring rental arbitrage opportunities, understanding the São Mateus Airbnb data is crucial. Leveraging the low regulation environment is key to maximizing your short term rental income potential. Let's dive into the specifics.
Key São Mateus Airbnb Performance Metrics Overview
Monthly Airbnb Revenue Variations & Income Potential in São Mateus (2026)
Understanding the monthly revenue variations for Airbnb listings in São Mateus is key to maximizing your short term rental income potential. Seasonality significantly impacts earnings. Our analysis, based on data from the past 12 months, shows that the peak revenue month for STRs in São Mateus is typically January, while June often presents the lowest earnings, highlighting opportunities for strategic pricing adjustments during shoulder and low seasons. Explore the typical Airbnb income in São Mateus across different performance tiers:
- Best-in-class properties (Top 10%) achieve $1,389+ monthly, often utilizing dynamic pricing and superior guest experiences.
- Strong performing properties (Top 25%) earn $814 or more, indicating effective management and desirable locations/amenities.
- Typical properties (Median) generate around $401 per month, representing the average market performance.
- Entry-level properties (Bottom 25%) see earnings around $182, often with potential for optimization.
Average Monthly Airbnb Earnings Trend in São Mateus
São Mateus Airbnb Occupancy Rate Trends (2026)
Maximize your bookings by understanding the São Mateus STR occupancy trends. Seasonal demand shifts significantly influence how often properties are booked. Typically, Januarysees the highest demand (peak season occupancy), while June experiences the lowest (low season). Effective strategies, like adjusting minimum stays or offering promotions, can boost occupancy during slower periods. Here's how different property tiers perform in São Mateus:
- Best-in-class properties (Top 10%) achieve 50%+ occupancy, indicating high desirability and potentially optimized availability.
- Strong performing properties (Top 25%) maintain 33% or higher occupancy, suggesting good market fit and guest satisfaction.
- Typical properties (Median) have an occupancy rate around 17%.
- Entry-level properties (Bottom 25%) average 9% occupancy, potentially facing higher vacancy.
Average Monthly Occupancy Rate Trend in São Mateus
Average Daily Rate (ADR) Airbnb Trends in São Mateus (2026)
Effective short term rental pricing strategy in São Mateus involves understanding monthly ADR fluctuations. The Average Daily Rate (ADR) for Airbnb in São Mateus typically peaks in January and dips lowest during April. Leveraging Airbnb dynamic pricing tools or strategies based on this seasonality can significantly boost revenue. Here's a look at the typical nightly rates achieved:
- Best-in-class properties (Top 10%) command rates of $181+ per night, often due to premium features or locations.
- Strong performing properties (Top 25%) achieve nightly rates of $116 or more.
- Typical properties (Median) charge around $73 per night.
- Entry-level properties (Bottom 25%) earn around $50 per night.
Average Daily Rate (ADR) Trend by Month in São Mateus
Get Live São Mateus Market Intelligence 👇

Explore Real-time Analytics
Airbnb Seasonality Analysis & Trends in São Mateus (2026)
Peak Season (January, December, October)
- Revenue averages $913 per month
- Occupancy rates average 27.4%
- Daily rates average $112
Shoulder Season
- Revenue averages $580 per month
- Occupancy maintains around 23.5%
- Daily rates hold near $93
Low Season (June, August, September)
- Revenue drops to average $391 per month
- Occupancy decreases to average 18.3%
- Daily rates adjust to average $93
Seasonality Insights for São Mateus
- The Airbnb seasonality in São Mateus shows highly seasonal trends requiring careful strategy. While the sections above show seasonal averages, it's also insightful to look at the extremes:
- During the high season, the absolute peak month showcases São Mateus's highest earning potential, with monthly revenues capable of climbing to $1,061, occupancy reaching a high of 31.0%, and ADRs peaking at $123.
- Conversely, the slowest single month of the year, typically falling within the low season, marks the market's lowest point. In this month, revenue might dip to $316, occupancy could drop to 15.6%, and ADRs may adjust down to $88.
- Understanding both the seasonal averages and these monthly peaks and troughs in revenue, occupancy, and ADR is crucial for maximizing your Airbnb profit potential in São Mateus.
Seasonal Strategies for Maximizing Profit
- Peak Season: Maximize revenue through premium pricing and potentially longer minimum stays. Ensure high availability.
- Low Season: Offer competitive pricing, special promotions (e.g., extended stay discounts), and flexible cancellation policies. Target off-season travelers like remote workers or budget-conscious guests.
- Shoulder Seasons: Implement dynamic pricing that balances peak and low rates. Target weekend travelers or specific events. Offer slightly more flexible terms than peak season.
- Regularly analyze your own performance against these São Mateus seasonality benchmarks and adjust your pricing and availability strategy accordingly.
Best Areas for Airbnb Investment in São Mateus (2026)
Exploring the top neighborhoods for short-term rentals in São Mateus? This section highlights key areas, outlining why they are attractive for hosts and guests, along with notable local attractions. Consider these locations based on your target guest profile and investment strategy.
| Neighborhood / Area | Why Host Here? (Target Guests & Appeal) | Key Attractions & Landmarks |
|---|---|---|
| Praia de Guriri | Popular beach destination in São Mateus known for its clear waters and relaxing atmosphere. Ideal for tourists looking for sun, sand, and a family-friendly environment. | Guriri Beach, Water sports activities, Local seafood restaurants, Beachfront bars, Walkways along the shoreline |
| Centro Histórico | The historic center of São Mateus features colonial architecture and cultural sites, attracting visitors interested in the local history and charm of the city. | São Mateus Cathedral, Museu da Cultura Northeastern, Historic buildings, Artisan shops, Cultural events |
| Praia de Manguinhos | A quieter beach area perfect for those looking for a more laid-back response to beach vacations. It offers a serene environment with beautiful landscapes. | Manguinhos Beach, Coconut groves, Seaside bungalows, Fishing activities, Natural beauty spots |
| Praia do Araçá | This stunning beach is known for its natural beauty and calm waters. It’s a popular spot for swimming and relaxation away from the crowds. | Araçá Beach, Natural parks nearby, Birdwatching opportunities, Scenic views, Picnic spots |
| Laguna da Jussara | A unique natural lagoon area that attracts nature lovers and eco-tourists. It's a great location for kayaking and birdwatching. | Jussara Lagoon, Kayaking, Ecological trails, Wildlife viewing, Scenic picnic areas |
| Bairro Vila Nova | A developing neighborhood that provides a local vibe with access to markets and local eateries. Great for long-term stays. | Local markets, Cafes, Neighborhood parks, Community events, Access to public transport |
| Ponto da Areia | This beach area is renowned for its beauty and is a favorite among locals and tourists alike, offering various beach activities. | Ponto da Areia Beach, Beach volleyball courts, Seaside restaurants, Lifeguard services, Surfing opportunities |
| Ilha dos Frades | An idyllic island nearby São Mateus, perfect for day trips and nature experiences. It attracts those looking for an escape from the city. | Frades Island, Boat tours, Nature trails, Beaches, Local fishing villages |
Understanding Airbnb License Requirements & STR Laws in São Mateus (2026)
While São Mateus, Espírito Santo, Brazil currently shows low STR regulations, specific Airbnb license requirements might still exist or change. Always verify the latest short term rental regulations and Airbnb license requirements directly with local government authorities for São Mateus to ensure full compliance before hosting.
(Source: AirROI data, 2026, finding no licensed listings among those analyzed)
Top Performing Airbnb Properties in São Mateus (2026)
Benchmark your potential! Explore examples of top-performing Airbnb properties in São Mateusbased on Trailing Twelve Month (TTM) revenue. Analyze their characteristics, revenue, occupancy rate, and ADR to understand what drives success in this market.

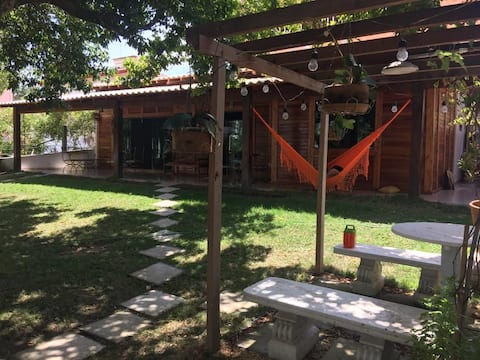
Guriri-Es Beach Corner
Entire Place • 5 bedrooms
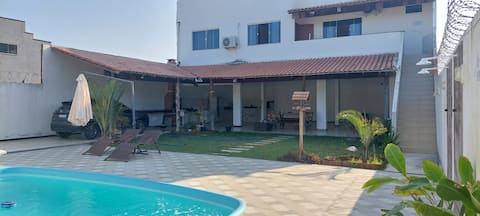
Family paradise in Praia do Paraiso
Entire Place • 3 bedrooms
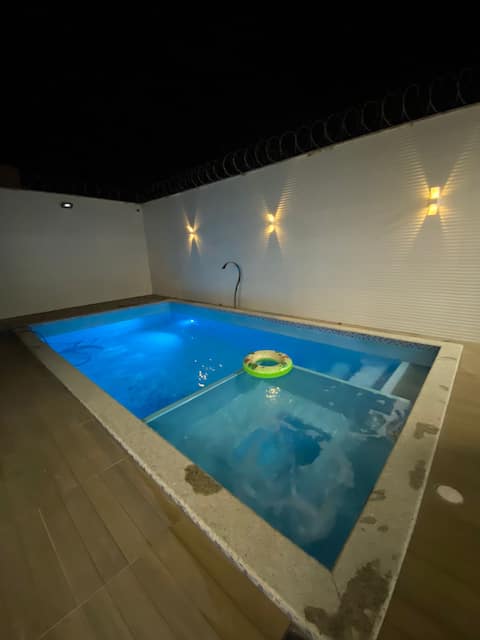
House with pool Guriri -Cod 34
Entire Place • 2 bedrooms
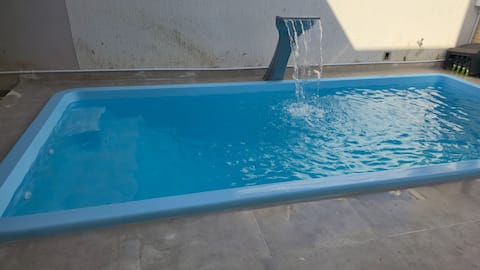
Luxury house in Guriri
Entire Place • 4 bedrooms
Casa Temporada Ilha Paraíso (Seasonal House Paradise Island)
Entire Place • 4 bedrooms
house near bosque beach
Entire Place • 4 bedrooms
Note: Performance varies based on location, size, amenities, seasonality, and management quality. Data reflects the past 12 months.
Top Performing Airbnb Hosts in São Mateus (2026)
Learn from the best! This table showcases top-performing Airbnb hosts in São Mateus based on the number of properties managed and estimated total revenue over the past year. Analyze their scale and performance metrics.
| Host Name | Properties | Grossing Revenue | Stay Reviews | Avg Rating |
|---|---|---|---|---|
| Gustavo Martins | 26 | $146,091 | 216 | 4.72/5.0 |
| Eduardo | 2 | $30,272 | 38 | 4.78/5.0 |
| Daniel Campião | 4 | $28,002 | 73 | 4.97/5.0 |
| Glauber | 1 | $24,351 | 21 | 4.95/5.0 |
| Douglas | 2 | $23,828 | 42 | 4.95/5.0 |
| Laiara | 1 | $22,404 | 13 | 4.85/5.0 |
| Fillipe | 1 | $21,048 | 52 | 4.81/5.0 |
| Jackson | 1 | $19,514 | 11 | 5.00/5.0 |
| João Paulo | 1 | $18,886 | 5 | 5.00/5.0 |
| Freitas | 2 | $17,886 | 116 | 4.98/5.0 |
Analyzing the strategies of top hosts, such as their property selection, pricing, and guest communication, can offer valuable lessons for optimizing your own Airbnb operations in São Mateus.
Dive Deeper: Advanced São Mateus STR Market Data (2026)
Ready to unlock more insights? AirROI provides access to advanced metrics and comprehensive Airbnb data for São Mateus. Explore detailed analytics beyond this report to refine your investment strategy, optimize pricing, and maximize your vacation rental profits.
Explore Advanced MetricsSão Mateus Short-Term Rental Market Composition (2026): Property & Room Types
Room Type Distribution
Property Type Distribution
Market Composition Insights for São Mateus
- The São Mateus Airbnb market composition is heavily skewed towards Entire Home/Apt listings, which make up 84.7% of the 177 active rentals. This indicates strong guest preference for privacy and space.
- Looking at the property type distribution in São Mateus, House properties are the most common (70.1%), reflecting the local real estate landscape.
- Houses represent a significant 70.1% portion, catering likely to families or larger groups.
- The presence of 7.9% Hotel/Boutique listings indicates integration with traditional hospitality.
- Smaller segments like outdoor/unique (combined 0.6%) offer potential for unique stay experiences.
São Mateus Airbnb Room Capacity Analysis (2026): Bedroom Distribution
Distribution of Listings by Number of Bedrooms
Room Capacity Insights for São Mateus
- The dominant room capacity in São Mateus is 2 bedrooms listings, making up 27.7% of the market. This suggests a strong demand for properties suitable for couples or solo travelers.
- Together, 2 bedrooms and 3 bedrooms properties represent 49.2% of the active Airbnb listings in São Mateus, indicating a high concentration in these sizes.
- A significant 44.7% of listings offer 3+ bedrooms, catering to larger groups and families seeking more space in São Mateus.
São Mateus Vacation Rental Guest Capacity Trends (2026)
Distribution of Listings by Guest Capacity
Guest Capacity Insights for São Mateus
- The most common guest capacity trend in São Mateus vacation rentals is listings accommodating 8+ guests (53.1%). This suggests the primary traveler segment is likely larger groups.
- Properties designed for 8+ guests and 4 guests dominate the São Mateus STR market, accounting for 62.7% of listings.
- 65.5% of properties accommodate 6+ guests, serving the market segment for larger families or group travel in São Mateus.
- On average, properties in São Mateus are equipped to host 5.9 guests.
São Mateus Airbnb Booking Patterns (2026): Available vs. Booked Days
Available Days Distribution
Booked Days Distribution
Booking Pattern Insights for São Mateus
- The most common availability pattern in São Mateus falls within the 271-366 days range, representing 85.9% of listings. This suggests many properties have significant open periods on their calendars.
- Approximately 97.2% of listings show high availability (181+ days open annually), indicating potential for increased bookings or specific owner usage patterns.
- For booked days, the 1-30 days range is most frequent in São Mateus (44.1%), reflecting common guest stay durations or potential owner blocking patterns.
- A notable 2.8% of properties secure long booking periods (181+ days booked per year), highlighting successful long-term rental strategies or significant owner usage.
São Mateus Airbnb Minimum Stay Requirements Analysis
Distribution of Listings by Minimum Night Requirement
1 Night
48 listings
27.1% of total
2 Nights
57 listings
32.2% of total
3 Nights
13 listings
7.3% of total
4-6 Nights
1 listings
0.6% of total
30+ Nights
58 listings
32.8% of total
Key Insights
- The most prevalent minimum stay requirement in São Mateus is 30+ Nights, adopted by 32.8% of listings. This highlights the market's preference for longer commitments.
- A significant segment (32.8%) caters to monthly stays (30+ nights) in São Mateus, pointing to opportunities in the extended-stay market.
Recommendations
- Align with the market by considering a 30+ Nights minimum stay, as 32.8% of São Mateus hosts use this setting.
- If feasible, allowing 1-night stays, especially midweek or during low season, could capture last-minute bookings, as only 27.1% currently do.
- Explore offering discounts for stays of 30+ nights to attract the 32.8% of the market seeking extended stays.
- Adjust minimum nights based on seasonality – potentially shorter during low season and longer during peak demand periods in São Mateus.
São Mateus Airbnb Cancellation Policy Trends Analysis (2026)
Limited
4 listings
2.3% of total
Super Strict 30 Days
1 listings
0.6% of total
Flexible
44 listings
24.9% of total
Moderate
55 listings
31.1% of total
Firm
56 listings
31.6% of total
Strict
17 listings
9.6% of total
Cancellation Policy Insights for São Mateus
- The prevailing Airbnb cancellation policy trend in São Mateus is Firm, used by 31.6% of listings.
- There's a relatively balanced mix between guest-friendly (56.0%) and stricter (41.2%) policies, offering choices for different guest needs.
- Strict cancellation policies are quite rare (9.6%), potentially making listings with this policy less competitive unless justified by high demand or property type.
Recommendations for Hosts
- Consider adopting a Firm policy to align with the 31.6% market standard in São Mateus.
- Using a Strict policy might deter some guests, as only 9.6% of listings use it. Evaluate if potential revenue protection outweighs possible lower booking rates.
- Regularly review your cancellation policy against competitors and market demand shifts in São Mateus.
São Mateus STR Booking Lead Time Analysis (2026)
Average Booking Lead Time by Month
Booking Lead Time Insights for São Mateus
- The overall average booking lead time for vacation rentals in São Mateus is 39 days.
- Guests book furthest in advance for stays during January (average 47 days), likely coinciding with peak travel demand or local events.
- The shortest booking windows occur for stays in June (average 7 days), indicating more last-minute travel plans during this time.
- Seasonally, Winter (43 days avg.) sees the longest lead times, while Summer (22 days avg.) has the shortest, reflecting typical travel planning cycles.
Recommendations for Hosts
- Use the overall average lead time (39 days) as a baseline for your pricing and availability strategy in São Mateus.
- During June, focus on last-minute booking availability and promotions, as guests book with very short notice (7 days avg.).
- Target marketing efforts for the Winter season well in advance (at least 43 days) to capture early planners.
- Monitor your own booking lead times against these São Mateus averages to identify opportunities for dynamic pricing adjustments.
Popular & Essential Airbnb Amenities in São Mateus (2026)
Amenity Prevalence
Amenity Insights for São Mateus
- Essential amenities in São Mateus that guests expect include: Wifi. Lacking these (this) could significantly impact bookings.
- Popular amenities like Free parking on premises, TV, Kitchen are common but not universal. Offering these can provide a competitive edge.
Recommendations for Hosts
- Ensure your listing includes all essential amenities for São Mateus: Wifi.
- Prioritize adding missing essentials: Wifi.
- Consider adding popular differentiators like Free parking on premises or TV to increase appeal.
- Highlight unique or less common amenities you offer (e.g., hot tub, dedicated workspace, EV charger) in your listing description and photos.
- Regularly check competitor amenities in São Mateus to stay competitive.
São Mateus Airbnb Guest Demographics & Profile Analysis (2026)
Guest Profile Summary for São Mateus
- The typical guest profile for Airbnb in São Mateus consists of primarily domestic travelers (97%), often arriving from nearby Governador Valadares, typically belonging to the Post-2000s (Gen Z/Alpha) group (50%), primarily speaking Portuguese or English.
- Domestic travelers account for 97.4% of guests.
- Key international markets include Brazil (97.4%) and Minas Gerais (1.6%).
- Top languages spoken are Portuguese (62.4%) followed by English (24.8%).
- A significant demographic segment is the Post-2000s (Gen Z/Alpha) group, representing 50% of guests.
Recommendations for Hosts
- Target domestic marketing efforts towards travelers from Governador Valadares and Espírito Santo.
- Tailor amenities and listing descriptions to appeal to the dominant Post-2000s (Gen Z/Alpha) demographic (e.g., highlight fast WiFi, smart home features, local guides).
- Highlight unique local experiences or amenities relevant to the primary guest profile.
- Consider seasonal promotions aligned with peak travel times for key origin markets.
Nearby Short-Term Rental Market Comparison
How does the São Mateus Airbnb market stack up against its neighbors? Compare key performance metrics like average monthly revenue, ADR, and occupancy rates in surrounding areas to understand the broader regional STR landscape.
| Market | Active Properties | Monthly Revenue | Daily Rate | Avg. Occupancy |
|---|---|---|---|---|
| Santa Teresa | 306 | $708 | $117.81 | 25% |
| Prado | 904 | $439 | $109.79 | 23% |
| Aracruz | 107 | $428 | $102.72 | 24% |
| Mucuri | 42 | $321 | $86.41 | 25% |
| Conceição da Barra | 139 | $291 | $79.14 | 21% |
| Colatina | 13 | $290 | $29.21 | 45% |
| Alcobaça | 51 | $242 | $86.25 | 20% |
| Caravelas | 33 | $230 | $54.08 | 22% |
| Linhares | 70 | $209 | $55.32 | 26% |
| Pancas | 10 | $204 | $50.65 | 18% |