Marechal Floriano Airbnb Market Analysis 2026: Short Term Rental Data & Vacation Rental Statistics in Espírito Santo, Brazil
Is Airbnb profitable in Marechal Floriano in 2026? Explore comprehensive Airbnb analytics for Marechal Floriano, Espírito Santo, Brazil to uncover income potential. This 2026 STR market report for Marechal Floriano, based on AirROI data from February 2025 to January 2026, reveals key trends in the niche market of 129 active listings.
Whether you're considering an Airbnb investment in Marechal Floriano, optimizing your existing vacation rental, or exploring rental arbitrage opportunities, understanding the Marechal Floriano Airbnb data is crucial. Leveraging the low regulation environment is key to maximizing your short term rental income potential. Let's dive into the specifics.
Key Marechal Floriano Airbnb Performance Metrics Overview
Monthly Airbnb Revenue Variations & Income Potential in Marechal Floriano (2026)
Understanding the monthly revenue variations for Airbnb listings in Marechal Floriano is key to maximizing your short term rental income potential. Seasonality significantly impacts earnings. Our analysis, based on data from the past 12 months, shows that the peak revenue month for STRs in Marechal Floriano is typically July, while February often presents the lowest earnings, highlighting opportunities for strategic pricing adjustments during shoulder and low seasons. Explore the typical Airbnb income in Marechal Floriano across different performance tiers:
- Best-in-class properties (Top 10%) achieve $1,980+ monthly, often utilizing dynamic pricing and superior guest experiences.
- Strong performing properties (Top 25%) earn $1,342 or more, indicating effective management and desirable locations/amenities.
- Typical properties (Median) generate around $698 per month, representing the average market performance.
- Entry-level properties (Bottom 25%) see earnings around $340, often with potential for optimization.
Average Monthly Airbnb Earnings Trend in Marechal Floriano
Marechal Floriano Airbnb Occupancy Rate Trends (2026)
Maximize your bookings by understanding the Marechal Floriano STR occupancy trends. Seasonal demand shifts significantly influence how often properties are booked. Typically, Julysees the highest demand (peak season occupancy), while February experiences the lowest (low season). Effective strategies, like adjusting minimum stays or offering promotions, can boost occupancy during slower periods. Here's how different property tiers perform in Marechal Floriano:
- Best-in-class properties (Top 10%) achieve 56%+ occupancy, indicating high desirability and potentially optimized availability.
- Strong performing properties (Top 25%) maintain 40% or higher occupancy, suggesting good market fit and guest satisfaction.
- Typical properties (Median) have an occupancy rate around 24%.
- Entry-level properties (Bottom 25%) average 12% occupancy, potentially facing higher vacancy.
Average Monthly Occupancy Rate Trend in Marechal Floriano
Average Daily Rate (ADR) Airbnb Trends in Marechal Floriano (2026)
Effective short term rental pricing strategy in Marechal Floriano involves understanding monthly ADR fluctuations. The Average Daily Rate (ADR) for Airbnb in Marechal Floriano typically peaks in December and dips lowest during February. Leveraging Airbnb dynamic pricing tools or strategies based on this seasonality can significantly boost revenue. Here's a look at the typical nightly rates achieved:
- Best-in-class properties (Top 10%) command rates of $174+ per night, often due to premium features or locations.
- Strong performing properties (Top 25%) achieve nightly rates of $126 or more.
- Typical properties (Median) charge around $91 per night.
- Entry-level properties (Bottom 25%) earn around $64 per night.
Average Daily Rate (ADR) Trend by Month in Marechal Floriano
Get Live Marechal Floriano Market Intelligence 👇

Explore Real-time Analytics
Airbnb Seasonality Analysis & Trends in Marechal Floriano (2026)
Peak Season (July, December, August)
- Revenue averages $1,108 per month
- Occupancy rates average 30.7%
- Daily rates average $108
Shoulder Season
- Revenue averages $967 per month
- Occupancy maintains around 28.0%
- Daily rates hold near $106
Low Season (February, May, September)
- Revenue drops to average $807 per month
- Occupancy decreases to average 26.1%
- Daily rates adjust to average $101
Seasonality Insights for Marechal Floriano
- The Airbnb seasonality in Marechal Floriano shows moderate seasonality with distinct peak and low periods. While the sections above show seasonal averages, it's also insightful to look at the extremes:
- During the high season, the absolute peak month showcases Marechal Floriano's highest earning potential, with monthly revenues capable of climbing to $1,139, occupancy reaching a high of 32.1%, and ADRs peaking at $116.
- Conversely, the slowest single month of the year, typically falling within the low season, marks the market's lowest point. In this month, revenue might dip to $701, occupancy could drop to 23.2%, and ADRs may adjust down to $95.
- Understanding both the seasonal averages and these monthly peaks and troughs in revenue, occupancy, and ADR is crucial for maximizing your Airbnb profit potential in Marechal Floriano.
Seasonal Strategies for Maximizing Profit
- Peak Season: Maximize revenue through premium pricing and potentially longer minimum stays. Ensure high availability.
- Low Season: Offer competitive pricing, special promotions (e.g., extended stay discounts), and flexible cancellation policies. Target off-season travelers like remote workers or budget-conscious guests.
- Shoulder Seasons: Implement dynamic pricing that balances peak and low rates. Target weekend travelers or specific events. Offer slightly more flexible terms than peak season.
- Regularly analyze your own performance against these Marechal Floriano seasonality benchmarks and adjust your pricing and availability strategy accordingly.
Best Areas for Airbnb Investment in Marechal Floriano (2026)
Exploring the top neighborhoods for short-term rentals in Marechal Floriano? This section highlights key areas, outlining why they are attractive for hosts and guests, along with notable local attractions. Consider these locations based on your target guest profile and investment strategy.
| Neighborhood / Area | Why Host Here? (Target Guests & Appeal) | Key Attractions & Landmarks |
|---|---|---|
| Centro | The central area of Marechal Floriano is bustling with local life, shops, and restaurants, making it attractive for guests who want to explore the town's culture and daily activities. | Church of Our Lady of Sorrows, Parks and green spaces, Local markets, Restaurants and eateries, Cultural festivals |
| Santa Isabel | A tranquil residential area surrounded by nature, ideal for visitors looking for serenity and a connection to the outdoors while being close to the town center. | Hiking trails in nature, Local coffee plantations, Beautiful views of the surrounding hills, Access to nature parks, Birdwatching opportunities |
| Monte Verde | Known for its cooler climate and beautiful landscapes, it's popular among tourists seeking a nature retreat and outdoor activities such as hiking and mountain biking. | Cascading waterfalls, Nature trails, Adventure sports, Scenic viewpoints, Eco-lodges |
| Rural Areas | The surrounding rural areas offer a unique experience of local farm life and natural beauty, making it appealing for eco-tourism. | Agritourism activities, Fruit and vegetable picking, Countryside inns, Animal encounters, Local handicraft shops |
| Pleasantville | A suburban area known for its peaceful environment and family-friendly attractions, ideal for hosting families and group travelers. | Local parks, Family-friendly restaurants, Community events, Sports facilities, Nearby children's attractions |
| Jardim Pimenteiras | A neighborhood that combines residential comfort with access to local businesses and markets, perfect for extended stays. | Local food markets, Easy access to amenities, Community atmosphere, Parks for leisure activities, Public transport accessibility |
| Cachoeiras | Famous for its beautiful waterfalls and natural swimming pools, appealing to nature lovers and adventure seekers. | Waterfall hikes, Natural swimming holes, Camping sites, Scenic picnic areas, Wildlife viewing |
| Morro da Cruz | A scenic viewpoint area that offers breathtaking views of the surrounding region, attracting tourists interested in photography and nature watching. | Panoramic views, Hiking trails, Photography spots, Peaceful setting, Local fauna and flora |
Understanding Airbnb License Requirements & STR Laws in Marechal Floriano (2026)
While Marechal Floriano, Espírito Santo, Brazil currently shows low STR regulations, specific Airbnb license requirements might still exist or change. Always verify the latest short term rental regulations and Airbnb license requirements directly with local government authorities for Marechal Floriano to ensure full compliance before hosting.
(Source: AirROI data, 2026, based on 2% licensed listings)
Top Performing Airbnb Properties in Marechal Floriano (2026)
Benchmark your potential! Explore examples of top-performing Airbnb properties in Marechal Florianobased on Trailing Twelve Month (TTM) revenue. Analyze their characteristics, revenue, occupancy rate, and ADR to understand what drives success in this market.
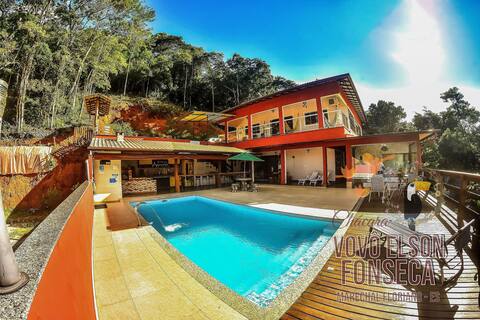
Chácara Vovô Elson Fonseca - a refuge in the Capixaba Mountains
Entire Place • 5 bedrooms

Lua Nova Chalet @chalesluardovale
Entire Place • 1 bedroom

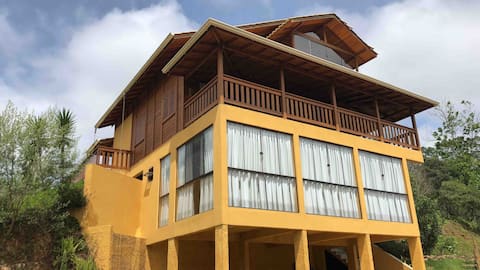
The most complete farm in the Mountains @chakarasmf
Entire Place • 6 bedrooms

Romantic cottage in Marechal (@chalesluardovale)
Entire Place • 1 bedroom
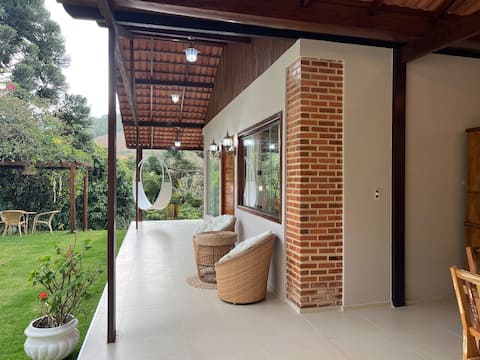
Cozy and modern house in the mountains
Entire Place • 2 bedrooms
Chalé das Lavandas - with swimming pool and game room
Entire Place • 3 bedrooms
Note: Performance varies based on location, size, amenities, seasonality, and management quality. Data reflects the past 12 months.
Top Performing Airbnb Hosts in Marechal Floriano (2026)
Learn from the best! This table showcases top-performing Airbnb hosts in Marechal Floriano based on the number of properties managed and estimated total revenue over the past year. Analyze their scale and performance metrics.
| Host Name | Properties | Grossing Revenue | Stay Reviews | Avg Rating |
|---|---|---|---|---|
| Arthur | 2 | $65,416 | 79 | 4.99/5.0 |
| Silvana | 1 | $40,263 | 53 | 4.92/5.0 |
| Juliana | 3 | $37,789 | 40 | 5.00/5.0 |
| Taniane | 2 | $35,273 | 101 | 5.00/5.0 |
| Lais Nara | 1 | $30,002 | 12 | 4.92/5.0 |
| Andreia | 6 | $27,100 | 224 | 4.96/5.0 |
| Jania Carla | 2 | $25,792 | 93 | 5.00/5.0 |
| Guilherme | 2 | $25,436 | 261 | 4.96/5.0 |
| Marcos | 1 | $24,533 | 33 | 4.94/5.0 |
| Gerusa | 1 | $24,491 | 22 | 5.00/5.0 |
Analyzing the strategies of top hosts, such as their property selection, pricing, and guest communication, can offer valuable lessons for optimizing your own Airbnb operations in Marechal Floriano.
Dive Deeper: Advanced Marechal Floriano STR Market Data (2026)
Ready to unlock more insights? AirROI provides access to advanced metrics and comprehensive Airbnb data for Marechal Floriano. Explore detailed analytics beyond this report to refine your investment strategy, optimize pricing, and maximize your vacation rental profits.
Explore Advanced MetricsMarechal Floriano Short-Term Rental Market Composition (2026): Property & Room Types
Room Type Distribution
Property Type Distribution
Market Composition Insights for Marechal Floriano
- The Marechal Floriano Airbnb market composition is heavily skewed towards Entire Home/Apt listings, which make up 89.1% of the 129 active rentals. This indicates strong guest preference for privacy and space.
- Looking at the property type distribution in Marechal Floriano, House properties are the most common (72.1%), reflecting the local real estate landscape.
- Houses represent a significant 72.1% portion, catering likely to families or larger groups.
- The presence of 5.4% Hotel/Boutique listings indicates integration with traditional hospitality.
- Smaller segments like apartment/condo (combined 4.7%) offer potential for unique stay experiences.
Marechal Floriano Airbnb Room Capacity Analysis (2026): Bedroom Distribution
Distribution of Listings by Number of Bedrooms
Room Capacity Insights for Marechal Floriano
- The dominant room capacity in Marechal Floriano is 1 bedroom listings, making up 27.1% of the market. This suggests a strong demand for properties suitable for couples or solo travelers.
- Together, 1 bedroom and 3 bedrooms properties represent 51.9% of the active Airbnb listings in Marechal Floriano, indicating a high concentration in these sizes.
- A significant 52.0% of listings offer 3+ bedrooms, catering to larger groups and families seeking more space in Marechal Floriano.
Marechal Floriano Vacation Rental Guest Capacity Trends (2026)
Distribution of Listings by Guest Capacity
Guest Capacity Insights for Marechal Floriano
- The most common guest capacity trend in Marechal Floriano vacation rentals is listings accommodating 8+ guests (46.5%). This suggests the primary traveler segment is likely larger groups.
- Properties designed for 8+ guests and 2 guests dominate the Marechal Floriano STR market, accounting for 60.5% of listings.
- 58.1% of properties accommodate 6+ guests, serving the market segment for larger families or group travel in Marechal Floriano.
- On average, properties in Marechal Floriano are equipped to host 5.5 guests.
Marechal Floriano Airbnb Booking Patterns (2026): Available vs. Booked Days
Available Days Distribution
Booked Days Distribution
Booking Pattern Insights for Marechal Floriano
- The most common availability pattern in Marechal Floriano falls within the 271-366 days range, representing 69.8% of listings. This suggests many properties have significant open periods on their calendars.
- Approximately 95.4% of listings show high availability (181+ days open annually), indicating potential for increased bookings or specific owner usage patterns.
- For booked days, the 31-90 days range is most frequent in Marechal Floriano (41.9%), reflecting common guest stay durations or potential owner blocking patterns.
- A notable 4.7% of properties secure long booking periods (181+ days booked per year), highlighting successful long-term rental strategies or significant owner usage.
Marechal Floriano Airbnb Minimum Stay Requirements Analysis
Distribution of Listings by Minimum Night Requirement
1 Night
40 listings
31% of total
2 Nights
68 listings
52.7% of total
3 Nights
1 listings
0.8% of total
30+ Nights
20 listings
15.5% of total
Key Insights
- The most prevalent minimum stay requirement in Marechal Floriano is 2 Nights, adopted by 52.7% of listings. This highlights the market's preference for shorter, flexible bookings.
- A strong majority (83.7%) of the Marechal Floriano Airbnb data shows acceptance of very short stays (1-2 nights), indicating a dynamic, high-turnover market.
- A significant segment (15.5%) caters to monthly stays (30+ nights) in Marechal Floriano, pointing to opportunities in the extended-stay market.
Recommendations
- Align with the market by considering a 2 Nights minimum stay, as 52.7% of Marechal Floriano hosts use this setting.
- Explore offering discounts for stays of 30+ nights to attract the 15.5% of the market seeking extended stays.
- Adjust minimum nights based on seasonality – potentially shorter during low season and longer during peak demand periods in Marechal Floriano.
Marechal Floriano Airbnb Cancellation Policy Trends Analysis (2026)
Super Strict 60 Days
1 listings
0.8% of total
Limited
3 listings
2.3% of total
Flexible
39 listings
30.2% of total
Moderate
50 listings
38.8% of total
Firm
34 listings
26.4% of total
Strict
2 listings
1.6% of total
Cancellation Policy Insights for Marechal Floriano
- The prevailing Airbnb cancellation policy trend in Marechal Floriano is Moderate, used by 38.8% of listings.
- There's a relatively balanced mix between guest-friendly (69.0%) and stricter (28.0%) policies, offering choices for different guest needs.
- Strict cancellation policies are quite rare (1.6%), potentially making listings with this policy less competitive unless justified by high demand or property type.
Recommendations for Hosts
- Consider adopting a Moderate policy to align with the 38.8% market standard in Marechal Floriano.
- Using a Strict policy might deter some guests, as only 1.6% of listings use it. Evaluate if potential revenue protection outweighs possible lower booking rates.
- Regularly review your cancellation policy against competitors and market demand shifts in Marechal Floriano.
Marechal Floriano STR Booking Lead Time Analysis (2026)
Average Booking Lead Time by Month
Booking Lead Time Insights for Marechal Floriano
- The overall average booking lead time for vacation rentals in Marechal Floriano is 33 days.
- Guests book furthest in advance for stays during December (average 51 days), likely coinciding with peak travel demand or local events.
- The shortest booking windows occur for stays in August (average 24 days), indicating more last-minute travel plans during this time.
- Seasonally, Winter (41 days avg.) sees the longest lead times, while Summer (26 days avg.) has the shortest, reflecting typical travel planning cycles.
Recommendations for Hosts
- Use the overall average lead time (33 days) as a baseline for your pricing and availability strategy in Marechal Floriano.
- For December stays, consider implementing length-of-stay discounts or slightly higher rates for bookings made less than 51 days out to capitalize on advance planning.
- Target marketing efforts for the Winter season well in advance (at least 41 days) to capture early planners.
- Monitor your own booking lead times against these Marechal Floriano averages to identify opportunities for dynamic pricing adjustments.
Popular & Essential Airbnb Amenities in Marechal Floriano (2026)
Amenity Prevalence
Amenity Insights for Marechal Floriano
- Essential amenities in Marechal Floriano that guests expect include: Free parking on premises, TV, Wifi. Lacking these (any) could significantly impact bookings.
- Popular amenities like Kitchen, Dishes and silverware, BBQ grill are common but not universal. Offering these can provide a competitive edge.
Recommendations for Hosts
- Ensure your listing includes all essential amenities for Marechal Floriano: Free parking on premises, TV, Wifi.
- Prioritize adding missing essentials: Free parking on premises, TV, Wifi.
- Consider adding popular differentiators like Kitchen or Dishes and silverware to increase appeal.
- Highlight unique or less common amenities you offer (e.g., hot tub, dedicated workspace, EV charger) in your listing description and photos.
- Regularly check competitor amenities in Marechal Floriano to stay competitive.
Marechal Floriano Airbnb Guest Demographics & Profile Analysis (2026)
Guest Profile Summary for Marechal Floriano
- The typical guest profile for Airbnb in Marechal Floriano consists of primarily domestic travelers (98%), often arriving from nearby Vila Velha, typically belonging to the Post-2000s (Gen Z/Alpha) group (50%), primarily speaking Portuguese or English.
- Domestic travelers account for 98.4% of guests.
- Key international markets include Brazil (98.4%) and Netherlands (0.3%).
- Top languages spoken are Portuguese (54.6%) followed by English (31.4%).
- A significant demographic segment is the Post-2000s (Gen Z/Alpha) group, representing 50% of guests.
Recommendations for Hosts
- Target domestic marketing efforts towards travelers from Vila Velha and Espírito Santo.
- Tailor amenities and listing descriptions to appeal to the dominant Post-2000s (Gen Z/Alpha) demographic (e.g., highlight fast WiFi, smart home features, local guides).
- Highlight unique local experiences or amenities relevant to the primary guest profile.
- Consider seasonal promotions aligned with peak travel times for key origin markets.
Nearby Short-Term Rental Market Comparison
How does the Marechal Floriano Airbnb market stack up against its neighbors? Compare key performance metrics like average monthly revenue, ADR, and occupancy rates in surrounding areas to understand the broader regional STR landscape.
| Market | Active Properties | Monthly Revenue | Daily Rate | Avg. Occupancy |
|---|---|---|---|---|
| Domingos Martins | 622 | $724 | $114.29 | 27% |
| Santa Teresa | 306 | $708 | $117.81 | 25% |
| Venda Nova do Imigrante | 91 | $625 | $114.74 | 22% |
| Castelo | 15 | $587 | $165.25 | 19% |
| Vila Velha | 1,780 | $556 | $62.02 | 40% |
| Anchieta | 392 | $552 | $119.34 | 24% |
| Alfredo Chaves | 59 | $524 | $100.44 | 20% |
| Vitória | 780 | $502 | $48.94 | 44% |
| Vargem Alta | 24 | $490 | $104.97 | 21% |
| Espera Feliz | 33 | $475 | $97.49 | 22% |