Divino de São Lourenço Airbnb Market Analysis 2026: Short Term Rental Data & Vacation Rental Statistics in Espírito Santo, Brazil
Is Airbnb profitable in Divino de São Lourenço in 2026? Explore comprehensive Airbnb analytics for Divino de São Lourenço, Espírito Santo, Brazil to uncover income potential. This 2026 STR market report for Divino de São Lourenço, based on AirROI data from February 2025 to January 2026, reveals key trends in the niche market of 57 active listings.
Whether you're considering an Airbnb investment in Divino de São Lourenço, optimizing your existing vacation rental, or exploring rental arbitrage opportunities, understanding the Divino de São Lourenço Airbnb data is crucial. Leveraging the low regulation environment is key to maximizing your short term rental income potential. Let's dive into the specifics.
Key Divino de São Lourenço Airbnb Performance Metrics Overview
Monthly Airbnb Revenue Variations & Income Potential in Divino de São Lourenço (2026)
Understanding the monthly revenue variations for Airbnb listings in Divino de São Lourenço is key to maximizing your short term rental income potential. Seasonality significantly impacts earnings. Our analysis, based on data from the past 12 months, shows that the peak revenue month for STRs in Divino de São Lourenço is typically December, while October often presents the lowest earnings, highlighting opportunities for strategic pricing adjustments during shoulder and low seasons. Explore the typical Airbnb income in Divino de São Lourenço across different performance tiers:
- Best-in-class properties (Top 10%) achieve $743+ monthly, often utilizing dynamic pricing and superior guest experiences.
- Strong performing properties (Top 25%) earn $482 or more, indicating effective management and desirable locations/amenities.
- Typical properties (Median) generate around $246 per month, representing the average market performance.
- Entry-level properties (Bottom 25%) see earnings around $127, often with potential for optimization.
Average Monthly Airbnb Earnings Trend in Divino de São Lourenço
Divino de São Lourenço Airbnb Occupancy Rate Trends (2026)
Maximize your bookings by understanding the Divino de São Lourenço STR occupancy trends. Seasonal demand shifts significantly influence how often properties are booked. Typically, Marchsees the highest demand (peak season occupancy), while October experiences the lowest (low season). Effective strategies, like adjusting minimum stays or offering promotions, can boost occupancy during slower periods. Here's how different property tiers perform in Divino de São Lourenço:
- Best-in-class properties (Top 10%) achieve 44%+ occupancy, indicating high desirability and potentially optimized availability.
- Strong performing properties (Top 25%) maintain 31% or higher occupancy, suggesting good market fit and guest satisfaction.
- Typical properties (Median) have an occupancy rate around 17%.
- Entry-level properties (Bottom 25%) average 10% occupancy, potentially facing higher vacancy.
Average Monthly Occupancy Rate Trend in Divino de São Lourenço
Average Daily Rate (ADR) Airbnb Trends in Divino de São Lourenço (2026)
Effective short term rental pricing strategy in Divino de São Lourenço involves understanding monthly ADR fluctuations. The Average Daily Rate (ADR) for Airbnb in Divino de São Lourenço typically peaks in December and dips lowest during February. Leveraging Airbnb dynamic pricing tools or strategies based on this seasonality can significantly boost revenue. Here's a look at the typical nightly rates achieved:
- Best-in-class properties (Top 10%) command rates of $92+ per night, often due to premium features or locations.
- Strong performing properties (Top 25%) achieve nightly rates of $63 or more.
- Typical properties (Median) charge around $45 per night.
- Entry-level properties (Bottom 25%) earn around $35 per night.
Average Daily Rate (ADR) Trend by Month in Divino de São Lourenço
Get Live Divino de São Lourenço Market Intelligence 👇

Explore Real-time Analytics
Airbnb Seasonality Analysis & Trends in Divino de São Lourenço (2026)
Peak Season (December, January, March)
- Revenue averages $440 per month
- Occupancy rates average 24.1%
- Daily rates average $55
Shoulder Season
- Revenue averages $320 per month
- Occupancy maintains around 22.4%
- Daily rates hold near $50
Low Season (August, September, October)
- Revenue drops to average $266 per month
- Occupancy decreases to average 17.9%
- Daily rates adjust to average $54
Seasonality Insights for Divino de São Lourenço
- The Airbnb seasonality in Divino de São Lourenço shows moderate seasonality with distinct peak and low periods. While the sections above show seasonal averages, it's also insightful to look at the extremes:
- During the high season, the absolute peak month showcases Divino de São Lourenço's highest earning potential, with monthly revenues capable of climbing to $491, occupancy reaching a high of 25.4%, and ADRs peaking at $59.
- Conversely, the slowest single month of the year, typically falling within the low season, marks the market's lowest point. In this month, revenue might dip to $262, occupancy could drop to 17.4%, and ADRs may adjust down to $47.
- Understanding both the seasonal averages and these monthly peaks and troughs in revenue, occupancy, and ADR is crucial for maximizing your Airbnb profit potential in Divino de São Lourenço.
Seasonal Strategies for Maximizing Profit
- Peak Season: Maximize revenue through premium pricing and potentially longer minimum stays. Ensure high availability.
- Low Season: Offer competitive pricing, special promotions (e.g., extended stay discounts), and flexible cancellation policies. Target off-season travelers like remote workers or budget-conscious guests.
- Shoulder Seasons: Implement dynamic pricing that balances peak and low rates. Target weekend travelers or specific events. Offer slightly more flexible terms than peak season.
- Regularly analyze your own performance against these Divino de São Lourenço seasonality benchmarks and adjust your pricing and availability strategy accordingly.
Best Areas for Airbnb Investment in Divino de São Lourenço (2026)
Exploring the top neighborhoods for short-term rentals in Divino de São Lourenço? This section highlights key areas, outlining why they are attractive for hosts and guests, along with notable local attractions. Consider these locations based on your target guest profile and investment strategy.
| Neighborhood / Area | Why Host Here? (Target Guests & Appeal) | Key Attractions & Landmarks |
|---|---|---|
| Centro | The vibrant heart of Divino de São Lourenço, offering convenient access to restaurants, shops, and cultural sites. Ideal for tourists wanting to experience local life and amenities. | Divino de São Lourenço Park, Local artisans and crafts, Restaurants serving traditional cuisine, Cultural events held in the town square |
| Serra do Mar | A stunning natural area nearby, perfect for those interested in eco-tourism and outdoor activities like hiking and birdwatching. Appeals to nature lovers looking for tranquility. | Hiking trails, Birdwatching spots, Scenic viewpoints, Natural waterfalls |
| Bairro São Sebastião | A residential neighborhood offering a more authentic experience of life in Divino de São Lourenço. A quieter option away from tourist areas, with local charm. | Local markets, Community events, Traditional bakery shops |
| Fazenda da Luz | A unique rural area known for its agro-tourism. Visitors can experience farm life and enjoy fresh produce. Great for families looking for a different vacation experience. | Agro-tourism experiences, Farm tours, Organic produce, Nature trails |
| Parque Natural Municipal | Close proximity to nature with various outdoor activities. Ideal for tourists seeking adventure and scenic beauty. | Hiking routes, Picnic areas, Camping spots, Wildlife observation |
| Cascata do Salto | Famed for its beautiful waterfalls, this area draws visitors for nature excursions and photography. Perfect for romantic getaways and family outings. | Waterfalls, Swimming spots, Nature walks, Scenic photography |
| Caminho Real | A historic route through the region known for its scenic beauty and cultural heritage. Ideal for visitors interested in history and local culture. | Historic landmarks, Cultural experiences, Scenic drives |
| Vila de Lumiar | A charming village atmosphere with a focus on artistic and cultural activities. Attracts artists and those looking for a serene environment. | Art galleries, Local crafts, Cultural festivals |
Understanding Airbnb License Requirements & STR Laws in Divino de São Lourenço (2026)
While Divino de São Lourenço, Espírito Santo, Brazil currently shows low STR regulations, specific Airbnb license requirements might still exist or change. Always verify the latest short term rental regulations and Airbnb license requirements directly with local government authorities for Divino de São Lourenço to ensure full compliance before hosting.
(Source: AirROI data, 2026, finding no licensed listings among those analyzed)
Top Performing Airbnb Properties in Divino de São Lourenço (2026)
Benchmark your potential! Explore examples of top-performing Airbnb properties in Divino de São Lourençobased on Trailing Twelve Month (TTM) revenue. Analyze their characteristics, revenue, occupancy rate, and ADR to understand what drives success in this market.
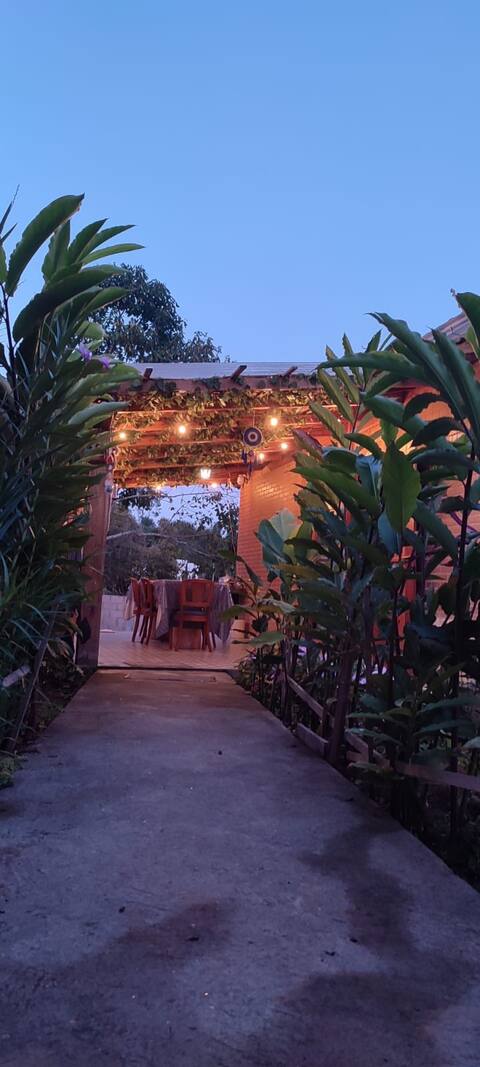
Casa Tangará - Patrimônio da Penha - Espírito Santo
Entire Place • 2 bedrooms
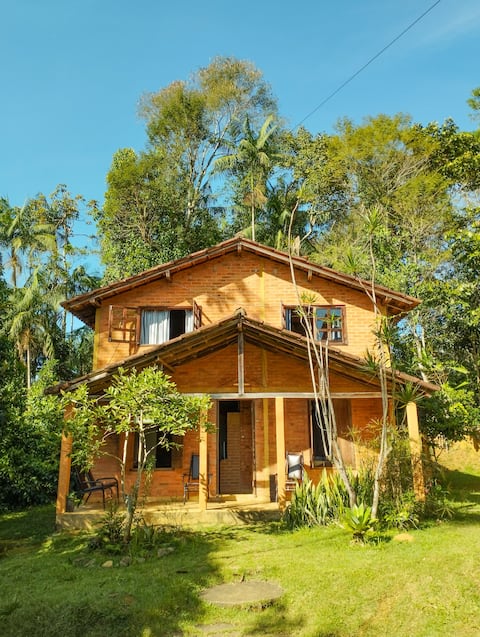
Encanto da Penha House
Entire Place • 5 bedrooms

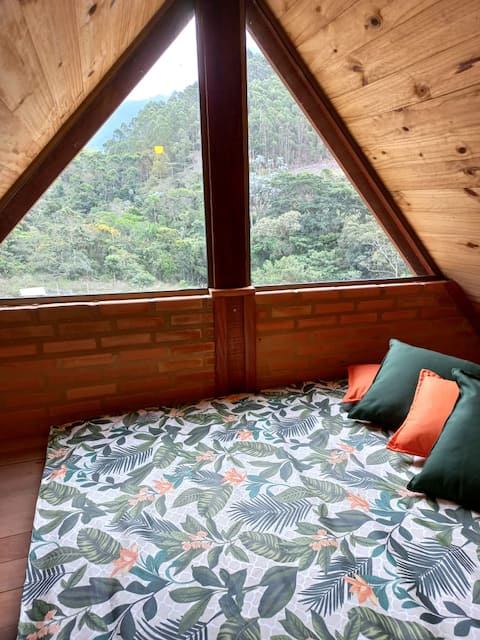
Charming suite with bathtub and 4.9-star view.
Entire Place • 1 bedroom
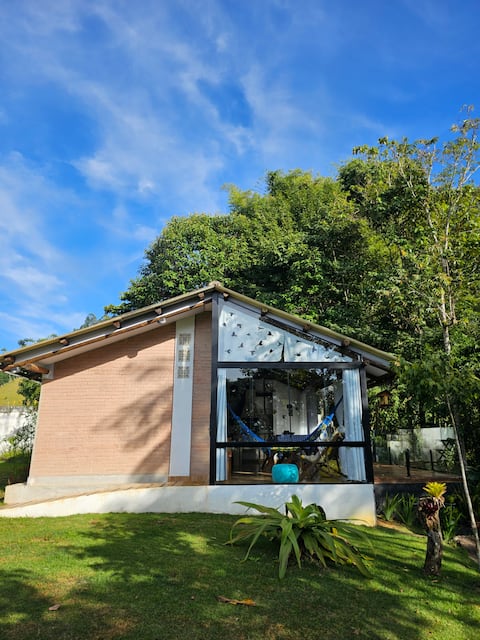
Recanto Riacho Cottage
Entire Place • 1 bedroom
Cottage with waterfall on a farm in Caparaó ES.
Entire Place • 1 bedroom

Hospedagem Casa do Chapéu Caparaó - Cabana Estrela
Entire Place • 1 bedroom
Note: Performance varies based on location, size, amenities, seasonality, and management quality. Data reflects the past 12 months.
Top Performing Airbnb Hosts in Divino de São Lourenço (2026)
Learn from the best! This table showcases top-performing Airbnb hosts in Divino de São Lourenço based on the number of properties managed and estimated total revenue over the past year. Analyze their scale and performance metrics.
| Host Name | Properties | Grossing Revenue | Stay Reviews | Avg Rating |
|---|---|---|---|---|
| Robson | 2 | $10,460 | 31 | 4.97/5.0 |
| Raphael Bolzan | 1 | $9,429 | 27 | 5.00/5.0 |
| Barbara & Judson | 2 | $9,290 | 51 | 4.93/5.0 |
| Relva | 4 | $8,558 | 35 | 4.98/5.0 |
| Lucas Nazareth De Melo | 1 | $8,495 | 28 | 4.89/5.0 |
| Hudson Boldrini | 2 | $7,994 | 59 | 4.83/5.0 |
| Arlindo | 1 | $7,531 | 15 | 4.93/5.0 |
| Juliana | 1 | $6,847 | 194 | 4.98/5.0 |
| Tiaya | 5 | $5,949 | 64 | 4.88/5.0 |
| Laís | 2 | $5,876 | 23 | 4.90/5.0 |
Analyzing the strategies of top hosts, such as their property selection, pricing, and guest communication, can offer valuable lessons for optimizing your own Airbnb operations in Divino de São Lourenço.
Dive Deeper: Advanced Divino de São Lourenço STR Market Data (2026)
Ready to unlock more insights? AirROI provides access to advanced metrics and comprehensive Airbnb data for Divino de São Lourenço. Explore detailed analytics beyond this report to refine your investment strategy, optimize pricing, and maximize your vacation rental profits.
Explore Advanced MetricsDivino de São Lourenço Short-Term Rental Market Composition (2026): Property & Room Types
Room Type Distribution
Property Type Distribution
Market Composition Insights for Divino de São Lourenço
- The Divino de São Lourenço Airbnb market composition is heavily skewed towards Entire Home/Apt listings, which make up 68.4% of the 57 active rentals. This indicates strong guest preference for privacy and space.
- However, a notable 31.6% share for Private Rooms suggests opportunities for budget-conscious travelers or hosts renting out spare rooms.
- Looking at the property type distribution in Divino de São Lourenço, House properties are the most common (50.9%), reflecting the local real estate landscape.
- Houses represent a significant 50.9% portion, catering likely to families or larger groups.
- The presence of 15.8% Hotel/Boutique listings indicates integration with traditional hospitality.
Divino de São Lourenço Airbnb Room Capacity Analysis (2026): Bedroom Distribution
Distribution of Listings by Number of Bedrooms
Room Capacity Insights for Divino de São Lourenço
- The dominant room capacity in Divino de São Lourenço is 1 bedroom listings, making up 40.4% of the market. This suggests a strong demand for properties suitable for couples or solo travelers.
- Together, 1 bedroom and 2 bedrooms properties represent 68.5% of the active Airbnb listings in Divino de São Lourenço, indicating a high concentration in these sizes.
Divino de São Lourenço Vacation Rental Guest Capacity Trends (2026)
Distribution of Listings by Guest Capacity
Guest Capacity Insights for Divino de São Lourenço
- The most common guest capacity trend in Divino de São Lourenço vacation rentals is listings accommodating 2 guests (19.3%). This suggests the primary traveler segment is likely couples or solo travelers.
- Properties designed for 2 guests and 6 guests dominate the Divino de São Lourenço STR market, accounting for 36.8% of listings.
- 29.8% of properties accommodate 6+ guests, serving the market segment for larger families or group travel in Divino de São Lourenço.
- On average, properties in Divino de São Lourenço are equipped to host 3.7 guests.
Divino de São Lourenço Airbnb Booking Patterns (2026): Available vs. Booked Days
Available Days Distribution
Booked Days Distribution
Booking Pattern Insights for Divino de São Lourenço
- The most common availability pattern in Divino de São Lourenço falls within the 271-366 days range, representing 84.2% of listings. This suggests many properties have significant open periods on their calendars.
- Approximately 98.2% of listings show high availability (181+ days open annually), indicating potential for increased bookings or specific owner usage patterns.
- For booked days, the 1-30 days range is most frequent in Divino de São Lourenço (43.9%), reflecting common guest stay durations or potential owner blocking patterns.
- A notable 1.8% of properties secure long booking periods (181+ days booked per year), highlighting successful long-term rental strategies or significant owner usage.
Divino de São Lourenço Airbnb Minimum Stay Requirements Analysis
Distribution of Listings by Minimum Night Requirement
1 Night
29 listings
50.9% of total
2 Nights
17 listings
29.8% of total
30+ Nights
11 listings
19.3% of total
Key Insights
- The most prevalent minimum stay requirement in Divino de São Lourenço is 1 Night, adopted by 50.9% of listings. This highlights the market's preference for shorter, flexible bookings.
- A strong majority (80.7%) of the Divino de São Lourenço Airbnb data shows acceptance of very short stays (1-2 nights), indicating a dynamic, high-turnover market.
- A significant segment (19.3%) caters to monthly stays (30+ nights) in Divino de São Lourenço, pointing to opportunities in the extended-stay market.
Recommendations
- Align with the market by considering a 1 Night minimum stay, as 50.9% of Divino de São Lourenço hosts use this setting.
- Explore offering discounts for stays of 30+ nights to attract the 19.3% of the market seeking extended stays.
- Adjust minimum nights based on seasonality – potentially shorter during low season and longer during peak demand periods in Divino de São Lourenço.
Divino de São Lourenço Airbnb Cancellation Policy Trends Analysis (2026)
Limited
4 listings
7% of total
Flexible
11 listings
19.3% of total
Moderate
14 listings
24.6% of total
Firm
20 listings
35.1% of total
Strict
8 listings
14% of total
Cancellation Policy Insights for Divino de São Lourenço
- The prevailing Airbnb cancellation policy trend in Divino de São Lourenço is Firm, used by 35.1% of listings.
- There's a relatively balanced mix between guest-friendly (43.9%) and stricter (49.1%) policies, offering choices for different guest needs.
Recommendations for Hosts
- Consider adopting a Firm policy to align with the 35.1% market standard in Divino de São Lourenço.
- Using a Strict policy might deter some guests, as only 14% of listings use it. Evaluate if potential revenue protection outweighs possible lower booking rates.
- Regularly review your cancellation policy against competitors and market demand shifts in Divino de São Lourenço.
Divino de São Lourenço STR Booking Lead Time Analysis (2026)
Average Booking Lead Time by Month
Booking Lead Time Insights for Divino de São Lourenço
- The overall average booking lead time for vacation rentals in Divino de São Lourenço is 42 days.
- Guests book furthest in advance for stays during April (average 73 days), likely coinciding with peak travel demand or local events.
- The shortest booking windows occur for stays in August (average 13 days), indicating more last-minute travel plans during this time.
- Seasonally, Fall (61 days avg.) sees the longest lead times, while Summer (18 days avg.) has the shortest, reflecting typical travel planning cycles.
Recommendations for Hosts
- Use the overall average lead time (42 days) as a baseline for your pricing and availability strategy in Divino de São Lourenço.
- For April stays, consider implementing length-of-stay discounts or slightly higher rates for bookings made less than 73 days out to capitalize on advance planning.
- During August, focus on last-minute booking availability and promotions, as guests book with very short notice (13 days avg.).
- Target marketing efforts for the Fall season well in advance (at least 61 days) to capture early planners.
- Monitor your own booking lead times against these Divino de São Lourenço averages to identify opportunities for dynamic pricing adjustments.
Popular & Essential Airbnb Amenities in Divino de São Lourenço (2026)
Amenity Prevalence
Amenity Insights for Divino de São Lourenço
- Popular amenities like Wifi, Free parking on premises, Kitchen are common but not universal. Offering these can provide a competitive edge.
- Warning: Wifi is not universally provided but is considered essential globally. Ensure reliable Wifi is offered.
Recommendations for Hosts
- Consider adding popular differentiators like Wifi or Free parking on premises to increase appeal.
- Highlight unique or less common amenities you offer (e.g., hot tub, dedicated workspace, EV charger) in your listing description and photos.
- Regularly check competitor amenities in Divino de São Lourenço to stay competitive.
Divino de São Lourenço Airbnb Guest Demographics & Profile Analysis (2026)
Guest Profile Summary for Divino de São Lourenço
- The typical guest profile for Airbnb in Divino de São Lourenço consists of primarily domestic travelers (98%), often arriving from nearby Espírito Santo, typically belonging to the Post-2000s (Gen Z/Alpha) group (50%), primarily speaking Portuguese or English.
- Domestic travelers account for 98.4% of guests.
- Key international markets include Brazil (98.4%) and Netherlands (0.8%).
- Top languages spoken are Portuguese (45.7%) followed by English (27.7%).
- A significant demographic segment is the Post-2000s (Gen Z/Alpha) group, representing 50% of guests.
Recommendations for Hosts
- Target domestic marketing efforts towards travelers from Espírito Santo and Vitoria.
- Tailor amenities and listing descriptions to appeal to the dominant Post-2000s (Gen Z/Alpha) demographic (e.g., highlight fast WiFi, smart home features, local guides).
- Highlight unique local experiences or amenities relevant to the primary guest profile.
- Consider seasonal promotions aligned with peak travel times for key origin markets.
Nearby Short-Term Rental Market Comparison
How does the Divino de São Lourenço Airbnb market stack up against its neighbors? Compare key performance metrics like average monthly revenue, ADR, and occupancy rates in surrounding areas to understand the broader regional STR landscape.
| Market | Active Properties | Monthly Revenue | Daily Rate | Avg. Occupancy |
|---|---|---|---|---|
| Domingos Martins | 622 | $724 | $114.29 | 27% |
| Santa Teresa | 306 | $708 | $117.81 | 25% |
| Marechal Floriano | 129 | $682 | $110.48 | 26% |
| Venda Nova do Imigrante | 91 | $625 | $114.74 | 22% |
| Castelo | 15 | $587 | $165.25 | 19% |
| Vila Velha | 1,780 | $556 | $62.02 | 40% |
| Anchieta | 392 | $552 | $119.34 | 24% |
| Alfredo Chaves | 59 | $524 | $100.44 | 20% |
| Vitória | 780 | $502 | $48.94 | 44% |
| Vargem Alta | 24 | $490 | $104.97 | 21% |