Anchieta Airbnb Market Analysis 2026: Short Term Rental Data & Vacation Rental Statistics in Espírito Santo, Brazil
Is Airbnb profitable in Anchieta in 2026? Explore comprehensive Airbnb analytics for Anchieta, Espírito Santo, Brazil to uncover income potential. This 2026 STR market report for Anchieta, based on AirROI data from February 2025 to January 2026, reveals key trends in the market of 392 active listings.
Whether you're considering an Airbnb investment in Anchieta, optimizing your existing vacation rental, or exploring rental arbitrage opportunities, understanding the Anchieta Airbnb data is crucial. Leveraging the low regulation environment is key to maximizing your short term rental income potential. Let's dive into the specifics.
Key Anchieta Airbnb Performance Metrics Overview
Monthly Airbnb Revenue Variations & Income Potential in Anchieta (2026)
Understanding the monthly revenue variations for Airbnb listings in Anchieta is key to maximizing your short term rental income potential. Seasonality significantly impacts earnings. Our analysis, based on data from the past 12 months, shows that the peak revenue month for STRs in Anchieta is typically January, while June often presents the lowest earnings, highlighting opportunities for strategic pricing adjustments during shoulder and low seasons. Explore the typical Airbnb income in Anchieta across different performance tiers:
- Best-in-class properties (Top 10%) achieve $2,018+ monthly, often utilizing dynamic pricing and superior guest experiences.
- Strong performing properties (Top 25%) earn $1,128 or more, indicating effective management and desirable locations/amenities.
- Typical properties (Median) generate around $520 per month, representing the average market performance.
- Entry-level properties (Bottom 25%) see earnings around $241, often with potential for optimization.
Average Monthly Airbnb Earnings Trend in Anchieta
Anchieta Airbnb Occupancy Rate Trends (2026)
Maximize your bookings by understanding the Anchieta STR occupancy trends. Seasonal demand shifts significantly influence how often properties are booked. Typically, Januarysees the highest demand (peak season occupancy), while August experiences the lowest (low season). Effective strategies, like adjusting minimum stays or offering promotions, can boost occupancy during slower periods. Here's how different property tiers perform in Anchieta:
- Best-in-class properties (Top 10%) achieve 57%+ occupancy, indicating high desirability and potentially optimized availability.
- Strong performing properties (Top 25%) maintain 35% or higher occupancy, suggesting good market fit and guest satisfaction.
- Typical properties (Median) have an occupancy rate around 19%.
- Entry-level properties (Bottom 25%) average 9% occupancy, potentially facing higher vacancy.
Average Monthly Occupancy Rate Trend in Anchieta
Average Daily Rate (ADR) Airbnb Trends in Anchieta (2026)
Effective short term rental pricing strategy in Anchieta involves understanding monthly ADR fluctuations. The Average Daily Rate (ADR) for Airbnb in Anchieta typically peaks in January and dips lowest during April. Leveraging Airbnb dynamic pricing tools or strategies based on this seasonality can significantly boost revenue. Here's a look at the typical nightly rates achieved:
- Best-in-class properties (Top 10%) command rates of $238+ per night, often due to premium features or locations.
- Strong performing properties (Top 25%) achieve nightly rates of $144 or more.
- Typical properties (Median) charge around $88 per night.
- Entry-level properties (Bottom 25%) earn around $61 per night.
Average Daily Rate (ADR) Trend by Month in Anchieta
Get Live Anchieta Market Intelligence 👇

Explore Real-time Analytics
Airbnb Seasonality Analysis & Trends in Anchieta (2026)
Peak Season (January, March, December)
- Revenue averages $1,261 per month
- Occupancy rates average 30.4%
- Daily rates average $133
Shoulder Season
- Revenue averages $872 per month
- Occupancy maintains around 25.5%
- Daily rates hold near $120
Low Season (June, August, September)
- Revenue drops to average $649 per month
- Occupancy decreases to average 18.7%
- Daily rates adjust to average $119
Seasonality Insights for Anchieta
- The Airbnb seasonality in Anchieta shows highly seasonal trends requiring careful strategy. While the sections above show seasonal averages, it's also insightful to look at the extremes:
- During the high season, the absolute peak month showcases Anchieta's highest earning potential, with monthly revenues capable of climbing to $1,521, occupancy reaching a high of 33.3%, and ADRs peaking at $144.
- Conversely, the slowest single month of the year, typically falling within the low season, marks the market's lowest point. In this month, revenue might dip to $590, occupancy could drop to 16.8%, and ADRs may adjust down to $114.
- Understanding both the seasonal averages and these monthly peaks and troughs in revenue, occupancy, and ADR is crucial for maximizing your Airbnb profit potential in Anchieta.
Seasonal Strategies for Maximizing Profit
- Peak Season: Maximize revenue through premium pricing and potentially longer minimum stays. Ensure high availability.
- Low Season: Offer competitive pricing, special promotions (e.g., extended stay discounts), and flexible cancellation policies. Target off-season travelers like remote workers or budget-conscious guests.
- Shoulder Seasons: Implement dynamic pricing that balances peak and low rates. Target weekend travelers or specific events. Offer slightly more flexible terms than peak season.
- Regularly analyze your own performance against these Anchieta seasonality benchmarks and adjust your pricing and availability strategy accordingly.
Best Areas for Airbnb Investment in Anchieta (2026)
Exploring the top neighborhoods for short-term rentals in Anchieta? This section highlights key areas, outlining why they are attractive for hosts and guests, along with notable local attractions. Consider these locations based on your target guest profile and investment strategy.
| Neighborhood / Area | Why Host Here? (Target Guests & Appeal) | Key Attractions & Landmarks |
|---|---|---|
| Praia dos Castelhanos | Popular beach known for its natural beauty and relaxing atmosphere. Ideal for tourists looking for sun and recreation. | Castelhano Beach, Surfing Spots, Nature Trails, Beach Sports |
| Praia do Sol | A vibrant beach area that attracts families and young visitors. Great for water sports and social gatherings. | Beach Bars, Water Sports Rentals, Local Cuisine, Summer Festivals |
| Centro de Anchieta | The cultural and historical heart of the city, appealing to visitors interested in local traditions and heritage. | Anchieta Convent, Historical Museum, Local Markets, Cultural Events |
| Praia de Iriri | A well-known beach with clear waters, ideal for swimming and relaxation, popular with both locals and tourists. | Iriri Beach, Waterfront Restaurants, Fishing Spots, Beach Volleyball |
| Parque Nacional de Atalaia | A national park that offers ecotourism opportunities, attracting nature lovers and adventure seekers. | Hiking Trails, Wildlife Viewing, Campgrounds, Scenic Views |
| Praia de Ubu | A serene beach area perfect for those looking to escape the hustle and bustle of city life and enjoy nature. | Quiet Beaches, Seaside Walks, Local Seafood Restaurants, Bird Watching |
| Praia de Setiba | A family-friendly beach known for its calm waters and recreational facilities, making it ideal for family trips. | Family-Friendly Amenities, Picnic Areas, Safe Swimming Zones, Beach Volleyball Courts |
| Mirante da Costa | A scenic viewpoint that provides stunning views of the coastline, popular with photographers and nature enthusiasts. | Scenic Overlooks, Walking Paths, Sunset Views, Wildlife Watching |
Understanding Airbnb License Requirements & STR Laws in Anchieta (2026)
While Anchieta, Espírito Santo, Brazil currently shows low STR regulations, specific Airbnb license requirements might still exist or change. Always verify the latest short term rental regulations and Airbnb license requirements directly with local government authorities for Anchieta to ensure full compliance before hosting.
(Source: AirROI data, 2026, finding no licensed listings among those analyzed)
Top Performing Airbnb Properties in Anchieta (2026)
Benchmark your potential! Explore examples of top-performing Airbnb properties in Anchietabased on Trailing Twelve Month (TTM) revenue. Analyze their characteristics, revenue, occupancy rate, and ADR to understand what drives success in this market.

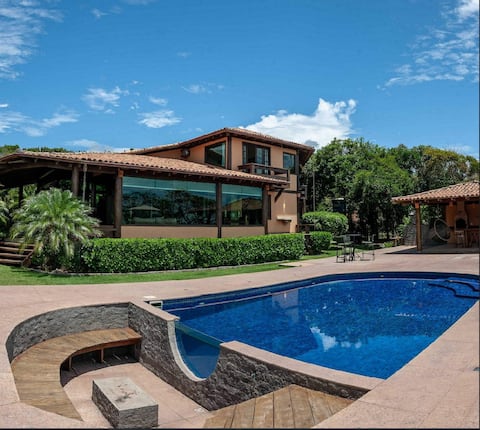
Lagoa Por Do Sol House in Guarapari
Entire Place • 6 bedrooms
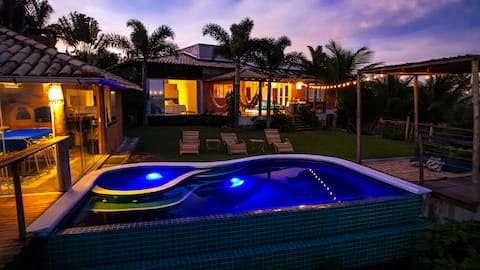
Amazing house and view that transforms your moment
Entire Place • 5 bedrooms
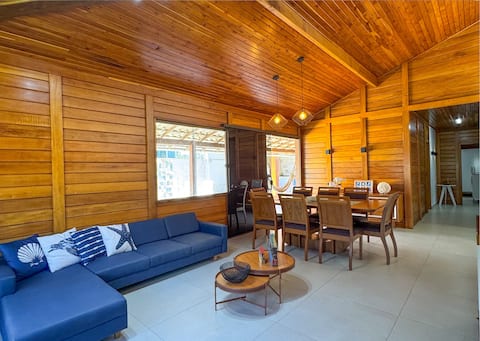
Sea garden house
Entire Place • 4 bedrooms
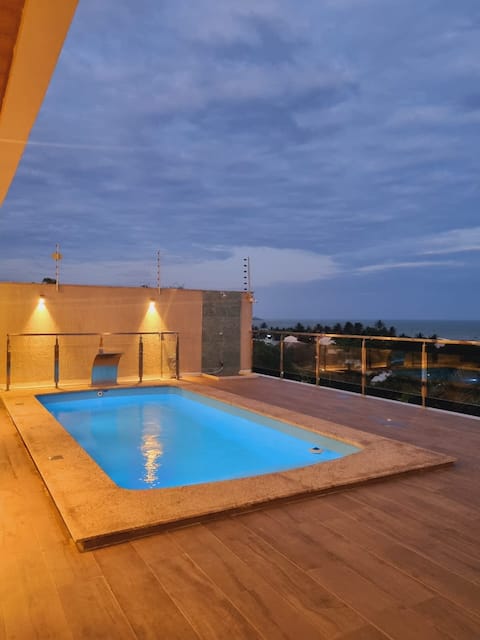
casadecastelhanos 50mSea, 4suites w/AC, leisure comp
Entire Place • 4 bedrooms
Enjoy a house with ocean views and a swimming pool!
Entire Place • 4 bedrooms

Casa Recanto do Mar - 6x interest-free
Entire Place • 5 bedrooms
Note: Performance varies based on location, size, amenities, seasonality, and management quality. Data reflects the past 12 months.
Top Performing Airbnb Hosts in Anchieta (2026)
Learn from the best! This table showcases top-performing Airbnb hosts in Anchieta based on the number of properties managed and estimated total revenue over the past year. Analyze their scale and performance metrics.
| Host Name | Properties | Grossing Revenue | Stay Reviews | Avg Rating |
|---|---|---|---|---|
| Amanda | 10 | $126,684 | 193 | 4.89/5.0 |
| Fernanda Aboul | 4 | $89,105 | 26 | 5.00/5.0 |
| Hanna | 1 | $74,932 | 11 | 5.00/5.0 |
| Maria | 1 | $60,817 | 4 | 5.00/5.0 |
| Polyanna | 1 | $52,445 | 29 | 4.86/5.0 |
| Sidneia Almofrey | 1 | $45,813 | 22 | 4.91/5.0 |
| Guto | 1 | $43,285 | 78 | 4.97/5.0 |
| Nathan | 5 | $38,170 | 145 | 4.87/5.0 |
| May | 1 | $33,205 | 34 | 4.94/5.0 |
| Madson | 10 | $33,022 | 267 | 4.90/5.0 |
Analyzing the strategies of top hosts, such as their property selection, pricing, and guest communication, can offer valuable lessons for optimizing your own Airbnb operations in Anchieta.
Dive Deeper: Advanced Anchieta STR Market Data (2026)
Ready to unlock more insights? AirROI provides access to advanced metrics and comprehensive Airbnb data for Anchieta. Explore detailed analytics beyond this report to refine your investment strategy, optimize pricing, and maximize your vacation rental profits.
Explore Advanced MetricsAnchieta Short-Term Rental Market Composition (2026): Property & Room Types
Room Type Distribution
Property Type Distribution
Market Composition Insights for Anchieta
- The Anchieta Airbnb market composition is heavily skewed towards Entire Home/Apt listings, which make up 95.4% of the 392 active rentals. This indicates strong guest preference for privacy and space.
- Looking at the property type distribution in Anchieta, House properties are the most common (54.8%), reflecting the local real estate landscape.
- Houses represent a significant 54.8% portion, catering likely to families or larger groups.
- Smaller segments like hotel/boutique, others (combined 4.1%) offer potential for unique stay experiences.
Anchieta Airbnb Room Capacity Analysis (2026): Bedroom Distribution
Distribution of Listings by Number of Bedrooms
Room Capacity Insights for Anchieta
- The dominant room capacity in Anchieta is 3 bedrooms listings, making up 32.4% of the market. This suggests a strong demand for properties suitable for families or small groups.
- Together, 3 bedrooms and 2 bedrooms properties represent 56.6% of the active Airbnb listings in Anchieta, indicating a high concentration in these sizes.
- A significant 52.6% of listings offer 3+ bedrooms, catering to larger groups and families seeking more space in Anchieta.
Anchieta Vacation Rental Guest Capacity Trends (2026)
Distribution of Listings by Guest Capacity
Guest Capacity Insights for Anchieta
- The most common guest capacity trend in Anchieta vacation rentals is listings accommodating 8+ guests (50%). This suggests the primary traveler segment is likely larger groups.
- Properties designed for 8+ guests and 6 guests dominate the Anchieta STR market, accounting for 64.0% of listings.
- 71.7% of properties accommodate 6+ guests, serving the market segment for larger families or group travel in Anchieta.
- On average, properties in Anchieta are equipped to host 6.4 guests.
Anchieta Airbnb Booking Patterns (2026): Available vs. Booked Days
Available Days Distribution
Booked Days Distribution
Booking Pattern Insights for Anchieta
- The most common availability pattern in Anchieta falls within the 271-366 days range, representing 82.1% of listings. This suggests many properties have significant open periods on their calendars.
- Approximately 97.2% of listings show high availability (181+ days open annually), indicating potential for increased bookings or specific owner usage patterns.
- For booked days, the 31-90 days range is most frequent in Anchieta (42.6%), reflecting common guest stay durations or potential owner blocking patterns.
- A notable 3.3% of properties secure long booking periods (181+ days booked per year), highlighting successful long-term rental strategies or significant owner usage.
Anchieta Airbnb Minimum Stay Requirements Analysis
Distribution of Listings by Minimum Night Requirement
1 Night
47 listings
12% of total
2 Nights
136 listings
34.7% of total
3 Nights
41 listings
10.5% of total
4-6 Nights
22 listings
5.6% of total
7-29 Nights
2 listings
0.5% of total
30+ Nights
144 listings
36.7% of total
Key Insights
- The most prevalent minimum stay requirement in Anchieta is 30+ Nights, adopted by 36.7% of listings. This highlights the market's preference for longer commitments.
- A significant segment (36.7%) caters to monthly stays (30+ nights) in Anchieta, pointing to opportunities in the extended-stay market.
Recommendations
- Align with the market by considering a 30+ Nights minimum stay, as 36.7% of Anchieta hosts use this setting.
- If feasible, allowing 1-night stays, especially midweek or during low season, could capture last-minute bookings, as only 12% currently do.
- A 2-night minimum appears standard (34.7%). Consider this for weekends or peak periods.
- Explore offering discounts for stays of 30+ nights to attract the 36.7% of the market seeking extended stays.
- Adjust minimum nights based on seasonality – potentially shorter during low season and longer during peak demand periods in Anchieta.
Anchieta Airbnb Cancellation Policy Trends Analysis (2026)
Limited
12 listings
3.1% of total
Super Strict 30 Days
3 listings
0.8% of total
Flexible
78 listings
20% of total
Moderate
60 listings
15.4% of total
Firm
178 listings
45.6% of total
Strict
59 listings
15.1% of total
Cancellation Policy Insights for Anchieta
- The prevailing Airbnb cancellation policy trend in Anchieta is Firm, used by 45.6% of listings.
- A majority (60.7%) of hosts in Anchieta utilize Firm or Strict policies, indicating a market where hosts prioritize booking security.
Recommendations for Hosts
- Consider adopting a Firm policy to align with the 45.6% market standard in Anchieta.
- Regularly review your cancellation policy against competitors and market demand shifts in Anchieta.
Anchieta STR Booking Lead Time Analysis (2026)
Average Booking Lead Time by Month
Booking Lead Time Insights for Anchieta
- The overall average booking lead time for vacation rentals in Anchieta is 44 days.
- Guests book furthest in advance for stays during December (average 59 days), likely coinciding with peak travel demand or local events.
- The shortest booking windows occur for stays in June (average 20 days), indicating more last-minute travel plans during this time.
- Seasonally, Winter (53 days avg.) sees the longest lead times, while Summer (25 days avg.) has the shortest, reflecting typical travel planning cycles.
Recommendations for Hosts
- Use the overall average lead time (44 days) as a baseline for your pricing and availability strategy in Anchieta.
- For December stays, consider implementing length-of-stay discounts or slightly higher rates for bookings made less than 59 days out to capitalize on advance planning.
- Target marketing efforts for the Winter season well in advance (at least 53 days) to capture early planners.
- Monitor your own booking lead times against these Anchieta averages to identify opportunities for dynamic pricing adjustments.
Popular & Essential Airbnb Amenities in Anchieta (2026)
Amenity Prevalence
Amenity Insights for Anchieta
- Essential amenities in Anchieta that guests expect include: Wifi. Lacking these (this) could significantly impact bookings.
- Popular amenities like TV, Kitchen, Free parking on premises are common but not universal. Offering these can provide a competitive edge.
Recommendations for Hosts
- Ensure your listing includes all essential amenities for Anchieta: Wifi.
- Prioritize adding missing essentials: Wifi.
- Consider adding popular differentiators like TV or Kitchen to increase appeal.
- Highlight unique or less common amenities you offer (e.g., hot tub, dedicated workspace, EV charger) in your listing description and photos.
- Regularly check competitor amenities in Anchieta to stay competitive.
Anchieta Airbnb Guest Demographics & Profile Analysis (2026)
Guest Profile Summary for Anchieta
- The typical guest profile for Airbnb in Anchieta consists of primarily domestic travelers (97%), often arriving from nearby Belo Horizonte, typically belonging to the Post-2000s (Gen Z/Alpha) group (50%), primarily speaking Portuguese or English.
- Domestic travelers account for 97.2% of guests.
- Key international markets include Brazil (97.2%) and United States (0.6%).
- Top languages spoken are Portuguese (61.1%) followed by English (25.5%).
- A significant demographic segment is the Post-2000s (Gen Z/Alpha) group, representing 50% of guests.
Recommendations for Hosts
- Target domestic marketing efforts towards travelers from Belo Horizonte and Espírito Santo.
- Tailor amenities and listing descriptions to appeal to the dominant Post-2000s (Gen Z/Alpha) demographic (e.g., highlight fast WiFi, smart home features, local guides).
- Highlight unique local experiences or amenities relevant to the primary guest profile.
- Consider seasonal promotions aligned with peak travel times for key origin markets.
Nearby Short-Term Rental Market Comparison
How does the Anchieta Airbnb market stack up against its neighbors? Compare key performance metrics like average monthly revenue, ADR, and occupancy rates in surrounding areas to understand the broader regional STR landscape.
| Market | Active Properties | Monthly Revenue | Daily Rate | Avg. Occupancy |
|---|---|---|---|---|
| Domingos Martins | 622 | $724 | $114.29 | 27% |
| Santa Teresa | 306 | $708 | $117.81 | 25% |
| Marechal Floriano | 129 | $682 | $110.48 | 26% |
| Venda Nova do Imigrante | 91 | $625 | $114.74 | 22% |
| Castelo | 15 | $587 | $165.25 | 19% |
| Vila Velha | 1,780 | $556 | $62.02 | 40% |
| Alfredo Chaves | 59 | $524 | $100.44 | 20% |
| Vitória | 780 | $502 | $48.94 | 44% |
| Vargem Alta | 24 | $490 | $104.97 | 21% |
| Espera Feliz | 33 | $475 | $97.49 | 22% |