Santa Leopoldina Airbnb Market Analysis 2026: Short Term Rental Data & Vacation Rental Statistics in Espírito Santo, Brazil
Is Airbnb profitable in Santa Leopoldina in 2026? Explore comprehensive Airbnb analytics for Santa Leopoldina, Espírito Santo, Brazil to uncover income potential. This 2026 STR market report for Santa Leopoldina, based on AirROI data from February 2025 to January 2026, reveals key trends in the niche market of 20 active listings.
Whether you're considering an Airbnb investment in Santa Leopoldina, optimizing your existing vacation rental, or exploring rental arbitrage opportunities, understanding the Santa Leopoldina Airbnb data is crucial. Leveraging the low regulation environment is key to maximizing your short term rental income potential. Let's dive into the specifics.
Key Santa Leopoldina Airbnb Performance Metrics Overview
Monthly Airbnb Revenue Variations & Income Potential in Santa Leopoldina (2026)
Understanding the monthly revenue variations for Airbnb listings in Santa Leopoldina is key to maximizing your short term rental income potential. Seasonality significantly impacts earnings. Our analysis, based on data from the past 12 months, shows that the peak revenue month for STRs in Santa Leopoldina is typically March, while November often presents the lowest earnings, highlighting opportunities for strategic pricing adjustments during shoulder and low seasons. Explore the typical Airbnb income in Santa Leopoldina across different performance tiers:
- Best-in-class properties (Top 10%) achieve $1,142+ monthly, often utilizing dynamic pricing and superior guest experiences.
- Strong performing properties (Top 25%) earn $649 or more, indicating effective management and desirable locations/amenities.
- Typical properties (Median) generate around $345 per month, representing the average market performance.
- Entry-level properties (Bottom 25%) see earnings around $204, often with potential for optimization.
Average Monthly Airbnb Earnings Trend in Santa Leopoldina
Santa Leopoldina Airbnb Occupancy Rate Trends (2026)
Maximize your bookings by understanding the Santa Leopoldina STR occupancy trends. Seasonal demand shifts significantly influence how often properties are booked. Typically, Junesees the highest demand (peak season occupancy), while November experiences the lowest (low season). Effective strategies, like adjusting minimum stays or offering promotions, can boost occupancy during slower periods. Here's how different property tiers perform in Santa Leopoldina:
- Best-in-class properties (Top 10%) achieve 46%+ occupancy, indicating high desirability and potentially optimized availability.
- Strong performing properties (Top 25%) maintain 28% or higher occupancy, suggesting good market fit and guest satisfaction.
- Typical properties (Median) have an occupancy rate around 16%.
- Entry-level properties (Bottom 25%) average 9% occupancy, potentially facing higher vacancy.
Average Monthly Occupancy Rate Trend in Santa Leopoldina
Average Daily Rate (ADR) Airbnb Trends in Santa Leopoldina (2026)
Effective short term rental pricing strategy in Santa Leopoldina involves understanding monthly ADR fluctuations. The Average Daily Rate (ADR) for Airbnb in Santa Leopoldina typically peaks in August and dips lowest during February. Leveraging Airbnb dynamic pricing tools or strategies based on this seasonality can significantly boost revenue. Here's a look at the typical nightly rates achieved:
- Best-in-class properties (Top 10%) command rates of $194+ per night, often due to premium features or locations.
- Strong performing properties (Top 25%) achieve nightly rates of $142 or more.
- Typical properties (Median) charge around $58 per night.
- Entry-level properties (Bottom 25%) earn around $48 per night.
Average Daily Rate (ADR) Trend by Month in Santa Leopoldina
Get Live Santa Leopoldina Market Intelligence 👇

Explore Real-time Analytics
Airbnb Seasonality Analysis & Trends in Santa Leopoldina (2026)
Peak Season (March, June, April)
- Revenue averages $659 per month
- Occupancy rates average 27.6%
- Daily rates average $94
Shoulder Season
- Revenue averages $501 per month
- Occupancy maintains around 21.5%
- Daily rates hold near $93
Low Season (January, October, November)
- Revenue drops to average $383 per month
- Occupancy decreases to average 15.7%
- Daily rates adjust to average $90
Seasonality Insights for Santa Leopoldina
- The Airbnb seasonality in Santa Leopoldina shows highly seasonal trends requiring careful strategy. While the sections above show seasonal averages, it's also insightful to look at the extremes:
- During the high season, the absolute peak month showcases Santa Leopoldina's highest earning potential, with monthly revenues capable of climbing to $731, occupancy reaching a high of 29.6%, and ADRs peaking at $97.
- Conversely, the slowest single month of the year, typically falling within the low season, marks the market's lowest point. In this month, revenue might dip to $341, occupancy could drop to 14.2%, and ADRs may adjust down to $89.
- Understanding both the seasonal averages and these monthly peaks and troughs in revenue, occupancy, and ADR is crucial for maximizing your Airbnb profit potential in Santa Leopoldina.
Seasonal Strategies for Maximizing Profit
- Peak Season: Maximize revenue through premium pricing and potentially longer minimum stays. Ensure high availability.
- Low Season: Offer competitive pricing, special promotions (e.g., extended stay discounts), and flexible cancellation policies. Target off-season travelers like remote workers or budget-conscious guests.
- Shoulder Seasons: Implement dynamic pricing that balances peak and low rates. Target weekend travelers or specific events. Offer slightly more flexible terms than peak season.
- Regularly analyze your own performance against these Santa Leopoldina seasonality benchmarks and adjust your pricing and availability strategy accordingly.
Best Areas for Airbnb Investment in Santa Leopoldina (2026)
Exploring the top neighborhoods for short-term rentals in Santa Leopoldina? This section highlights key areas, outlining why they are attractive for hosts and guests, along with notable local attractions. Consider these locations based on your target guest profile and investment strategy.
| Neighborhood / Area | Why Host Here? (Target Guests & Appeal) | Key Attractions & Landmarks |
|---|---|---|
| Centro | The heart of Santa Leopoldina, offering a lively atmosphere with shops, cafes, and cultural events. A perfect hub for tourists wanting to explore the town and its heritage. | Historic Church of Santa Leopoldina, Local markets, Cultural festivals, Parks, Restaurants |
| Serra do Rei | A scenic area known for its natural beauty and outdoor activities. Ideal for nature lovers and those looking for a tranquil escape. | Hiking trails, Observation points, Natural parks, Local wildlife, Picnic areas |
| Riviera do Ceará | Known for its beautiful landscapes and proximity to rivers, this area attracts those looking for relaxation and water activities like fishing and kayaking. | Riverside parks, Fishing spots, Kayaking tours, BBQ areas, Local cuisine |
| Pico do Itabirito | Famous for its hiking trails and stunning views, a great spot for adventure seekers and those who enjoy panoramic landscapes. | Hiking trails, Scenic viewpoints, Camping spots, Nature reserves, Wildlife watching |
| Zona Rural | The rural area surrounding the town, perfect for guests seeking a rustic experience and the beauty of the countryside, offering farm stays and agricultural tours. | Organic farms, Agrotourism, Traditional cuisine, Nature walks, Rural festivals |
| Morro do Chapéu | Known for its serene environment and picturesque views, this area is ideal for guests looking for peaceful retreats and nature experiences. | Hiking routes, Photography spots, Eco-tourism activities, Local artisan crafts, Cultural experiences |
| Praia de Santa Leopoldina | A charming beach area offering relaxation and coastal activities. Suitable for families and beach lovers. | Beach activities, Coastal restaurants, Sunbathing spots, Boardwalk, Fishing areas |
| Parque Natural Municipal | A natural park that provides a recreational space for visitors with opportunities for picnics and exploration of native flora and fauna. | Nature trails, Educational programs, Bird watching, Family-friendly areas, Camping spots |
Understanding Airbnb License Requirements & STR Laws in Santa Leopoldina (2026)
While Santa Leopoldina, Espírito Santo, Brazil currently shows low STR regulations, specific Airbnb license requirements might still exist or change. Always verify the latest short term rental regulations and Airbnb license requirements directly with local government authorities for Santa Leopoldina to ensure full compliance before hosting.
(Source: AirROI data, 2026, finding no licensed listings among those analyzed)
Top Performing Airbnb Properties in Santa Leopoldina (2026)
Benchmark your potential! Explore examples of top-performing Airbnb properties in Santa Leopoldinabased on Trailing Twelve Month (TTM) revenue. Analyze their characteristics, revenue, occupancy rate, and ADR to understand what drives success in this market.
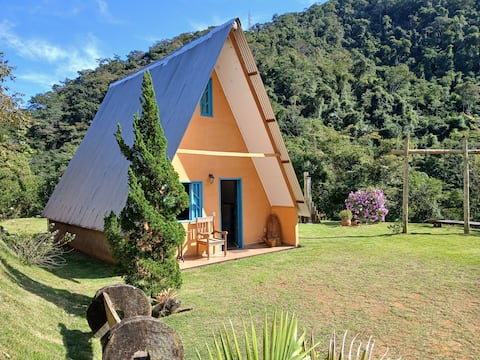
Loft Chalet with Forest View
Entire Place • 2 bedrooms
Happy Nook. Comfort of your home. Sta Teresa
Entire Place • 3 bedrooms
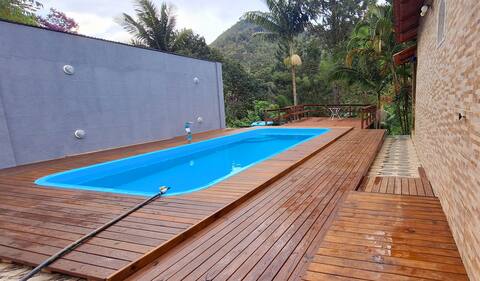
Countryside house
Entire Place • 4 bedrooms

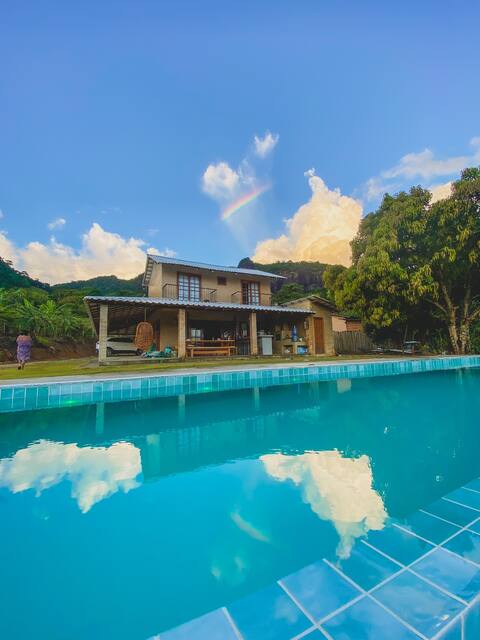
San Carlos Ranch (Group Rental)
Entire Place • 11 bedrooms
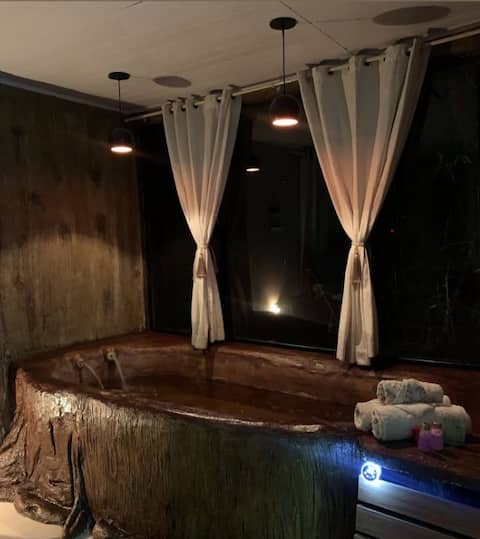
Romantic Chalet with Jacuzzi in the middle of the woods!
Entire Place • 1 bedroom
House on a farm
Entire Place • 4 bedrooms
Note: Performance varies based on location, size, amenities, seasonality, and management quality. Data reflects the past 12 months.
Top Performing Airbnb Hosts in Santa Leopoldina (2026)
Learn from the best! This table showcases top-performing Airbnb hosts in Santa Leopoldina based on the number of properties managed and estimated total revenue over the past year. Analyze their scale and performance metrics.
| Host Name | Properties | Grossing Revenue | Stay Reviews | Avg Rating |
|---|---|---|---|---|
| Edna | 1 | $12,197 | 58 | 4.97/5.0 |
| Sossai | 6 | $10,170 | 407 | 4.95/5.0 |
| Aristides | 1 | $9,022 | 2 | Not Rated |
| Camila | 1 | $6,970 | 2 | Not Rated |
| Sitio San Carlos | 1 | $6,413 | 1 | Not Rated |
| Sítio Imperial | 1 | $6,177 | 24 | 4.29/5.0 |
| Joyce | 1 | $6,089 | 1 | Not Rated |
| Igor Talles | 1 | $5,826 | 61 | 4.87/5.0 |
| Rosangela | 1 | $5,412 | 14 | 4.86/5.0 |
| Camila | 1 | $4,316 | 1 | Not Rated |
Analyzing the strategies of top hosts, such as their property selection, pricing, and guest communication, can offer valuable lessons for optimizing your own Airbnb operations in Santa Leopoldina.
Dive Deeper: Advanced Santa Leopoldina STR Market Data (2026)
Ready to unlock more insights? AirROI provides access to advanced metrics and comprehensive Airbnb data for Santa Leopoldina. Explore detailed analytics beyond this report to refine your investment strategy, optimize pricing, and maximize your vacation rental profits.
Explore Advanced MetricsSanta Leopoldina Short-Term Rental Market Composition (2026): Property & Room Types
Room Type Distribution
Property Type Distribution
Market Composition Insights for Santa Leopoldina
- The Santa Leopoldina Airbnb market composition is heavily skewed towards Entire Home/Apt listings, which make up 100% of the 20 active rentals. This indicates strong guest preference for privacy and space.
- Looking at the property type distribution in Santa Leopoldina, House properties are the most common (75%), reflecting the local real estate landscape.
- Houses represent a significant 75% portion, catering likely to families or larger groups.
Santa Leopoldina Airbnb Room Capacity Analysis (2026): Bedroom Distribution
Distribution of Listings by Number of Bedrooms
Room Capacity Insights for Santa Leopoldina
- The dominant room capacity in Santa Leopoldina is 1 bedroom listings, making up 45% of the market. This suggests a strong demand for properties suitable for couples or solo travelers.
- Together, 1 bedroom and 3 bedrooms properties represent 65.0% of the active Airbnb listings in Santa Leopoldina, indicating a high concentration in these sizes.
- A significant 35.0% of listings offer 3+ bedrooms, catering to larger groups and families seeking more space in Santa Leopoldina.
Santa Leopoldina Vacation Rental Guest Capacity Trends (2026)
Distribution of Listings by Guest Capacity
Guest Capacity Insights for Santa Leopoldina
- The most common guest capacity trend in Santa Leopoldina vacation rentals is listings accommodating 8+ guests (35%). This suggests the primary traveler segment is likely larger groups.
- Properties designed for 8+ guests and 2 guests dominate the Santa Leopoldina STR market, accounting for 70.0% of listings.
- 45.0% of properties accommodate 6+ guests, serving the market segment for larger families or group travel in Santa Leopoldina.
- On average, properties in Santa Leopoldina are equipped to host 4.8 guests.
Santa Leopoldina Airbnb Booking Patterns (2026): Available vs. Booked Days
Available Days Distribution
Booked Days Distribution
Booking Pattern Insights for Santa Leopoldina
- The most common availability pattern in Santa Leopoldina falls within the 271-366 days range, representing 85% of listings. This suggests many properties have significant open periods on their calendars.
- Approximately 95.0% of listings show high availability (181+ days open annually), indicating potential for increased bookings or specific owner usage patterns.
- For booked days, the 31-90 days range is most frequent in Santa Leopoldina (45%), reflecting common guest stay durations or potential owner blocking patterns.
- A notable 5.0% of properties secure long booking periods (181+ days booked per year), highlighting successful long-term rental strategies or significant owner usage.
Santa Leopoldina Airbnb Minimum Stay Requirements Analysis
Distribution of Listings by Minimum Night Requirement
1 Night
4 listings
20% of total
2 Nights
15 listings
75% of total
30+ Nights
1 listings
5% of total
Key Insights
- The most prevalent minimum stay requirement in Santa Leopoldina is 2 Nights, adopted by 75% of listings. This highlights the market's preference for shorter, flexible bookings.
- A strong majority (95.0%) of the Santa Leopoldina Airbnb data shows acceptance of very short stays (1-2 nights), indicating a dynamic, high-turnover market.
Recommendations
- Align with the market by considering a 2 Nights minimum stay, as 75% of Santa Leopoldina hosts use this setting.
- If feasible, allowing 1-night stays, especially midweek or during low season, could capture last-minute bookings, as only 20% currently do.
- Adjust minimum nights based on seasonality – potentially shorter during low season and longer during peak demand periods in Santa Leopoldina.
Santa Leopoldina Airbnb Cancellation Policy Trends Analysis (2026)
Limited
7 listings
35% of total
Flexible
3 listings
15% of total
Moderate
4 listings
20% of total
Firm
5 listings
25% of total
Strict
1 listings
5% of total
Cancellation Policy Insights for Santa Leopoldina
- The prevailing Airbnb cancellation policy trend in Santa Leopoldina is Limited, used by 35% of listings.
- There's a relatively balanced mix between guest-friendly (35.0%) and stricter (30.0%) policies, offering choices for different guest needs.
- Strict cancellation policies are quite rare (5%), potentially making listings with this policy less competitive unless justified by high demand or property type.
Recommendations for Hosts
- Consider adopting a Limited policy to align with the 35% market standard in Santa Leopoldina.
- Using a Strict policy might deter some guests, as only 5% of listings use it. Evaluate if potential revenue protection outweighs possible lower booking rates.
- Regularly review your cancellation policy against competitors and market demand shifts in Santa Leopoldina.
Santa Leopoldina STR Booking Lead Time Analysis (2026)
Average Booking Lead Time by Month
Booking Lead Time Insights for Santa Leopoldina
- The overall average booking lead time for vacation rentals in Santa Leopoldina is 27 days.
- Guests book furthest in advance for stays during March (average 47 days), likely coinciding with peak travel demand or local events.
- The shortest booking windows occur for stays in August (average 11 days), indicating more last-minute travel plans during this time.
- Seasonally, Spring (30 days avg.) sees the longest lead times, while Fall (20 days avg.) has the shortest, reflecting typical travel planning cycles.
Recommendations for Hosts
- Use the overall average lead time (27 days) as a baseline for your pricing and availability strategy in Santa Leopoldina.
- For March stays, consider implementing length-of-stay discounts or slightly higher rates for bookings made less than 47 days out to capitalize on advance planning.
- During August, focus on last-minute booking availability and promotions, as guests book with very short notice (11 days avg.).
- Target marketing efforts for the Spring season well in advance (at least 30 days) to capture early planners.
- Monitor your own booking lead times against these Santa Leopoldina averages to identify opportunities for dynamic pricing adjustments.
Popular & Essential Airbnb Amenities in Santa Leopoldina (2026)
Amenity Prevalence
Amenity Insights for Santa Leopoldina
- Essential amenities in Santa Leopoldina that guests expect include: Free parking on premises, Wifi, Backyard, TV, Dishes and silverware. Lacking these (any) could significantly impact bookings.
- Popular amenities like Stove, Kitchen, Patio or balcony are common but not universal. Offering these can provide a competitive edge.
Recommendations for Hosts
- Ensure your listing includes all essential amenities for Santa Leopoldina: Free parking on premises, Wifi, Backyard, TV, Dishes and silverware.
- Prioritize adding missing essentials: Backyard, TV, Dishes and silverware.
- Consider adding popular differentiators like Stove or Kitchen to increase appeal.
- Highlight unique or less common amenities you offer (e.g., hot tub, dedicated workspace, EV charger) in your listing description and photos.
- Regularly check competitor amenities in Santa Leopoldina to stay competitive.
Santa Leopoldina Airbnb Guest Demographics & Profile Analysis (2026)
Guest Profile Summary for Santa Leopoldina
- The typical guest profile for Airbnb in Santa Leopoldina consists of primarily domestic travelers (98%), often arriving from nearby Espírito Santo, typically belonging to the Post-2000s (Gen Z/Alpha) group (50%), primarily speaking Portuguese or English.
- Domestic travelers account for 98.1% of guests.
- Key international markets include Brazil (98.1%) and Italy (1.9%).
- Top languages spoken are Portuguese (47.6%) followed by English (35.7%).
- A significant demographic segment is the Post-2000s (Gen Z/Alpha) group, representing 50% of guests.
Recommendations for Hosts
- Target domestic marketing efforts towards travelers from Espírito Santo and Vila Velha.
- Tailor amenities and listing descriptions to appeal to the dominant Post-2000s (Gen Z/Alpha) demographic (e.g., highlight fast WiFi, smart home features, local guides).
- Highlight unique local experiences or amenities relevant to the primary guest profile.
- Consider seasonal promotions aligned with peak travel times for key origin markets.
Nearby Short-Term Rental Market Comparison
How does the Santa Leopoldina Airbnb market stack up against its neighbors? Compare key performance metrics like average monthly revenue, ADR, and occupancy rates in surrounding areas to understand the broader regional STR landscape.
| Market | Active Properties | Monthly Revenue | Daily Rate | Avg. Occupancy |
|---|---|---|---|---|
| Domingos Martins | 622 | $724 | $114.29 | 27% |
| Santa Teresa | 306 | $708 | $117.81 | 25% |
| Marechal Floriano | 129 | $682 | $110.48 | 26% |
| Venda Nova do Imigrante | 91 | $625 | $114.74 | 22% |
| Castelo | 15 | $587 | $165.25 | 19% |
| Vila Velha | 1,780 | $556 | $62.02 | 40% |
| Anchieta | 392 | $552 | $119.34 | 24% |
| Alfredo Chaves | 59 | $524 | $100.44 | 20% |
| Vitória | 780 | $502 | $48.94 | 44% |
| Vargem Alta | 24 | $490 | $104.97 | 21% |