Tianguá Airbnb Market Analysis 2026: Short Term Rental Data & Vacation Rental Statistics in Ceará, Brazil
Is Airbnb profitable in Tianguá in 2026? Explore comprehensive Airbnb analytics for Tianguá, Ceará, Brazil to uncover income potential. This 2026 STR market report for Tianguá, based on AirROI data from February 2025 to January 2026, reveals key trends in the niche market of 25 active listings.
Whether you're considering an Airbnb investment in Tianguá, optimizing your existing vacation rental, or exploring rental arbitrage opportunities, understanding the Tianguá Airbnb data is crucial. Leveraging the low regulation environment is key to maximizing your short term rental income potential. Let's dive into the specifics.
Key Tianguá Airbnb Performance Metrics Overview
Monthly Airbnb Revenue Variations & Income Potential in Tianguá (2026)
Understanding the monthly revenue variations for Airbnb listings in Tianguá is key to maximizing your short term rental income potential. Seasonality significantly impacts earnings. Our analysis, based on data from the past 12 months, shows that the peak revenue month for STRs in Tianguá is typically February, while June often presents the lowest earnings, highlighting opportunities for strategic pricing adjustments during shoulder and low seasons. Explore the typical Airbnb income in Tianguá across different performance tiers:
- Best-in-class properties (Top 10%) achieve $1,394+ monthly, often utilizing dynamic pricing and superior guest experiences.
- Strong performing properties (Top 25%) earn $484 or more, indicating effective management and desirable locations/amenities.
- Typical properties (Median) generate around $225 per month, representing the average market performance.
- Entry-level properties (Bottom 25%) see earnings around $86, often with potential for optimization.
Average Monthly Airbnb Earnings Trend in Tianguá
Tianguá Airbnb Occupancy Rate Trends (2026)
Maximize your bookings by understanding the Tianguá STR occupancy trends. Seasonal demand shifts significantly influence how often properties are booked. Typically, Februarysees the highest demand (peak season occupancy), while January experiences the lowest (low season). Effective strategies, like adjusting minimum stays or offering promotions, can boost occupancy during slower periods. Here's how different property tiers perform in Tianguá:
- Best-in-class properties (Top 10%) achieve 43%+ occupancy, indicating high desirability and potentially optimized availability.
- Strong performing properties (Top 25%) maintain 30% or higher occupancy, suggesting good market fit and guest satisfaction.
- Typical properties (Median) have an occupancy rate around 16%.
- Entry-level properties (Bottom 25%) average 10% occupancy, potentially facing higher vacancy.
Average Monthly Occupancy Rate Trend in Tianguá
Average Daily Rate (ADR) Airbnb Trends in Tianguá (2026)
Effective short term rental pricing strategy in Tianguá involves understanding monthly ADR fluctuations. The Average Daily Rate (ADR) for Airbnb in Tianguá typically peaks in September and dips lowest during April. Leveraging Airbnb dynamic pricing tools or strategies based on this seasonality can significantly boost revenue. Here's a look at the typical nightly rates achieved:
- Best-in-class properties (Top 10%) command rates of $152+ per night, often due to premium features or locations.
- Strong performing properties (Top 25%) achieve nightly rates of $59 or more.
- Typical properties (Median) charge around $42 per night.
- Entry-level properties (Bottom 25%) earn around $29 per night.
Average Daily Rate (ADR) Trend by Month in Tianguá
Get Live Tianguá Market Intelligence 👇

Explore Real-time Analytics
Airbnb Seasonality Analysis & Trends in Tianguá (2026)
Peak Season (February, July, May)
- Revenue averages $597 per month
- Occupancy rates average 27.9%
- Daily rates average $61
Shoulder Season
- Revenue averages $455 per month
- Occupancy maintains around 20.0%
- Daily rates hold near $60
Low Season (January, June, August)
- Revenue drops to average $362 per month
- Occupancy decreases to average 18.5%
- Daily rates adjust to average $61
Seasonality Insights for Tianguá
- The Airbnb seasonality in Tianguá shows moderate seasonality with distinct peak and low periods. While the sections above show seasonal averages, it's also insightful to look at the extremes:
- During the high season, the absolute peak month showcases Tianguá's highest earning potential, with monthly revenues capable of climbing to $612, occupancy reaching a high of 34.8%, and ADRs peaking at $64.
- Conversely, the slowest single month of the year, typically falling within the low season, marks the market's lowest point. In this month, revenue might dip to $339, occupancy could drop to 15.4%, and ADRs may adjust down to $59.
- Understanding both the seasonal averages and these monthly peaks and troughs in revenue, occupancy, and ADR is crucial for maximizing your Airbnb profit potential in Tianguá.
Seasonal Strategies for Maximizing Profit
- Peak Season: Maximize revenue through premium pricing and potentially longer minimum stays. Ensure high availability.
- Low Season: Offer competitive pricing, special promotions (e.g., extended stay discounts), and flexible cancellation policies. Target off-season travelers like remote workers or budget-conscious guests.
- Shoulder Seasons: Implement dynamic pricing that balances peak and low rates. Target weekend travelers or specific events. Offer slightly more flexible terms than peak season.
- Regularly analyze your own performance against these Tianguá seasonality benchmarks and adjust your pricing and availability strategy accordingly.
Best Areas for Airbnb Investment in Tianguá (2026)
Exploring the top neighborhoods for short-term rentals in Tianguá? This section highlights key areas, outlining why they are attractive for hosts and guests, along with notable local attractions. Consider these locations based on your target guest profile and investment strategy.
| Neighborhood / Area | Why Host Here? (Target Guests & Appeal) | Key Attractions & Landmarks |
|---|---|---|
| Centro | The city center of Tianguá offers a vibrant cultural scene with its local markets, restaurants, and historical sites. It's a great location for tourists looking to immerse themselves in the local lifestyle. | Municipal Market, Tianguá Cathedral, Almeida Silva Street, Cultural Center, Plaza of the City Hall |
| Serra do Lobo | A stunning natural area just outside of Tianguá, known for its beautiful landscapes and outdoor activities. Perfect for nature lovers and adventure seekers looking to explore hiking trails and waterfalls. | Waterfalls of Lobo, Hiking Trails, Scenic Views, Birdwatching, Natural Preserves |
| Praia do Morro Branco | Located a bit further away, this famous beach is known for its beautiful cliffs and dunes, attracting tourists looking for beach relaxation and adventure sports like kitesurfing. | Cliffs of Morro Branco, Beach Activities, Dune Tours, Nearby Restaurants, Craft Markets |
| Caminho do Roque | A tranquil and picturesque rural area known for its welcoming atmosphere and stunning countryside views. Ideal for guests seeking a peaceful retreat from urban life. | Scenic Countryside, Cultural Events, Local Farms, Traditional Cuisine, Nature Trails |
| Parque Nacional de Jericoacoara | Though a bit farther, this national park is famous for its landscapes and lagoons, attracting a steady flow of tourists looking for natural beauty and water sports. | Duna do Pôr do Sol, Lagoa do Paraíso, Sunset Dunes, Kitesurfing Spots, Jericoacoara Village |
| São Gonçalo do Amarante | Known for its cultural heritage and festivals, this area attracts visitors interested in local traditions and events, making it a perfect spot for Airbnb investments during festival seasons. | Local Festivals, Cultural Heritage Sites, Traditional Foods, Artisan Markets, Community Events |
| Cocobó | An emerging area with beautiful nature and fresh air, attracting families and individuals looking for a weekend getaway surrounded by nature and tranquility. | Nature Walks, Picnic Areas, Local Wildlife, Family-Friendly Activities, Community Centers |
| Bela Vista | This lively neighborhood offers good access to local amenities and attractions, making it an attractive option for tourists wanting convenience and a taste of local life. | Shopping Areas, Local Restaurants, Parks, Cafes, Entertainment Venues |
Understanding Airbnb License Requirements & STR Laws in Tianguá (2026)
While Tianguá, Ceará, Brazil currently shows low STR regulations, specific Airbnb license requirements might still exist or change. Always verify the latest short term rental regulations and Airbnb license requirements directly with local government authorities for Tianguá to ensure full compliance before hosting.
(Source: AirROI data, 2026, finding no licensed listings among those analyzed)
Top Performing Airbnb Properties in Tianguá (2026)
Benchmark your potential! Explore examples of top-performing Airbnb properties in Tianguábased on Trailing Twelve Month (TTM) revenue. Analyze their characteristics, revenue, occupancy rate, and ADR to understand what drives success in this market.
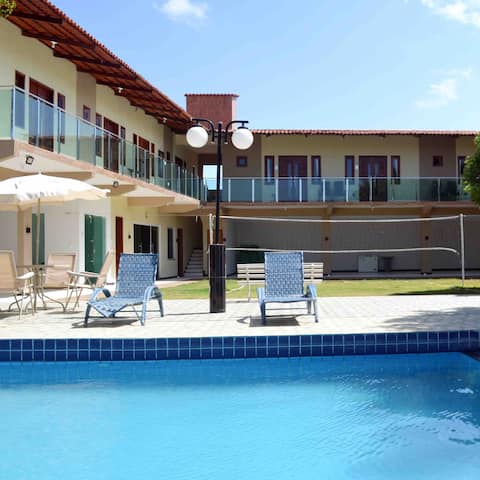
Chácara de Serra ⛰
Entire Place • 7 bedrooms
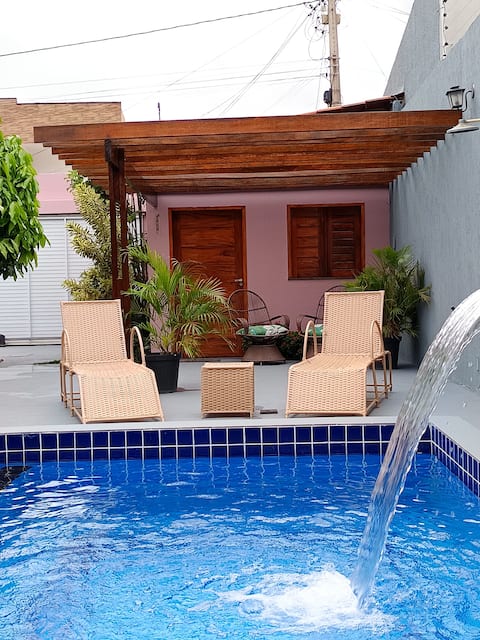
House with 3 en-suite bedrooms, swimming pool, barbecue area.
Entire Place • 3 bedrooms
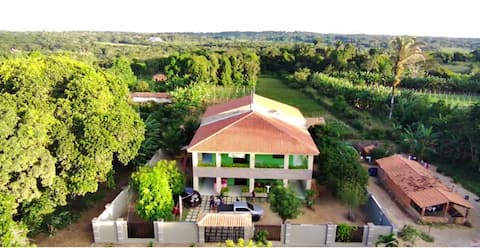
Sítio Escondido
Entire Place • 5 bedrooms

Chácara Landscap Jaburu
Entire Place • 3 bedrooms

Complete farmhouse with leisure area.
Entire Place • 3 bedrooms

Full and spacious apartment in Serra da Ibiapaba
Entire Place • 2 bedrooms
Note: Performance varies based on location, size, amenities, seasonality, and management quality. Data reflects the past 12 months.
Top Performing Airbnb Hosts in Tianguá (2026)
Learn from the best! This table showcases top-performing Airbnb hosts in Tianguá based on the number of properties managed and estimated total revenue over the past year. Analyze their scale and performance metrics.
| Host Name | Properties | Grossing Revenue | Stay Reviews | Avg Rating |
|---|---|---|---|---|
| Aercio Vasconcelos | 1 | $18,491 | 17 | 4.76/5.0 |
| Roberto | 1 | $17,609 | 9 | 5.00/5.0 |
| Charliane | 4 | $8,156 | 15 | 4.75/5.0 |
| Jaqueline Freitas | 1 | $7,815 | 2 | Not Rated |
| Rommell | 1 | $5,487 | 4 | 4.50/5.0 |
| Diêgo | 1 | $5,456 | 12 | 4.92/5.0 |
| Alessandra Lheppiu | 3 | $5,279 | 57 | 4.99/5.0 |
| Kevin | 2 | $4,910 | 56 | 4.85/5.0 |
| Susan | 2 | $2,803 | 4 | Not Rated |
| Sergio Pinheiro | 3 | $1,728 | 21 | 4.74/5.0 |
Analyzing the strategies of top hosts, such as their property selection, pricing, and guest communication, can offer valuable lessons for optimizing your own Airbnb operations in Tianguá.
Dive Deeper: Advanced Tianguá STR Market Data (2026)
Ready to unlock more insights? AirROI provides access to advanced metrics and comprehensive Airbnb data for Tianguá. Explore detailed analytics beyond this report to refine your investment strategy, optimize pricing, and maximize your vacation rental profits.
Explore Advanced MetricsTianguá Short-Term Rental Market Composition (2026): Property & Room Types
Room Type Distribution
Property Type Distribution
Market Composition Insights for Tianguá
- The Tianguá Airbnb market composition is heavily skewed towards Entire Home/Apt listings, which make up 64% of the 25 active rentals. This indicates strong guest preference for privacy and space.
- However, a notable 36% share for Private Rooms suggests opportunities for budget-conscious travelers or hosts renting out spare rooms.
- Looking at the property type distribution in Tianguá, House properties are the most common (64%), reflecting the local real estate landscape.
- Houses represent a significant 64% portion, catering likely to families or larger groups.
- The presence of 12% Hotel/Boutique listings indicates integration with traditional hospitality.
Tianguá Airbnb Room Capacity Analysis (2026): Bedroom Distribution
Distribution of Listings by Number of Bedrooms
Room Capacity Insights for Tianguá
- The dominant room capacity in Tianguá is 1 bedroom listings, making up 20% of the market. This suggests a strong demand for properties suitable for couples or solo travelers.
- Together, 1 bedroom and 3 bedrooms properties represent 40.0% of the active Airbnb listings in Tianguá, indicating a high concentration in these sizes.
- A significant 40.0% of listings offer 3+ bedrooms, catering to larger groups and families seeking more space in Tianguá.
Tianguá Vacation Rental Guest Capacity Trends (2026)
Distribution of Listings by Guest Capacity
Guest Capacity Insights for Tianguá
- The most common guest capacity trend in Tianguá vacation rentals is listings accommodating 8+ guests (24%). This suggests the primary traveler segment is likely larger groups.
- Properties designed for 8+ guests and 4 guests dominate the Tianguá STR market, accounting for 44.0% of listings.
- 32.0% of properties accommodate 6+ guests, serving the market segment for larger families or group travel in Tianguá.
- On average, properties in Tianguá are equipped to host 3.9 guests.
Tianguá Airbnb Booking Patterns (2026): Available vs. Booked Days
Available Days Distribution
Booked Days Distribution
Booking Pattern Insights for Tianguá
- The most common availability pattern in Tianguá falls within the 271-366 days range, representing 84% of listings. This suggests many properties have significant open periods on their calendars.
- Approximately 100.0% of listings show high availability (181+ days open annually), indicating potential for increased bookings or specific owner usage patterns.
- For booked days, the 1-30 days range is most frequent in Tianguá (44%), reflecting common guest stay durations or potential owner blocking patterns.
Tianguá Airbnb Minimum Stay Requirements Analysis
Distribution of Listings by Minimum Night Requirement
1 Night
12 listings
48% of total
2 Nights
10 listings
40% of total
30+ Nights
3 listings
12% of total
Key Insights
- The most prevalent minimum stay requirement in Tianguá is 1 Night, adopted by 48% of listings. This highlights the market's preference for shorter, flexible bookings.
- A strong majority (88.0%) of the Tianguá Airbnb data shows acceptance of very short stays (1-2 nights), indicating a dynamic, high-turnover market.
- A significant segment (12%) caters to monthly stays (30+ nights) in Tianguá, pointing to opportunities in the extended-stay market.
Recommendations
- Align with the market by considering a 1 Night minimum stay, as 48% of Tianguá hosts use this setting.
- Explore offering discounts for stays of 30+ nights to attract the 12% of the market seeking extended stays.
- Adjust minimum nights based on seasonality – potentially shorter during low season and longer during peak demand periods in Tianguá.
Tianguá Airbnb Cancellation Policy Trends Analysis (2026)
Limited
3 listings
12% of total
Flexible
16 listings
64% of total
Moderate
1 listings
4% of total
Firm
4 listings
16% of total
Strict
1 listings
4% of total
Cancellation Policy Insights for Tianguá
- The prevailing Airbnb cancellation policy trend in Tianguá is Flexible, used by 64% of listings.
- There's a relatively balanced mix between guest-friendly (68.0%) and stricter (20.0%) policies, offering choices for different guest needs.
- Strict cancellation policies are quite rare (4%), potentially making listings with this policy less competitive unless justified by high demand or property type.
Recommendations for Hosts
- Consider adopting a Flexible policy to align with the 64% market standard in Tianguá.
- Given the high prevalence of Flexible policies (64%), offering this can enhance booking appeal, especially during shoulder seasons.
- Using a Strict policy might deter some guests, as only 4% of listings use it. Evaluate if potential revenue protection outweighs possible lower booking rates.
- Regularly review your cancellation policy against competitors and market demand shifts in Tianguá.
Tianguá STR Booking Lead Time Analysis (2026)
Average Booking Lead Time by Month
Booking Lead Time Insights for Tianguá
- The overall average booking lead time for vacation rentals in Tianguá is 31 days.
- Guests book furthest in advance for stays during November (average 70 days), likely coinciding with peak travel demand or local events.
- The shortest booking windows occur for stays in February (average 18 days), indicating more last-minute travel plans during this time.
- Seasonally, Fall (64 days avg.) sees the longest lead times, while Winter (26 days avg.) has the shortest, reflecting typical travel planning cycles.
Recommendations for Hosts
- Use the overall average lead time (31 days) as a baseline for your pricing and availability strategy in Tianguá.
- For November stays, consider implementing length-of-stay discounts or slightly higher rates for bookings made less than 70 days out to capitalize on advance planning.
- Target marketing efforts for the Fall season well in advance (at least 64 days) to capture early planners.
- Monitor your own booking lead times against these Tianguá averages to identify opportunities for dynamic pricing adjustments.
Popular & Essential Airbnb Amenities in Tianguá (2026)
Amenity Prevalence
Amenity Insights for Tianguá
- Essential amenities in Tianguá that guests expect include: Wifi. Lacking these (this) could significantly impact bookings.
- Popular amenities like Kitchen, Free parking on premises, Bed linens are common but not universal. Offering these can provide a competitive edge.
Recommendations for Hosts
- Ensure your listing includes all essential amenities for Tianguá: Wifi.
- Consider adding popular differentiators like Kitchen or Free parking on premises to increase appeal.
- Highlight unique or less common amenities you offer (e.g., hot tub, dedicated workspace, EV charger) in your listing description and photos.
- Regularly check competitor amenities in Tianguá to stay competitive.
Tianguá Airbnb Guest Demographics & Profile Analysis (2026)
Guest Profile Summary for Tianguá
- The typical guest profile for Airbnb in Tianguá consists of primarily domestic travelers (94%), often arriving from nearby Teresina, typically belonging to the Post-2000s (Gen Z/Alpha) group (50%), primarily speaking Portuguese or English.
- Domestic travelers account for 93.9% of guests.
- Key international markets include Brazil (93.9%) and Switzerland (3%).
- Top languages spoken are Portuguese (53.3%) followed by English (26.7%).
- A significant demographic segment is the Post-2000s (Gen Z/Alpha) group, representing 50% of guests.
Recommendations for Hosts
- Target domestic marketing efforts towards travelers from Teresina and Fortaleza.
- Tailor amenities and listing descriptions to appeal to the dominant Post-2000s (Gen Z/Alpha) demographic (e.g., highlight fast WiFi, smart home features, local guides).
- Highlight unique local experiences or amenities relevant to the primary guest profile.
- Consider seasonal promotions aligned with peak travel times for key origin markets.
Nearby Short-Term Rental Market Comparison
How does the Tianguá Airbnb market stack up against its neighbors? Compare key performance metrics like average monthly revenue, ADR, and occupancy rates in surrounding areas to understand the broader regional STR landscape.
| Market | Active Properties | Monthly Revenue | Daily Rate | Avg. Occupancy |
|---|---|---|---|---|
| Trairi | 251 | $790 | $148.54 | 24% |
| Itarema | 45 | $778 | $156.60 | 24% |
| Amontada | 203 | $776 | $130.94 | 25% |
| Jijoca de Jericoacoara | 452 | $771 | $100.13 | 31% |
| Cruz | 215 | $764 | $138.05 | 26% |
| Acaraú | 32 | $573 | $180.41 | 23% |
| Jericoacoara | 30 | $557 | $81.94 | 30% |
| Cajueiro da Praia | 203 | $532 | $125.26 | 21% |
| Camocim | 120 | $420 | $111.65 | 20% |
| Itapipoca | 31 | $413 | $98.67 | 19% |