Salvador Airbnb Market Analysis 2026: Short Term Rental Data & Vacation Rental Statistics in Bahia, Brazil
Is Airbnb profitable in Salvador in 2026? Explore comprehensive Airbnb analytics for Salvador, Bahia, Brazil to uncover income potential. This 2026 STR market report for Salvador, based on AirROI data from February 2025 to January 2026, reveals key trends in the bustling market of 6,167 active listings.
Whether you're considering an Airbnb investment in Salvador, optimizing your existing vacation rental, or exploring rental arbitrage opportunities, understanding the Salvador Airbnb data is crucial. Leveraging the low regulation environment is key to maximizing your short term rental income potential. Let's dive into the specifics.
Key Salvador Airbnb Performance Metrics Overview
Monthly Airbnb Revenue Variations & Income Potential in Salvador (2026)
Understanding the monthly revenue variations for Airbnb listings in Salvador is key to maximizing your short term rental income potential. Seasonality significantly impacts earnings. Our analysis, based on data from the past 12 months, shows that the peak revenue month for STRs in Salvador is typically February, while May often presents the lowest earnings, highlighting opportunities for strategic pricing adjustments during shoulder and low seasons. Explore the typical Airbnb income in Salvador across different performance tiers:
- Best-in-class properties (Top 10%) achieve $1,643+ monthly, often utilizing dynamic pricing and superior guest experiences.
- Strong performing properties (Top 25%) earn $1,012 or more, indicating effective management and desirable locations/amenities.
- Typical properties (Median) generate around $541 per month, representing the average market performance.
- Entry-level properties (Bottom 25%) see earnings around $234, often with potential for optimization.
Average Monthly Airbnb Earnings Trend in Salvador
Salvador Airbnb Occupancy Rate Trends (2026)
Maximize your bookings by understanding the Salvador STR occupancy trends. Seasonal demand shifts significantly influence how often properties are booked. Typically, Februarysees the highest demand (peak season occupancy), while June experiences the lowest (low season). Effective strategies, like adjusting minimum stays or offering promotions, can boost occupancy during slower periods. Here's how different property tiers perform in Salvador:
- Best-in-class properties (Top 10%) achieve 82%+ occupancy, indicating high desirability and potentially optimized availability.
- Strong performing properties (Top 25%) maintain 63% or higher occupancy, suggesting good market fit and guest satisfaction.
- Typical properties (Median) have an occupancy rate around 37%.
- Entry-level properties (Bottom 25%) average 16% occupancy, potentially facing higher vacancy.
Average Monthly Occupancy Rate Trend in Salvador
Average Daily Rate (ADR) Airbnb Trends in Salvador (2026)
Effective short term rental pricing strategy in Salvador involves understanding monthly ADR fluctuations. The Average Daily Rate (ADR) for Airbnb in Salvador typically peaks in February and dips lowest during April. Leveraging Airbnb dynamic pricing tools or strategies based on this seasonality can significantly boost revenue. Here's a look at the typical nightly rates achieved:
- Best-in-class properties (Top 10%) command rates of $118+ per night, often due to premium features or locations.
- Strong performing properties (Top 25%) achieve nightly rates of $73 or more.
- Typical properties (Median) charge around $49 per night.
- Entry-level properties (Bottom 25%) earn around $33 per night.
Average Daily Rate (ADR) Trend by Month in Salvador
Get Live Salvador Market Intelligence 👇

Explore Real-time Analytics
Airbnb Seasonality Analysis & Trends in Salvador (2026)
Peak Season (February, March, January)
- Revenue averages $1,058 per month
- Occupancy rates average 45.3%
- Daily rates average $78
Shoulder Season
- Revenue averages $727 per month
- Occupancy maintains around 40.9%
- Daily rates hold near $69
Low Season (April, May, June)
- Revenue drops to average $556 per month
- Occupancy decreases to average 35.6%
- Daily rates adjust to average $63
Seasonality Insights for Salvador
- The Airbnb seasonality in Salvador shows highly seasonal trends requiring careful strategy. While the sections above show seasonal averages, it's also insightful to look at the extremes:
- During the high season, the absolute peak month showcases Salvador's highest earning potential, with monthly revenues capable of climbing to $1,147, occupancy reaching a high of 48.9%, and ADRs peaking at $80.
- Conversely, the slowest single month of the year, typically falling within the low season, marks the market's lowest point. In this month, revenue might dip to $532, occupancy could drop to 33.5%, and ADRs may adjust down to $62.
- Understanding both the seasonal averages and these monthly peaks and troughs in revenue, occupancy, and ADR is crucial for maximizing your Airbnb profit potential in Salvador.
Seasonal Strategies for Maximizing Profit
- Peak Season: Maximize revenue through premium pricing and potentially longer minimum stays. Ensure high availability.
- Low Season: Offer competitive pricing, special promotions (e.g., extended stay discounts), and flexible cancellation policies. Target off-season travelers like remote workers or budget-conscious guests.
- Shoulder Seasons: Implement dynamic pricing that balances peak and low rates. Target weekend travelers or specific events. Offer slightly more flexible terms than peak season.
- Regularly analyze your own performance against these Salvador seasonality benchmarks and adjust your pricing and availability strategy accordingly.
Best Areas for Airbnb Investment in Salvador (2026)
Exploring the top neighborhoods for short-term rentals in Salvador? This section highlights key areas, outlining why they are attractive for hosts and guests, along with notable local attractions. Consider these locations based on your target guest profile and investment strategy.
| Neighborhood / Area | Why Host Here? (Target Guests & Appeal) | Key Attractions & Landmarks |
|---|---|---|
| Pelourinho | Historic center of Salvador, known for its colonial architecture, vibrant culture, and historical significance. Attracts tourists looking for a cultural experience and proximity to local events and festivals. | São Francisco Church, Pelourinho Square, Museum of Brazilian Music, Carlos Gomes Theatre, Salvador Carnival |
| Barra | Popular neighborhood with beautiful beaches and a lively atmosphere. Known for its coastline and nightlife, appealing to both tourists and locals seeking leisure and entertainment. | Barra Lighthouse, Farol da Barra Beach, Cultural Center of Bahia, Shopping Barra, Praia do Farol da Barra |
| Rio Vermelho | A bohemian neighborhood known for its dining, nightlife, and cultural scene. Popular with younger travelers and locals looking for a vibrant and laid-back atmosphere. | Rio Vermelho Beach, Dona Benta Restaurant, Casa de Jorge Amado, Dona Maria Pelegrini Market, Religious festivals |
| Itapema | A coastal neighborhood known for its beautiful beaches and calm waters, perfect for families and beach lovers. It's a great spot for vacation rentals and summer rentals. | Itapema Beach, Sunset at Ponta do Corumbau, Nearby water sports, Local restaurants, Beach bars |
| Alameda das Praias | A popular area for tourists looking for beach access and a more residential feel. Features a mix of local culture and tourist amenities, making it attractive for vacation rental investments. | Various local beaches, Restaurants and bars, Cultural events nearby, Shopping options, Family-friendly activities |
| Centro | The central area of Salvador with a mix of modern and old attractions. Easy access to transportation and services, appealing to business travelers and tourists alike. | Elevador Lacerda, Mercado Modelo, Bahia Museum of Art, Local theaters, Shopping and dining options |
| Jardim de Alá | Lively neighborhood with a mixture of residential and vacation properties. Known for its parks and recreational areas, attracting families and young professionals. | Jardim de Alá Beach, Parque Metropolitano de Pituacu, Shopping centers, Nightlife, Cultural events |
| São Lázaro | A quieter residential area offering a local experience while still close to the vibrant nightlife and tourist attractions of Salvador. Appeals to those looking for a more authentic stay. | Parks and quiet streets, Local markets, Cultural festivals, Art exhibitions, Nearby beaches |
Understanding Airbnb License Requirements & STR Laws in Salvador (2026)
While Salvador, Bahia, Brazil currently shows low STR regulations, specific Airbnb license requirements might still exist or change. Always verify the latest short term rental regulations and Airbnb license requirements directly with local government authorities for Salvador to ensure full compliance before hosting.
(Source: AirROI data, 2026, based on 0% licensed listings)
Top Performing Airbnb Properties in Salvador (2026)
Benchmark your potential! Explore examples of top-performing Airbnb properties in Salvadorbased on Trailing Twelve Month (TTM) revenue. Analyze their characteristics, revenue, occupancy rate, and ADR to understand what drives success in this market.

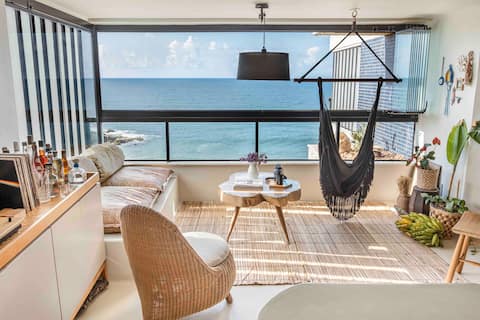
FAROL VIEW PENTHOUSE BARRA W POOL
Entire Place • 4 bedrooms

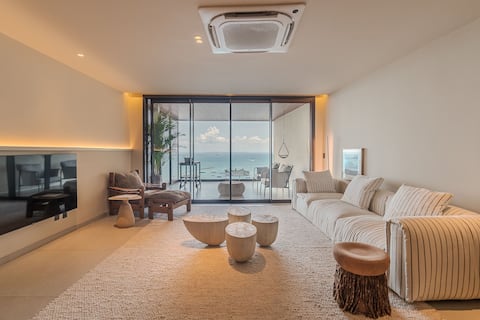
Luxury in front of Farol da Barra - COBAR0108
Entire Place • 3 bedrooms
Terrace on the sand
Entire Place • 2 bedrooms
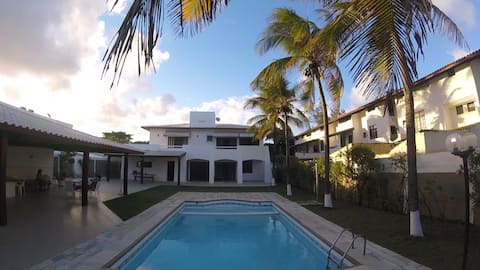
Mansion of the Sun Flamengo Beach in Salvador BAHIA
Entire Place • 6 bedrooms
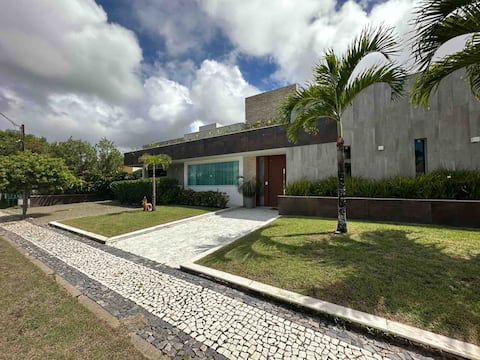
Summer Relax House - Beach Pool Jacuzzi Barbecue
Entire Place • 5 bedrooms
Gorges Residence -2 Suites- The sea in the palm of your hand
Entire Place • 2 bedrooms
Note: Performance varies based on location, size, amenities, seasonality, and management quality. Data reflects the past 12 months.
Top Performing Airbnb Hosts in Salvador (2026)
Learn from the best! This table showcases top-performing Airbnb hosts in Salvador based on the number of properties managed and estimated total revenue over the past year. Analyze their scale and performance metrics.
| Host Name | Properties | Grossing Revenue | Stay Reviews | Avg Rating |
|---|---|---|---|---|
| Mariana | 73 | $830,174 | 2263 | 4.88/5.0 |
| Beehost | 88 | $740,600 | 1308 | 4.69/5.0 |
| Vanessa VLV Stays | 57 | $460,857 | 1174 | 4.89/5.0 |
| BemVindo Imoveis Por Temporada | 112 | $421,383 | 1998 | 4.62/5.0 |
| Eliane - Na Praia Hospeda | 22 | $353,795 | 533 | 4.93/5.0 |
| Bruno Fernandes | 27 | $325,401 | 1020 | 4.90/5.0 |
| Monique | 38 | $261,426 | 1327 | 4.84/5.0 |
| Unu | 18 | $255,227 | 654 | 4.61/5.0 |
| Daniel | 9 | $239,946 | 590 | 4.92/5.0 |
| Alberto | 16 | $226,843 | 297 | 4.90/5.0 |
Analyzing the strategies of top hosts, such as their property selection, pricing, and guest communication, can offer valuable lessons for optimizing your own Airbnb operations in Salvador.
Dive Deeper: Advanced Salvador STR Market Data (2026)
Ready to unlock more insights? AirROI provides access to advanced metrics and comprehensive Airbnb data for Salvador. Explore detailed analytics beyond this report to refine your investment strategy, optimize pricing, and maximize your vacation rental profits.
Explore Advanced MetricsSalvador Short-Term Rental Market Composition (2026): Property & Room Types
Room Type Distribution
Property Type Distribution
Market Composition Insights for Salvador
- The Salvador Airbnb market composition is heavily skewed towards Entire Home/Apt listings, which make up 85.1% of the 6,167 active rentals. This indicates strong guest preference for privacy and space.
- Looking at the property type distribution in Salvador, Apartment/Condo properties are the most common (86.8%), reflecting the local real estate landscape.
- Smaller segments like hotel/boutique, others (combined 2.4%) offer potential for unique stay experiences.
Salvador Airbnb Room Capacity Analysis (2026): Bedroom Distribution
Distribution of Listings by Number of Bedrooms
Room Capacity Insights for Salvador
- The dominant room capacity in Salvador is 1 bedroom listings, making up 54.2% of the market. This suggests a strong demand for properties suitable for couples or solo travelers.
- Together, 1 bedroom and 2 bedrooms properties represent 73.2% of the active Airbnb listings in Salvador, indicating a high concentration in these sizes.
- With over half the market (54.2%) consisting of studios or 1-bedroom units, Salvador is particularly well-suited for individuals or couples.
Salvador Vacation Rental Guest Capacity Trends (2026)
Distribution of Listings by Guest Capacity
Guest Capacity Insights for Salvador
- The most common guest capacity trend in Salvador vacation rentals is listings accommodating 4 guests (30.1%). This suggests the primary traveler segment is likely small families or groups.
- Properties designed for 4 guests and 2 guests dominate the Salvador STR market, accounting for 50.5% of listings.
- 17.4% of properties accommodate 6+ guests, serving the market segment for larger families or group travel in Salvador.
- On average, properties in Salvador are equipped to host 3.5 guests.
Salvador Airbnb Booking Patterns (2026): Available vs. Booked Days
Available Days Distribution
Booked Days Distribution
Booking Pattern Insights for Salvador
- The most common availability pattern in Salvador falls within the 271-366 days range, representing 58.9% of listings. This suggests many properties have significant open periods on their calendars.
- Approximately 82.7% of listings show high availability (181+ days open annually), indicating potential for increased bookings or specific owner usage patterns.
- For booked days, the 31-90 days range is most frequent in Salvador (29.8%), reflecting common guest stay durations or potential owner blocking patterns.
- A notable 18.2% of properties secure long booking periods (181+ days booked per year), highlighting successful long-term rental strategies or significant owner usage.
Salvador Airbnb Minimum Stay Requirements Analysis
Distribution of Listings by Minimum Night Requirement
1 Night
1115 listings
18.1% of total
2 Nights
1767 listings
28.7% of total
3 Nights
717 listings
11.6% of total
4-6 Nights
539 listings
8.7% of total
7-29 Nights
118 listings
1.9% of total
30+ Nights
1910 listings
31% of total
Key Insights
- The most prevalent minimum stay requirement in Salvador is 30+ Nights, adopted by 31% of listings. This highlights the market's preference for longer commitments.
- A significant segment (31%) caters to monthly stays (30+ nights) in Salvador, pointing to opportunities in the extended-stay market.
Recommendations
- Align with the market by considering a 30+ Nights minimum stay, as 31% of Salvador hosts use this setting.
- If feasible, allowing 1-night stays, especially midweek or during low season, could capture last-minute bookings, as only 18.1% currently do.
- Explore offering discounts for stays of 30+ nights to attract the 31% of the market seeking extended stays.
- Adjust minimum nights based on seasonality – potentially shorter during low season and longer during peak demand periods in Salvador.
Salvador Airbnb Cancellation Policy Trends Analysis (2026)
Super Strict 60 Days
92 listings
1.5% of total
Refundable
4 listings
0.1% of total
Limited
73 listings
1.2% of total
Non-refundable
3 listings
0% of total
Super Strict 30 Days
35 listings
0.6% of total
Flexible
1324 listings
21.5% of total
Moderate
1605 listings
26.1% of total
Firm
2097 listings
34.1% of total
Strict
911 listings
14.8% of total
Cancellation Policy Insights for Salvador
- The prevailing Airbnb cancellation policy trend in Salvador is Firm, used by 34.1% of listings.
- There's a relatively balanced mix between guest-friendly (47.6%) and stricter (48.9%) policies, offering choices for different guest needs.
Recommendations for Hosts
- Consider adopting a Firm policy to align with the 34.1% market standard in Salvador.
- Using a Strict policy might deter some guests, as only 14.8% of listings use it. Evaluate if potential revenue protection outweighs possible lower booking rates.
- Regularly review your cancellation policy against competitors and market demand shifts in Salvador.
Salvador STR Booking Lead Time Analysis (2026)
Average Booking Lead Time by Month
Booking Lead Time Insights for Salvador
- The overall average booking lead time for vacation rentals in Salvador is 36 days.
- Guests book furthest in advance for stays during February (average 53 days), likely coinciding with peak travel demand or local events.
- The shortest booking windows occur for stays in May (average 16 days), indicating more last-minute travel plans during this time.
- Seasonally, Winter (45 days avg.) sees the longest lead times, while Summer (23 days avg.) has the shortest, reflecting typical travel planning cycles.
Recommendations for Hosts
- Use the overall average lead time (36 days) as a baseline for your pricing and availability strategy in Salvador.
- For February stays, consider implementing length-of-stay discounts or slightly higher rates for bookings made less than 53 days out to capitalize on advance planning.
- Target marketing efforts for the Winter season well in advance (at least 45 days) to capture early planners.
- Monitor your own booking lead times against these Salvador averages to identify opportunities for dynamic pricing adjustments.
Popular & Essential Airbnb Amenities in Salvador (2026)
Amenity Prevalence
Amenity Insights for Salvador
- Essential amenities in Salvador that guests expect include: Wifi. Lacking these (this) could significantly impact bookings.
- Popular amenities like Kitchen, TV, Air conditioning are common but not universal. Offering these can provide a competitive edge.
Recommendations for Hosts
- Ensure your listing includes all essential amenities for Salvador: Wifi.
- Prioritize adding missing essentials: Wifi.
- Consider adding popular differentiators like Kitchen or TV to increase appeal.
- Highlight unique or less common amenities you offer (e.g., hot tub, dedicated workspace, EV charger) in your listing description and photos.
- Regularly check competitor amenities in Salvador to stay competitive.
Salvador Airbnb Guest Demographics & Profile Analysis (2026)
Guest Profile Summary for Salvador
- The typical guest profile for Airbnb in Salvador consists of primarily domestic travelers (74%), often arriving from nearby São Paulo, typically belonging to the Post-2000s (Gen Z/Alpha) group (50%), primarily speaking Portuguese or English.
- Domestic travelers account for 74.4% of guests.
- Key international markets include Brazil (74.4%) and United States (5.8%).
- Top languages spoken are Portuguese (34.5%) followed by English (31.1%).
- A significant demographic segment is the Post-2000s (Gen Z/Alpha) group, representing 50% of guests.
Recommendations for Hosts
- Target domestic marketing efforts towards travelers from São Paulo and Rio de Janeiro.
- Tailor amenities and listing descriptions to appeal to the dominant Post-2000s (Gen Z/Alpha) demographic (e.g., highlight fast WiFi, smart home features, local guides).
- Highlight unique local experiences or amenities relevant to the primary guest profile.
- Consider seasonal promotions aligned with peak travel times for key origin markets.
Nearby Short-Term Rental Market Comparison
How does the Salvador Airbnb market stack up against its neighbors? Compare key performance metrics like average monthly revenue, ADR, and occupancy rates in surrounding areas to understand the broader regional STR landscape.
| Market | Active Properties | Monthly Revenue | Daily Rate | Avg. Occupancy |
|---|---|---|---|---|
| Mata de São João | 1,442 | $1,069 | $197.43 | 26% |
| Camaçari | 1,987 | $810 | $173.01 | 24% |
| São Gonçalo dos Campos | 12 | $670 | $188.97 | 19% |
| Cairu | 922 | $635 | $98.69 | 32% |
| Lauro de Freitas | 315 | $577 | $96.23 | 30% |
| Maraú | 954 | $527 | $139.88 | 23% |
| Esplanada | 19 | $418 | $108.22 | 22% |
| Entre Rios | 145 | $416 | $115.77 | 21% |
| Vera Cruz | 242 | $362 | $116.09 | 20% |
| Estância | 99 | $361 | $111.66 | 21% |