Palmeiras Airbnb Market Analysis 2026: Short Term Rental Data & Vacation Rental Statistics in Bahia, Brazil
Is Airbnb profitable in Palmeiras in 2026? Explore comprehensive Airbnb analytics for Palmeiras, Bahia, Brazil to uncover income potential. This 2026 STR market report for Palmeiras, based on AirROI data from February 2025 to January 2026, reveals key trends in the market of 372 active listings.
Whether you're considering an Airbnb investment in Palmeiras, optimizing your existing vacation rental, or exploring rental arbitrage opportunities, understanding the Palmeiras Airbnb data is crucial. Leveraging the low regulation environment is key to maximizing your short term rental income potential. Let's dive into the specifics.
Key Palmeiras Airbnb Performance Metrics Overview
Monthly Airbnb Revenue Variations & Income Potential in Palmeiras (2026)
Understanding the monthly revenue variations for Airbnb listings in Palmeiras is key to maximizing your short term rental income potential. Seasonality significantly impacts earnings. Our analysis, based on data from the past 12 months, shows that the peak revenue month for STRs in Palmeiras is typically March, while September often presents the lowest earnings, highlighting opportunities for strategic pricing adjustments during shoulder and low seasons. Explore the typical Airbnb income in Palmeiras across different performance tiers:
- Best-in-class properties (Top 10%) achieve $1,306+ monthly, often utilizing dynamic pricing and superior guest experiences.
- Strong performing properties (Top 25%) earn $688 or more, indicating effective management and desirable locations/amenities.
- Typical properties (Median) generate around $302 per month, representing the average market performance.
- Entry-level properties (Bottom 25%) see earnings around $128, often with potential for optimization.
Average Monthly Airbnb Earnings Trend in Palmeiras
Palmeiras Airbnb Occupancy Rate Trends (2026)
Maximize your bookings by understanding the Palmeiras STR occupancy trends. Seasonal demand shifts significantly influence how often properties are booked. Typically, Julysees the highest demand (peak season occupancy), while December experiences the lowest (low season). Effective strategies, like adjusting minimum stays or offering promotions, can boost occupancy during slower periods. Here's how different property tiers perform in Palmeiras:
- Best-in-class properties (Top 10%) achieve 62%+ occupancy, indicating high desirability and potentially optimized availability.
- Strong performing properties (Top 25%) maintain 40% or higher occupancy, suggesting good market fit and guest satisfaction.
- Typical properties (Median) have an occupancy rate around 20%.
- Entry-level properties (Bottom 25%) average 10% occupancy, potentially facing higher vacancy.
Average Monthly Occupancy Rate Trend in Palmeiras
Average Daily Rate (ADR) Airbnb Trends in Palmeiras (2026)
Effective short term rental pricing strategy in Palmeiras involves understanding monthly ADR fluctuations. The Average Daily Rate (ADR) for Airbnb in Palmeiras typically peaks in December and dips lowest during April. Leveraging Airbnb dynamic pricing tools or strategies based on this seasonality can significantly boost revenue. Here's a look at the typical nightly rates achieved:
- Best-in-class properties (Top 10%) command rates of $105+ per night, often due to premium features or locations.
- Strong performing properties (Top 25%) achieve nightly rates of $64 or more.
- Typical properties (Median) charge around $41 per night.
- Entry-level properties (Bottom 25%) earn around $28 per night.
Average Daily Rate (ADR) Trend by Month in Palmeiras
Get Live Palmeiras Market Intelligence 👇

Explore Real-time Analytics
Airbnb Seasonality Analysis & Trends in Palmeiras (2026)
Peak Season (March, July, June)
- Revenue averages $590 per month
- Occupancy rates average 30.8%
- Daily rates average $54
Shoulder Season
- Revenue averages $521 per month
- Occupancy maintains around 26.5%
- Daily rates hold near $56
Low Season (February, August, September)
- Revenue drops to average $470 per month
- Occupancy decreases to average 26.8%
- Daily rates adjust to average $53
Seasonality Insights for Palmeiras
- The Airbnb seasonality in Palmeiras shows relatively stable year-round demand. While the sections above show seasonal averages, it's also insightful to look at the extremes:
- During the high season, the absolute peak month showcases Palmeiras's highest earning potential, with monthly revenues capable of climbing to $604, occupancy reaching a high of 32.9%, and ADRs peaking at $60.
- Conversely, the slowest single month of the year, typically falling within the low season, marks the market's lowest point. In this month, revenue might dip to $459, occupancy could drop to 23.5%, and ADRs may adjust down to $51.
- Understanding both the seasonal averages and these monthly peaks and troughs in revenue, occupancy, and ADR is crucial for maximizing your Airbnb profit potential in Palmeiras.
Seasonal Strategies for Maximizing Profit
- Peak Season: Maximize revenue through premium pricing and potentially longer minimum stays. Ensure high availability.
- Low Season: Offer competitive pricing, special promotions (e.g., extended stay discounts), and flexible cancellation policies. Target off-season travelers like remote workers or budget-conscious guests.
- Shoulder Seasons: Implement dynamic pricing that balances peak and low rates. Target weekend travelers or specific events. Offer slightly more flexible terms than peak season.
- Regularly analyze your own performance against these Palmeiras seasonality benchmarks and adjust your pricing and availability strategy accordingly.
Best Areas for Airbnb Investment in Palmeiras (2026)
Exploring the top neighborhoods for short-term rentals in Palmeiras? This section highlights key areas, outlining why they are attractive for hosts and guests, along with notable local attractions. Consider these locations based on your target guest profile and investment strategy.
| Neighborhood / Area | Why Host Here? (Target Guests & Appeal) | Key Attractions & Landmarks |
|---|---|---|
| Praia do Forte | A picturesque beach village known for its stunning coastline and vibrant culture. Ideal for tourists seeking relaxation along beautiful beaches and access to charming local shops and restaurants. | Garcia D'Ávila Castle, Tamar Project, Praia do Forte Beach, Kiosk of the Indian, Project Tamar |
| Imbassai | A tranquil beach location ideal for families and nature lovers. It offers a beautiful natural environment with river and beach access, making it perfect for those looking for a peaceful getaway. | Imbassai River, Imbassai Beach, Nature trails, Restaurants and local cuisine, Cultural festivals |
| Guarajuba | Popular beach destination with wide sandy shores and clear waters, attracting tourists for its family-friendly atmosphere. It offers a variety of water sports and leisure activities. | Guarajuba Beach, Local markets, Beach bars and restaurants, Sunset views, Water sports |
| Costa do Sauipe | Known for its luxury resorts and stunning beaches, Costa do Sauipe attracts travelers looking for premium hospitality and relaxation, making it a great area for high-end Airbnb experiences. | Costa do Sauipe Beach, Golf courses, Resort amenities, Small fishing village charm, Water activities |
| Camaçari | A growing area with access to beautiful coastal regions and local attractions. Camaçari offers a balance of urban and natural environments, appealing to both tourists and locals. | Lagoa do Mangue, Local history museums, Nearby beaches, Cultural exhibits, Shopping options |
| Boca do Rio | An up-and-coming area in Salvador near Palmeiras, known for its proximity to the beach and developing infrastructure. This area attracts younger travelers and beach enthusiasts. | Boca do Rio Beach, Restaurants and nightlife, Scenic coastal views, Water sports, Local festivals |
| Baía de Todos os Santos | One of the largest tropical bays in the world, offering beautiful island getaways and cultural experiences. It is popular among those looking for adventure and exploration on the water. | Cultural islands, Boat tours, Beaches, Historical sites, Local cuisine |
| Serra do Mouros | A more rural and scenic area, ideal for those who appreciate nature and adventure. Investing here offers a chance to attract eco-tourism and nature retreats. | Hiking trails, Wildlife spotting, Natural beauty, Waterfalls, Cultural heritage sites |
Understanding Airbnb License Requirements & STR Laws in Palmeiras (2026)
While Palmeiras, Bahia, Brazil currently shows low STR regulations, specific Airbnb license requirements might still exist or change. Always verify the latest short term rental regulations and Airbnb license requirements directly with local government authorities for Palmeiras to ensure full compliance before hosting.
(Source: AirROI data, 2026, based on 1% licensed listings)
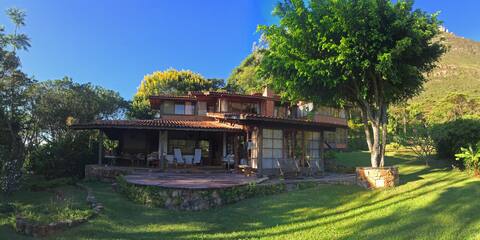
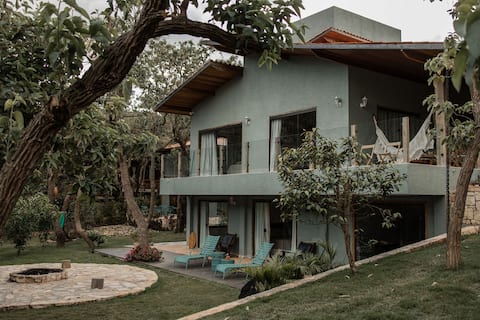
Top Performing Airbnb Properties in Palmeiras (2026)
Benchmark your potential! Explore examples of top-performing Airbnb properties in Palmeirasbased on Trailing Twelve Month (TTM) revenue. Analyze their characteristics, revenue, occupancy rate, and ADR to understand what drives success in this market.

Luxurious home, amazing view and heated pool
Entire Place • 3 bedrooms
Casa Linda - Comfort, charm - Vale do Capão, BA
Entire Place • 4 bedrooms
Vale do Capão Valley House
Entire Place • 5 bedrooms
View of Morro Branco and easy access to the village.
Entire Place • 3 bedrooms

Casa com Jacuzzi e Rede Suspensa no Céu do Capão
Entire Place • 4 bedrooms
Stunning Annex close to waterfalls, Vale do Capão
Entire Place • 2 bedrooms
Note: Performance varies based on location, size, amenities, seasonality, and management quality. Data reflects the past 12 months.
Top Performing Airbnb Hosts in Palmeiras (2026)
Learn from the best! This table showcases top-performing Airbnb hosts in Palmeiras based on the number of properties managed and estimated total revenue over the past year. Analyze their scale and performance metrics.
| Host Name | Properties | Grossing Revenue | Stay Reviews | Avg Rating |
|---|---|---|---|---|
| Paul | 4 | $47,908 | 136 | 4.93/5.0 |
| Pedro | 7 | $45,646 | 322 | 4.97/5.0 |
| Robério | 4 | $39,971 | 31 | 5.00/5.0 |
| Fábio | 1 | $34,424 | 20 | 4.95/5.0 |
| Eder | 2 | $34,279 | 192 | 5.00/5.0 |
| Carlos Eduardo | 3 | $33,478 | 169 | 4.95/5.0 |
| Claudio César Figueiredo | 1 | $33,031 | 50 | 4.94/5.0 |
| Antonio Moreno | 4 | $32,509 | 54 | 4.96/5.0 |
| Neuze Andrea Santos Leal | 1 | $27,975 | 3 | 5.00/5.0 |
| Gustavo | 4 | $25,910 | 82 | 4.96/5.0 |
Analyzing the strategies of top hosts, such as their property selection, pricing, and guest communication, can offer valuable lessons for optimizing your own Airbnb operations in Palmeiras.
Dive Deeper: Advanced Palmeiras STR Market Data (2026)
Ready to unlock more insights? AirROI provides access to advanced metrics and comprehensive Airbnb data for Palmeiras. Explore detailed analytics beyond this report to refine your investment strategy, optimize pricing, and maximize your vacation rental profits.
Explore Advanced MetricsPalmeiras Short-Term Rental Market Composition (2026): Property & Room Types
Room Type Distribution
Property Type Distribution
Market Composition Insights for Palmeiras
- The Palmeiras Airbnb market composition is heavily skewed towards Entire Home/Apt listings, which make up 77.2% of the 372 active rentals. This indicates strong guest preference for privacy and space.
- Looking at the property type distribution in Palmeiras, House properties are the most common (76.6%), reflecting the local real estate landscape.
- Houses represent a significant 76.6% portion, catering likely to families or larger groups.
- The presence of 10.2% Hotel/Boutique listings indicates integration with traditional hospitality.
- Smaller segments like apartment/condo, outdoor/unique (combined 7.8%) offer potential for unique stay experiences.
Palmeiras Airbnb Room Capacity Analysis (2026): Bedroom Distribution
Distribution of Listings by Number of Bedrooms
Room Capacity Insights for Palmeiras
- The dominant room capacity in Palmeiras is 1 bedroom listings, making up 43.5% of the market. This suggests a strong demand for properties suitable for couples or solo travelers.
- Together, 1 bedroom and 2 bedrooms properties represent 66.6% of the active Airbnb listings in Palmeiras, indicating a high concentration in these sizes.
Palmeiras Vacation Rental Guest Capacity Trends (2026)
Distribution of Listings by Guest Capacity
Guest Capacity Insights for Palmeiras
- The most common guest capacity trend in Palmeiras vacation rentals is listings accommodating 2 guests (19.6%). This suggests the primary traveler segment is likely couples or solo travelers.
- Properties designed for 2 guests and 4 guests dominate the Palmeiras STR market, accounting for 36.3% of listings.
- 26.7% of properties accommodate 6+ guests, serving the market segment for larger families or group travel in Palmeiras.
- On average, properties in Palmeiras are equipped to host 3.6 guests.
Palmeiras Airbnb Booking Patterns (2026): Available vs. Booked Days
Available Days Distribution
Booked Days Distribution
Booking Pattern Insights for Palmeiras
- The most common availability pattern in Palmeiras falls within the 271-366 days range, representing 80.1% of listings. This suggests many properties have significant open periods on their calendars.
- Approximately 94.6% of listings show high availability (181+ days open annually), indicating potential for increased bookings or specific owner usage patterns.
- For booked days, the 1-30 days range is most frequent in Palmeiras (50.8%), reflecting common guest stay durations or potential owner blocking patterns.
- A notable 6.4% of properties secure long booking periods (181+ days booked per year), highlighting successful long-term rental strategies or significant owner usage.
Palmeiras Airbnb Minimum Stay Requirements Analysis
Distribution of Listings by Minimum Night Requirement
1 Night
81 listings
21.8% of total
2 Nights
143 listings
38.4% of total
3 Nights
62 listings
16.7% of total
4-6 Nights
9 listings
2.4% of total
30+ Nights
77 listings
20.7% of total
Key Insights
- The most prevalent minimum stay requirement in Palmeiras is 2 Nights, adopted by 38.4% of listings. This highlights the market's preference for shorter, flexible bookings.
- A strong majority (60.2%) of the Palmeiras Airbnb data shows acceptance of very short stays (1-2 nights), indicating a dynamic, high-turnover market.
- A significant segment (20.7%) caters to monthly stays (30+ nights) in Palmeiras, pointing to opportunities in the extended-stay market.
Recommendations
- Align with the market by considering a 2 Nights minimum stay, as 38.4% of Palmeiras hosts use this setting.
- If feasible, allowing 1-night stays, especially midweek or during low season, could capture last-minute bookings, as only 21.8% currently do.
- Explore offering discounts for stays of 30+ nights to attract the 20.7% of the market seeking extended stays.
- Adjust minimum nights based on seasonality – potentially shorter during low season and longer during peak demand periods in Palmeiras.
Palmeiras Airbnb Cancellation Policy Trends Analysis (2026)
Super Strict 30 Days
3 listings
0.8% of total
Limited
7 listings
1.9% of total
Flexible
77 listings
20.8% of total
Moderate
63 listings
17% of total
Firm
169 listings
45.7% of total
Strict
51 listings
13.8% of total
Cancellation Policy Insights for Palmeiras
- The prevailing Airbnb cancellation policy trend in Palmeiras is Firm, used by 45.7% of listings.
- A majority (59.5%) of hosts in Palmeiras utilize Firm or Strict policies, indicating a market where hosts prioritize booking security.
Recommendations for Hosts
- Consider adopting a Firm policy to align with the 45.7% market standard in Palmeiras.
- Using a Strict policy might deter some guests, as only 13.8% of listings use it. Evaluate if potential revenue protection outweighs possible lower booking rates.
- Regularly review your cancellation policy against competitors and market demand shifts in Palmeiras.
Palmeiras STR Booking Lead Time Analysis (2026)
Average Booking Lead Time by Month
Booking Lead Time Insights for Palmeiras
- The overall average booking lead time for vacation rentals in Palmeiras is 28 days.
- Guests book furthest in advance for stays during December (average 43 days), likely coinciding with peak travel demand or local events.
- The shortest booking windows occur for stays in August (average 19 days), indicating more last-minute travel plans during this time.
- Seasonally, Winter (34 days avg.) sees the longest lead times, while Summer (24 days avg.) has the shortest, reflecting typical travel planning cycles.
Recommendations for Hosts
- Use the overall average lead time (28 days) as a baseline for your pricing and availability strategy in Palmeiras.
- For December stays, consider implementing length-of-stay discounts or slightly higher rates for bookings made less than 43 days out to capitalize on advance planning.
- Target marketing efforts for the Winter season well in advance (at least 34 days) to capture early planners.
- Monitor your own booking lead times against these Palmeiras averages to identify opportunities for dynamic pricing adjustments.
Popular & Essential Airbnb Amenities in Palmeiras (2026)
Amenity Prevalence
Amenity Insights for Palmeiras
- Essential amenities in Palmeiras that guests expect include: Wifi. Lacking these (this) could significantly impact bookings.
- Popular amenities like Free parking on premises, Kitchen, Dishes and silverware are common but not universal. Offering these can provide a competitive edge.
Recommendations for Hosts
- Ensure your listing includes all essential amenities for Palmeiras: Wifi.
- Prioritize adding missing essentials: Wifi.
- Consider adding popular differentiators like Free parking on premises or Kitchen to increase appeal.
- Highlight unique or less common amenities you offer (e.g., hot tub, dedicated workspace, EV charger) in your listing description and photos.
- Regularly check competitor amenities in Palmeiras to stay competitive.
Palmeiras Airbnb Guest Demographics & Profile Analysis (2026)
Guest Profile Summary for Palmeiras
- The typical guest profile for Airbnb in Palmeiras consists of primarily domestic travelers (82%), often arriving from nearby Salvador, typically belonging to the Post-2000s (Gen Z/Alpha) group (50%), primarily speaking Portuguese or English.
- Domestic travelers account for 82.1% of guests.
- Key international markets include Brazil (82.1%) and France (4%).
- Top languages spoken are Portuguese (34.6%) followed by English (30.8%).
- A significant demographic segment is the Post-2000s (Gen Z/Alpha) group, representing 50% of guests.
Recommendations for Hosts
- Target domestic marketing efforts towards travelers from Salvador and Bahia.
- Tailor amenities and listing descriptions to appeal to the dominant Post-2000s (Gen Z/Alpha) demographic (e.g., highlight fast WiFi, smart home features, local guides).
- Highlight unique local experiences or amenities relevant to the primary guest profile.
- Consider seasonal promotions aligned with peak travel times for key origin markets.
Nearby Short-Term Rental Market Comparison
How does the Palmeiras Airbnb market stack up against its neighbors? Compare key performance metrics like average monthly revenue, ADR, and occupancy rates in surrounding areas to understand the broader regional STR landscape.
| Market | Active Properties | Monthly Revenue | Daily Rate | Avg. Occupancy |
|---|---|---|---|---|
| Mucugê | 126 | $487 | $105.32 | 24% |
| Iramaia | 10 | $389 | $52.95 | 27% |
| Lençóis | 312 | $364 | $63.14 | 28% |
| Rio de Contas | 11 | $337 | $94.32 | 21% |
| Jacobina | 33 | $294 | $79.84 | 20% |
| Ibicoara | 59 | $260 | $61.93 | 22% |
| Morro do Chapéu | 19 | $254 | $50.41 | 24% |
| Andaraí | 34 | $245 | $72.60 | 18% |
| Jequié | 27 | $161 | $58.01 | 21% |
| Irecê | 10 | $128 | $37.07 | 27% |