Camaçari Airbnb Market Analysis 2026: Short Term Rental Data & Vacation Rental Statistics in Bahia, Brazil
Is Airbnb profitable in Camaçari in 2026? Explore comprehensive Airbnb analytics for Camaçari, Bahia, Brazil to uncover income potential. This 2026 STR market report for Camaçari, based on AirROI data from February 2025 to January 2026, reveals key trends in the bustling market of 1,987 active listings.
Whether you're considering an Airbnb investment in Camaçari, optimizing your existing vacation rental, or exploring rental arbitrage opportunities, understanding the Camaçari Airbnb data is crucial. Leveraging the low regulation environment is key to maximizing your short term rental income potential. Let's dive into the specifics.
Key Camaçari Airbnb Performance Metrics Overview
Monthly Airbnb Revenue Variations & Income Potential in Camaçari (2026)
Understanding the monthly revenue variations for Airbnb listings in Camaçari is key to maximizing your short term rental income potential. Seasonality significantly impacts earnings. Our analysis, based on data from the past 12 months, shows that the peak revenue month for STRs in Camaçari is typically January, while June often presents the lowest earnings, highlighting opportunities for strategic pricing adjustments during shoulder and low seasons. Explore the typical Airbnb income in Camaçari across different performance tiers:
- Best-in-class properties (Top 10%) achieve $3,207+ monthly, often utilizing dynamic pricing and superior guest experiences.
- Strong performing properties (Top 25%) earn $1,697 or more, indicating effective management and desirable locations/amenities.
- Typical properties (Median) generate around $794 per month, representing the average market performance.
- Entry-level properties (Bottom 25%) see earnings around $345, often with potential for optimization.
Average Monthly Airbnb Earnings Trend in Camaçari
Camaçari Airbnb Occupancy Rate Trends (2026)
Maximize your bookings by understanding the Camaçari STR occupancy trends. Seasonal demand shifts significantly influence how often properties are booked. Typically, Marchsees the highest demand (peak season occupancy), while June experiences the lowest (low season). Effective strategies, like adjusting minimum stays or offering promotions, can boost occupancy during slower periods. Here's how different property tiers perform in Camaçari:
- Best-in-class properties (Top 10%) achieve 63%+ occupancy, indicating high desirability and potentially optimized availability.
- Strong performing properties (Top 25%) maintain 39% or higher occupancy, suggesting good market fit and guest satisfaction.
- Typical properties (Median) have an occupancy rate around 20%.
- Entry-level properties (Bottom 25%) average 10% occupancy, potentially facing higher vacancy.
Average Monthly Occupancy Rate Trend in Camaçari
Average Daily Rate (ADR) Airbnb Trends in Camaçari (2026)
Effective short term rental pricing strategy in Camaçari involves understanding monthly ADR fluctuations. The Average Daily Rate (ADR) for Airbnb in Camaçari typically peaks in January and dips lowest during April. Leveraging Airbnb dynamic pricing tools or strategies based on this seasonality can significantly boost revenue. Here's a look at the typical nightly rates achieved:
- Best-in-class properties (Top 10%) command rates of $337+ per night, often due to premium features or locations.
- Strong performing properties (Top 25%) achieve nightly rates of $203 or more.
- Typical properties (Median) charge around $131 per night.
- Entry-level properties (Bottom 25%) earn around $87 per night.
Average Daily Rate (ADR) Trend by Month in Camaçari
Get Live Camaçari Market Intelligence 👇

Explore Real-time Analytics
Airbnb Seasonality Analysis & Trends in Camaçari (2026)
Peak Season (January, December, March)
- Revenue averages $1,886 per month
- Occupancy rates average 31.3%
- Daily rates average $193
Shoulder Season
- Revenue averages $1,350 per month
- Occupancy maintains around 28.1%
- Daily rates hold near $169
Low Season (May, June, August)
- Revenue drops to average $985 per month
- Occupancy decreases to average 21.7%
- Daily rates adjust to average $163
Seasonality Insights for Camaçari
- The Airbnb seasonality in Camaçari shows highly seasonal trends requiring careful strategy. While the sections above show seasonal averages, it's also insightful to look at the extremes:
- During the high season, the absolute peak month showcases Camaçari's highest earning potential, with monthly revenues capable of climbing to $2,020, occupancy reaching a high of 32.4%, and ADRs peaking at $208.
- Conversely, the slowest single month of the year, typically falling within the low season, marks the market's lowest point. In this month, revenue might dip to $934, occupancy could drop to 19.6%, and ADRs may adjust down to $161.
- Understanding both the seasonal averages and these monthly peaks and troughs in revenue, occupancy, and ADR is crucial for maximizing your Airbnb profit potential in Camaçari.
Seasonal Strategies for Maximizing Profit
- Peak Season: Maximize revenue through premium pricing and potentially longer minimum stays. Ensure high availability.
- Low Season: Offer competitive pricing, special promotions (e.g., extended stay discounts), and flexible cancellation policies. Target off-season travelers like remote workers or budget-conscious guests.
- Shoulder Seasons: Implement dynamic pricing that balances peak and low rates. Target weekend travelers or specific events. Offer slightly more flexible terms than peak season.
- Regularly analyze your own performance against these Camaçari seasonality benchmarks and adjust your pricing and availability strategy accordingly.
Best Areas for Airbnb Investment in Camaçari (2026)
Exploring the top neighborhoods for short-term rentals in Camaçari? This section highlights key areas, outlining why they are attractive for hosts and guests, along with notable local attractions. Consider these locations based on your target guest profile and investment strategy.
| Neighborhood / Area | Why Host Here? (Target Guests & Appeal) | Key Attractions & Landmarks |
|---|---|---|
| Praia de Jauá | A beautiful, quiet beach known for its clear waters and natural beauty. Ideal for families and tourists looking for a relaxing beach getaway. | Jauá Beach, Natural pools, Water sports, Local seafood restaurants |
| Praia do Forte | Famous tourist destination with a charming village vibe, historical sites, and stunning beaches. Attracts both eco-tourists and those seeking luxury accommodations. | Fort of São Antônio, Tamar Project, Praia do Forte Beach, Kiosk Beach, Village shops and restaurants |
| Camaçari Centro | The central area of Camaçari, offering access to local culture, shopping, and dining. A great choice for travelers who want to experience local life. | Camaçari Market, Cultural Center, Church of Our Lady of the Rosary, Local markets |
| Guarajuba | Known for its beautiful beaches and vibrant local community. A popular spot for both locals and travelers, ideal for beach lovers. | Guarajuba Beach, Dunes, Beachfront restaurants, Kite surfing spots |
| Lagoa do Catu | An area known for its natural beauty, including lagoons and rich wildlife, perfect for nature enthusiasts and those looking for tranquility. | Catu Lagoon, Birdwatching, Nature trails, Picnic spots |
| Catu de Abrantes | A burgeoning neighborhood with access to both urban amenities and nature, appealing to families and those wanting a quieter lifestyle. | Parks, Local markets, Proximity to larger urban centers |
| Itacimirim | A serene beach area known for its stunning scenery and calm waters, making it a perfect escape for relaxation and leisure activities. | Itacimirim Beach, Natural lagoons, Eco-tourism activities, Beachfront dining |
| Baía de Todos os Santos | A major bay area with various beaches and recreational activities. Popular for water sports and scenic views. | Boat tours, Fishing, Beachfront churrascarias, Cultural events |
Understanding Airbnb License Requirements & STR Laws in Camaçari (2026)
While Camaçari, Bahia, Brazil currently shows low STR regulations, specific Airbnb license requirements might still exist or change. Always verify the latest short term rental regulations and Airbnb license requirements directly with local government authorities for Camaçari to ensure full compliance before hosting.
(Source: AirROI data, 2026, based on 0% licensed listings)
Top Performing Airbnb Properties in Camaçari (2026)
Benchmark your potential! Explore examples of top-performing Airbnb properties in Camaçaribased on Trailing Twelve Month (TTM) revenue. Analyze their characteristics, revenue, occupancy rate, and ADR to understand what drives success in this market.
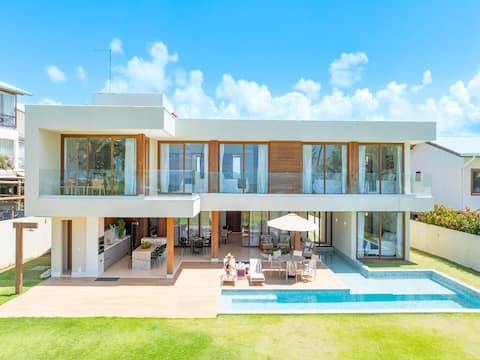
Maruwá - Villa Corais - Luxury on the sand
Entire Place • 7 bedrooms
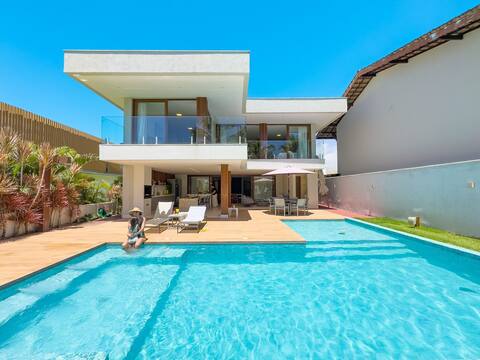
Maruwá - Villa Esmeralda - Foot in the sand
Entire Place • 7 bedrooms

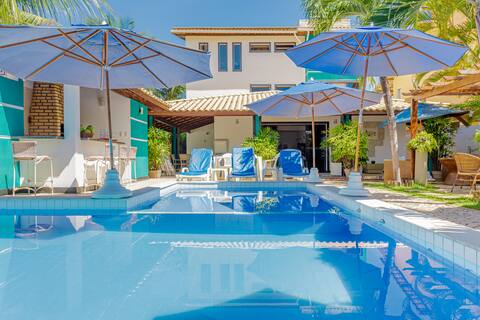
GB113 - Wonderful House Right on the Sand - Guarajuba
Entire Place • 5 bedrooms

Casa Charme - Right on the sand
Entire Place • 6 bedrooms
GB19 House 7/4 50m from the Beach
Entire Place • 7 bedrooms

House 2 min walk to the beach; maid, AC, Wi-Fi
Entire Place • 5 bedrooms
Note: Performance varies based on location, size, amenities, seasonality, and management quality. Data reflects the past 12 months.
Top Performing Airbnb Hosts in Camaçari (2026)
Learn from the best! This table showcases top-performing Airbnb hosts in Camaçari based on the number of properties managed and estimated total revenue over the past year. Analyze their scale and performance metrics.
| Host Name | Properties | Grossing Revenue | Stay Reviews | Avg Rating |
|---|---|---|---|---|
| Yalug | 90 | $1,614,621 | 573 | 4.72/5.0 |
| Maruwá Villas | 4 | $422,557 | 43 | 4.96/5.0 |
| Gibran | 11 | $153,007 | 229 | 4.90/5.0 |
| Gleice | 2 | $139,589 | 102 | 4.96/5.0 |
| Victor | 3 | $133,264 | 66 | 4.92/5.0 |
| Oberti | 1 | $119,115 | 7 | 5.00/5.0 |
| Casa Da Chris | 1 | $108,082 | 75 | 5.00/5.0 |
| Andrea | 3 | $107,311 | 23 | 4.87/5.0 |
| Danielson Costa Lima | 4 | $103,212 | 54 | 4.96/5.0 |
| Vera | 2 | $103,087 | 135 | 4.88/5.0 |
Analyzing the strategies of top hosts, such as their property selection, pricing, and guest communication, can offer valuable lessons for optimizing your own Airbnb operations in Camaçari.
Dive Deeper: Advanced Camaçari STR Market Data (2026)
Ready to unlock more insights? AirROI provides access to advanced metrics and comprehensive Airbnb data for Camaçari. Explore detailed analytics beyond this report to refine your investment strategy, optimize pricing, and maximize your vacation rental profits.
Explore Advanced MetricsCamaçari Short-Term Rental Market Composition (2026): Property & Room Types
Room Type Distribution
Property Type Distribution
Market Composition Insights for Camaçari
- The Camaçari Airbnb market composition is heavily skewed towards Entire Home/Apt listings, which make up 97.6% of the 1,987 active rentals. This indicates strong guest preference for privacy and space.
- Looking at the property type distribution in Camaçari, House properties are the most common (63%), reflecting the local real estate landscape.
- Houses represent a significant 63% portion, catering likely to families or larger groups.
- Smaller segments like hotel/boutique, others, outdoor/unique (combined 2.0%) offer potential for unique stay experiences.
Camaçari Airbnb Room Capacity Analysis (2026): Bedroom Distribution
Distribution of Listings by Number of Bedrooms
Room Capacity Insights for Camaçari
- The dominant room capacity in Camaçari is 2 bedrooms listings, making up 28.5% of the market. This suggests a strong demand for properties suitable for couples or solo travelers.
- Together, 2 bedrooms and 3 bedrooms properties represent 56.1% of the active Airbnb listings in Camaçari, indicating a high concentration in these sizes.
- A significant 63.0% of listings offer 3+ bedrooms, catering to larger groups and families seeking more space in Camaçari.
Camaçari Vacation Rental Guest Capacity Trends (2026)
Distribution of Listings by Guest Capacity
Guest Capacity Insights for Camaçari
- The most common guest capacity trend in Camaçari vacation rentals is listings accommodating 8+ guests (56.4%). This suggests the primary traveler segment is likely larger groups.
- Properties designed for 8+ guests and 6 guests dominate the Camaçari STR market, accounting for 81.7% of listings.
- 85.1% of properties accommodate 6+ guests, serving the market segment for larger families or group travel in Camaçari.
- On average, properties in Camaçari are equipped to host 6.8 guests.
Camaçari Airbnb Booking Patterns (2026): Available vs. Booked Days
Available Days Distribution
Booked Days Distribution
Booking Pattern Insights for Camaçari
- The most common availability pattern in Camaçari falls within the 271-366 days range, representing 80.9% of listings. This suggests many properties have significant open periods on their calendars.
- Approximately 95.0% of listings show high availability (181+ days open annually), indicating potential for increased bookings or specific owner usage patterns.
- For booked days, the 1-30 days range is most frequent in Camaçari (45.1%), reflecting common guest stay durations or potential owner blocking patterns.
- A notable 5.3% of properties secure long booking periods (181+ days booked per year), highlighting successful long-term rental strategies or significant owner usage.
Camaçari Airbnb Minimum Stay Requirements Analysis
Distribution of Listings by Minimum Night Requirement
1 Night
179 listings
9% of total
2 Nights
727 listings
36.6% of total
3 Nights
246 listings
12.4% of total
4-6 Nights
103 listings
5.2% of total
7-29 Nights
28 listings
1.4% of total
30+ Nights
704 listings
35.4% of total
Key Insights
- The most prevalent minimum stay requirement in Camaçari is 2 Nights, adopted by 36.6% of listings. This highlights the market's preference for shorter, flexible bookings.
- A significant segment (35.4%) caters to monthly stays (30+ nights) in Camaçari, pointing to opportunities in the extended-stay market.
Recommendations
- Align with the market by considering a 2 Nights minimum stay, as 36.6% of Camaçari hosts use this setting.
- If feasible, allowing 1-night stays, especially midweek or during low season, could capture last-minute bookings, as only 9% currently do.
- A 2-night minimum appears standard (36.6%). Consider this for weekends or peak periods.
- Explore offering discounts for stays of 30+ nights to attract the 35.4% of the market seeking extended stays.
- Adjust minimum nights based on seasonality – potentially shorter during low season and longer during peak demand periods in Camaçari.
Camaçari Airbnb Cancellation Policy Trends Analysis (2026)
Super Strict 60 Days
6 listings
0.3% of total
Super Strict 30 Days
23 listings
1.2% of total
Limited
21 listings
1.1% of total
Flexible
435 listings
22% of total
Moderate
425 listings
21.5% of total
Firm
748 listings
37.8% of total
Strict
323 listings
16.3% of total
Cancellation Policy Insights for Camaçari
- The prevailing Airbnb cancellation policy trend in Camaçari is Firm, used by 37.8% of listings.
- A majority (54.1%) of hosts in Camaçari utilize Firm or Strict policies, indicating a market where hosts prioritize booking security.
Recommendations for Hosts
- Consider adopting a Firm policy to align with the 37.8% market standard in Camaçari.
- Regularly review your cancellation policy against competitors and market demand shifts in Camaçari.
Camaçari STR Booking Lead Time Analysis (2026)
Average Booking Lead Time by Month
Booking Lead Time Insights for Camaçari
- The overall average booking lead time for vacation rentals in Camaçari is 40 days.
- Guests book furthest in advance for stays during December (average 70 days), likely coinciding with peak travel demand or local events.
- The shortest booking windows occur for stays in June (average 17 days), indicating more last-minute travel plans during this time.
- Seasonally, Winter (54 days avg.) sees the longest lead times, while Summer (23 days avg.) has the shortest, reflecting typical travel planning cycles.
Recommendations for Hosts
- Use the overall average lead time (40 days) as a baseline for your pricing and availability strategy in Camaçari.
- For December stays, consider implementing length-of-stay discounts or slightly higher rates for bookings made less than 70 days out to capitalize on advance planning.
- Target marketing efforts for the Winter season well in advance (at least 54 days) to capture early planners.
- Monitor your own booking lead times against these Camaçari averages to identify opportunities for dynamic pricing adjustments.
Popular & Essential Airbnb Amenities in Camaçari (2026)
Amenity Prevalence
Amenity Insights for Camaçari
- Essential amenities in Camaçari that guests expect include: Kitchen, TV, Wifi, Free parking on premises. Lacking these (any) could significantly impact bookings.
- Popular amenities like Pool, Air conditioning, Dishes and silverware are common but not universal. Offering these can provide a competitive edge.
- A pool is a highly desired but not standard amenity, making it a key feature for attracting guests seeking leisure in Camaçari.
Recommendations for Hosts
- Ensure your listing includes all essential amenities for Camaçari: Kitchen, TV, Wifi, Free parking on premises.
- Prioritize adding missing essentials: Kitchen, TV, Wifi, Free parking on premises.
- Consider adding popular differentiators like Pool or Air conditioning to increase appeal.
- Highlight unique or less common amenities you offer (e.g., hot tub, dedicated workspace, EV charger) in your listing description and photos.
- Regularly check competitor amenities in Camaçari to stay competitive.
Camaçari Airbnb Guest Demographics & Profile Analysis (2026)
Guest Profile Summary for Camaçari
- The typical guest profile for Airbnb in Camaçari consists of primarily domestic travelers (91%), often arriving from nearby Salvador, typically belonging to the Post-2000s (Gen Z/Alpha) group (50%), primarily speaking Portuguese or English.
- Domestic travelers account for 91.3% of guests.
- Key international markets include Brazil (91.3%) and United States (2%).
- Top languages spoken are Portuguese (48.1%) followed by English (27.6%).
- A significant demographic segment is the Post-2000s (Gen Z/Alpha) group, representing 50% of guests.
Recommendations for Hosts
- Target domestic marketing efforts towards travelers from Salvador and Bahia.
- Tailor amenities and listing descriptions to appeal to the dominant Post-2000s (Gen Z/Alpha) demographic (e.g., highlight fast WiFi, smart home features, local guides).
- Highlight unique local experiences or amenities relevant to the primary guest profile.
- Consider seasonal promotions aligned with peak travel times for key origin markets.
Nearby Short-Term Rental Market Comparison
How does the Camaçari Airbnb market stack up against its neighbors? Compare key performance metrics like average monthly revenue, ADR, and occupancy rates in surrounding areas to understand the broader regional STR landscape.
| Market | Active Properties | Monthly Revenue | Daily Rate | Avg. Occupancy |
|---|---|---|---|---|
| Mata de São João | 1,442 | $1,069 | $197.43 | 26% |
| São Gonçalo dos Campos | 12 | $670 | $188.97 | 19% |
| Cairu | 922 | $635 | $98.69 | 32% |
| Lauro de Freitas | 315 | $577 | $96.23 | 30% |
| Maraú | 954 | $527 | $139.88 | 23% |
| Salvador | 6,167 | $498 | $65.80 | 36% |
| Esplanada | 19 | $418 | $108.22 | 22% |
| Entre Rios | 145 | $416 | $115.77 | 21% |
| Vera Cruz | 242 | $362 | $116.09 | 20% |
| Estância | 99 | $361 | $111.66 | 21% |