Alcobaça Airbnb Market Analysis 2026: Short Term Rental Data & Vacation Rental Statistics in Bahia, Brazil
Is Airbnb profitable in Alcobaça in 2026? Explore comprehensive Airbnb analytics for Alcobaça, Bahia, Brazil to uncover income potential. This 2026 STR market report for Alcobaça, based on AirROI data from February 2025 to January 2026, reveals key trends in the niche market of 51 active listings.
Whether you're considering an Airbnb investment in Alcobaça, optimizing your existing vacation rental, or exploring rental arbitrage opportunities, understanding the Alcobaça Airbnb data is crucial. Leveraging the low regulation environment is key to maximizing your short term rental income potential. Let's dive into the specifics.
Key Alcobaça Airbnb Performance Metrics Overview
Monthly Airbnb Revenue Variations & Income Potential in Alcobaça (2026)
Understanding the monthly revenue variations for Airbnb listings in Alcobaça is key to maximizing your short term rental income potential. Seasonality significantly impacts earnings. Our analysis, based on data from the past 12 months, shows that the peak revenue month for STRs in Alcobaça is typically January, while August often presents the lowest earnings, highlighting opportunities for strategic pricing adjustments during shoulder and low seasons. Explore the typical Airbnb income in Alcobaça across different performance tiers:
- Best-in-class properties (Top 10%) achieve $1,174+ monthly, often utilizing dynamic pricing and superior guest experiences.
- Strong performing properties (Top 25%) earn $688 or more, indicating effective management and desirable locations/amenities.
- Typical properties (Median) generate around $346 per month, representing the average market performance.
- Entry-level properties (Bottom 25%) see earnings around $161, often with potential for optimization.
Average Monthly Airbnb Earnings Trend in Alcobaça
Alcobaça Airbnb Occupancy Rate Trends (2026)
Maximize your bookings by understanding the Alcobaça STR occupancy trends. Seasonal demand shifts significantly influence how often properties are booked. Typically, Januarysees the highest demand (peak season occupancy), while August experiences the lowest (low season). Effective strategies, like adjusting minimum stays or offering promotions, can boost occupancy during slower periods. Here's how different property tiers perform in Alcobaça:
- Best-in-class properties (Top 10%) achieve 40%+ occupancy, indicating high desirability and potentially optimized availability.
- Strong performing properties (Top 25%) maintain 24% or higher occupancy, suggesting good market fit and guest satisfaction.
- Typical properties (Median) have an occupancy rate around 13%.
- Entry-level properties (Bottom 25%) average 7% occupancy, potentially facing higher vacancy.
Average Monthly Occupancy Rate Trend in Alcobaça
Average Daily Rate (ADR) Airbnb Trends in Alcobaça (2026)
Effective short term rental pricing strategy in Alcobaça involves understanding monthly ADR fluctuations. The Average Daily Rate (ADR) for Airbnb in Alcobaça typically peaks in July and dips lowest during September. Leveraging Airbnb dynamic pricing tools or strategies based on this seasonality can significantly boost revenue. Here's a look at the typical nightly rates achieved:
- Best-in-class properties (Top 10%) command rates of $160+ per night, often due to premium features or locations.
- Strong performing properties (Top 25%) achieve nightly rates of $110 or more.
- Typical properties (Median) charge around $76 per night.
- Entry-level properties (Bottom 25%) earn around $60 per night.
Average Daily Rate (ADR) Trend by Month in Alcobaça
Get Live Alcobaça Market Intelligence 👇

Explore Real-time Analytics
Airbnb Seasonality Analysis & Trends in Alcobaça (2026)
Peak Season (January, March, December)
- Revenue averages $809 per month
- Occupancy rates average 26.0%
- Daily rates average $106
Shoulder Season
- Revenue averages $435 per month
- Occupancy maintains around 17.0%
- Daily rates hold near $105
Low Season (May, August, September)
- Revenue drops to average $328 per month
- Occupancy decreases to average 13.4%
- Daily rates adjust to average $103
Seasonality Insights for Alcobaça
- The Airbnb seasonality in Alcobaça shows highly seasonal trends requiring careful strategy. While the sections above show seasonal averages, it's also insightful to look at the extremes:
- During the high season, the absolute peak month showcases Alcobaça's highest earning potential, with monthly revenues capable of climbing to $1,124, occupancy reaching a high of 32.5%, and ADRs peaking at $112.
- Conversely, the slowest single month of the year, typically falling within the low season, marks the market's lowest point. In this month, revenue might dip to $291, occupancy could drop to 10.2%, and ADRs may adjust down to $90.
- Understanding both the seasonal averages and these monthly peaks and troughs in revenue, occupancy, and ADR is crucial for maximizing your Airbnb profit potential in Alcobaça.
Seasonal Strategies for Maximizing Profit
- Peak Season: Maximize revenue through premium pricing and potentially longer minimum stays. Ensure high availability.
- Low Season: Offer competitive pricing, special promotions (e.g., extended stay discounts), and flexible cancellation policies. Target off-season travelers like remote workers or budget-conscious guests.
- Shoulder Seasons: Implement dynamic pricing that balances peak and low rates. Target weekend travelers or specific events. Offer slightly more flexible terms than peak season.
- Regularly analyze your own performance against these Alcobaça seasonality benchmarks and adjust your pricing and availability strategy accordingly.
Best Areas for Airbnb Investment in Alcobaça (2026)
Exploring the top neighborhoods for short-term rentals in Alcobaça? This section highlights key areas, outlining why they are attractive for hosts and guests, along with notable local attractions. Consider these locations based on your target guest profile and investment strategy.
| Neighborhood / Area | Why Host Here? (Target Guests & Appeal) | Key Attractions & Landmarks |
|---|---|---|
| Historic Center | Rich in history and colonial architecture, the Historic Center of Alcobaça attracts tourists interested in culture and heritage. It's a hub for local restaurants and shops, and close to key attractions. | Igreja de São João Batista, Museu de Arte Sacra, Cachoeira de Alcobaça, Praça Pedro Figueiredo, Praia de Itacaré |
| Praia do Ponta de Médici | This beach is known for its stunning natural beauty and tranquil waters. It's a popular spot for families and visitors seeking relaxation and leisure activities, making it ideal for vacation rentals. | Ponta de Médici Beach, Natural Pools, Kayaking, Beach Bars, Local Seafood Restaurants |
| Praia de Santa Maria | A beautiful beach renowned for its clear waters and picturesque scenery. It’s an ideal location for those looking to enjoy sun and sea, attracting tourists and locals alike. | Santa Maria Beach, Watersports, Sunbathing Spots, Beachfront Restaurants, Local Artisan Markets |
| Canyon do Rio São Miguel | An adventurous location for those interested in nature and exploration. The canyon offers hiking, breathtaking views, and a chance to connect with nature, appealing to ecotourism. | Hiking Trails, Scenic Lookouts, Wildlife Watching, River Activities, Guided Tours |
| Local Markets | The vibrant local markets in Alcobaça are a must-visit for tourists. They showcase local crafts, foods, and culture, providing a unique experience that appeals to visitors. | Alcobaça Market, Local Crafts, Traditional Foods, Cultural Events, Artisan Workshops |
| Praia do Cururupe | Popular for its beautiful coastline and surfing conditions, Cururupe Beach attracts young travelers and surfers. It's a hotspot for beach activities and social gatherings. | Surfing, Beach Parties, Sunsets, Local Surf Schools, Beachfront Cafes |
| Cultural Festivals | Alcobaça hosts various cultural festivals throughout the year, attracting visitors who want to experience local traditions and celebration of culture. These events boost the local economy and attract Airbnb guests. | Festa de São João, Carnaval, Local Music Festivals, Culinary Events, Art Fairs |
| Baía de Todos os Santos | This bay offers breathtaking views and a variety of water activities. It's an excellent spot for visitors looking to explore the natural beauty of the region while enjoying various recreational activities. | Boat Tours, Fishing, Relaxing Beaches, Ecological Tours, Dolphin Watching |
Understanding Airbnb License Requirements & STR Laws in Alcobaça (2026)
While Alcobaça, Bahia, Brazil currently shows low STR regulations, specific Airbnb license requirements might still exist or change. Always verify the latest short term rental regulations and Airbnb license requirements directly with local government authorities for Alcobaça to ensure full compliance before hosting.
(Source: AirROI data, 2026, finding no licensed listings among those analyzed)
Top Performing Airbnb Properties in Alcobaça (2026)
Benchmark your potential! Explore examples of top-performing Airbnb properties in Alcobaçabased on Trailing Twelve Month (TTM) revenue. Analyze their characteristics, revenue, occupancy rate, and ADR to understand what drives success in this market.
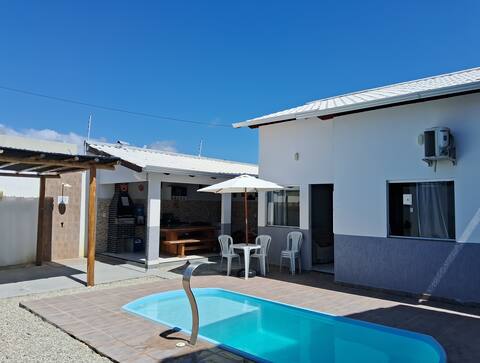
Cheerful house with pool less than 50 meters from the beach
Entire Place • 2 bedrooms

Refúgio Baiano - Swimming Pool and Barbecue - Alcobaça
Entire Place • 3 bedrooms

Sol dos Corais Cottage
Entire Place • 2 bedrooms

House on the Atlantic Coast of Bahia
Entire Place • 3 bedrooms
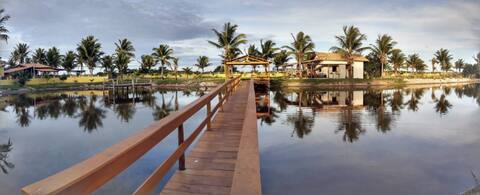
House, swimming pool and lagoon facing the sea, right on the sand
Entire Place • 4 bedrooms

Rota do Sol House
Entire Place • 3 bedrooms
Note: Performance varies based on location, size, amenities, seasonality, and management quality. Data reflects the past 12 months.
Top Performing Airbnb Hosts in Alcobaça (2026)
Learn from the best! This table showcases top-performing Airbnb hosts in Alcobaça based on the number of properties managed and estimated total revenue over the past year. Analyze their scale and performance metrics.
| Host Name | Properties | Grossing Revenue | Stay Reviews | Avg Rating |
|---|---|---|---|---|
| Eli Prates | 2 | $10,963 | 97 | 4.74/5.0 |
| Julio | 1 | $10,147 | 29 | 4.93/5.0 |
| Fernanda | 1 | $9,703 | 21 | 4.67/5.0 |
| Sol | 1 | $9,406 | 14 | 4.93/5.0 |
| Adanil | 2 | $7,927 | 5 | 5.00/5.0 |
| Heloisa Pereira De | 1 | $6,812 | 7 | 5.00/5.0 |
| Robson | 1 | $6,354 | 10 | 5.00/5.0 |
| Dila | 1 | $5,584 | 5 | 4.40/5.0 |
| Uelder | 1 | $5,265 | 3 | 5.00/5.0 |
| Henrique | 1 | $5,032 | 10 | 4.90/5.0 |
Analyzing the strategies of top hosts, such as their property selection, pricing, and guest communication, can offer valuable lessons for optimizing your own Airbnb operations in Alcobaça.
Dive Deeper: Advanced Alcobaça STR Market Data (2026)
Ready to unlock more insights? AirROI provides access to advanced metrics and comprehensive Airbnb data for Alcobaça. Explore detailed analytics beyond this report to refine your investment strategy, optimize pricing, and maximize your vacation rental profits.
Explore Advanced MetricsAlcobaça Short-Term Rental Market Composition (2026): Property & Room Types
Room Type Distribution
Property Type Distribution
Market Composition Insights for Alcobaça
- The Alcobaça Airbnb market composition is heavily skewed towards Entire Home/Apt listings, which make up 90.2% of the 51 active rentals. This indicates strong guest preference for privacy and space.
- Looking at the property type distribution in Alcobaça, House properties are the most common (84.3%), reflecting the local real estate landscape.
- Houses represent a significant 84.3% portion, catering likely to families or larger groups.
- Smaller segments like hotel/boutique, others (combined 4.0%) offer potential for unique stay experiences.
Alcobaça Airbnb Room Capacity Analysis (2026): Bedroom Distribution
Distribution of Listings by Number of Bedrooms
Room Capacity Insights for Alcobaça
- The dominant room capacity in Alcobaça is 3 bedrooms listings, making up 31.4% of the market. This suggests a strong demand for properties suitable for families or small groups.
- Together, 3 bedrooms and 2 bedrooms properties represent 58.9% of the active Airbnb listings in Alcobaça, indicating a high concentration in these sizes.
- A significant 56.9% of listings offer 3+ bedrooms, catering to larger groups and families seeking more space in Alcobaça.
Alcobaça Vacation Rental Guest Capacity Trends (2026)
Distribution of Listings by Guest Capacity
Guest Capacity Insights for Alcobaça
- The most common guest capacity trend in Alcobaça vacation rentals is listings accommodating 8+ guests (52.9%). This suggests the primary traveler segment is likely larger groups.
- Properties designed for 8+ guests and 6 guests dominate the Alcobaça STR market, accounting for 62.7% of listings.
- 70.5% of properties accommodate 6+ guests, serving the market segment for larger families or group travel in Alcobaça.
- On average, properties in Alcobaça are equipped to host 6.4 guests.
Alcobaça Airbnb Booking Patterns (2026): Available vs. Booked Days
Available Days Distribution
Booked Days Distribution
Booking Pattern Insights for Alcobaça
- The most common availability pattern in Alcobaça falls within the 271-366 days range, representing 96.1% of listings. This suggests many properties have significant open periods on their calendars.
- Approximately 100.0% of listings show high availability (181+ days open annually), indicating potential for increased bookings or specific owner usage patterns.
- For booked days, the 1-30 days range is most frequent in Alcobaça (62.7%), reflecting common guest stay durations or potential owner blocking patterns.
Alcobaça Airbnb Minimum Stay Requirements Analysis
Distribution of Listings by Minimum Night Requirement
1 Night
17 listings
33.3% of total
2 Nights
12 listings
23.5% of total
3 Nights
5 listings
9.8% of total
4-6 Nights
3 listings
5.9% of total
30+ Nights
14 listings
27.5% of total
Key Insights
- The most prevalent minimum stay requirement in Alcobaça is 1 Night, adopted by 33.3% of listings. This highlights the market's preference for shorter, flexible bookings.
- A significant segment (27.5%) caters to monthly stays (30+ nights) in Alcobaça, pointing to opportunities in the extended-stay market.
Recommendations
- Align with the market by considering a 1 Night minimum stay, as 33.3% of Alcobaça hosts use this setting.
- Explore offering discounts for stays of 30+ nights to attract the 27.5% of the market seeking extended stays.
- Adjust minimum nights based on seasonality – potentially shorter during low season and longer during peak demand periods in Alcobaça.
Alcobaça Airbnb Cancellation Policy Trends Analysis (2026)
Limited
2 listings
3.9% of total
Flexible
13 listings
25.5% of total
Moderate
8 listings
15.7% of total
Firm
25 listings
49% of total
Strict
3 listings
5.9% of total
Cancellation Policy Insights for Alcobaça
- The prevailing Airbnb cancellation policy trend in Alcobaça is Firm, used by 49% of listings.
- A majority (54.9%) of hosts in Alcobaça utilize Firm or Strict policies, indicating a market where hosts prioritize booking security.
- Strict cancellation policies are quite rare (5.9%), potentially making listings with this policy less competitive unless justified by high demand or property type.
Recommendations for Hosts
- Consider adopting a Firm policy to align with the 49% market standard in Alcobaça.
- Using a Strict policy might deter some guests, as only 5.9% of listings use it. Evaluate if potential revenue protection outweighs possible lower booking rates.
- Regularly review your cancellation policy against competitors and market demand shifts in Alcobaça.
Alcobaça STR Booking Lead Time Analysis (2026)
Average Booking Lead Time by Month
Booking Lead Time Insights for Alcobaça
- The overall average booking lead time for vacation rentals in Alcobaça is 46 days.
- Guests book furthest in advance for stays during December (average 60 days), likely coinciding with peak travel demand or local events.
- The shortest booking windows occur for stays in June (average 4 days), indicating more last-minute travel plans during this time.
- Seasonally, Winter (50 days avg.) sees the longest lead times, while Summer (27 days avg.) has the shortest, reflecting typical travel planning cycles.
Recommendations for Hosts
- Use the overall average lead time (46 days) as a baseline for your pricing and availability strategy in Alcobaça.
- For December stays, consider implementing length-of-stay discounts or slightly higher rates for bookings made less than 60 days out to capitalize on advance planning.
- During June, focus on last-minute booking availability and promotions, as guests book with very short notice (4 days avg.).
- Target marketing efforts for the Winter season well in advance (at least 50 days) to capture early planners.
- Monitor your own booking lead times against these Alcobaça averages to identify opportunities for dynamic pricing adjustments.
Popular & Essential Airbnb Amenities in Alcobaça (2026)
Amenity Prevalence
Amenity Insights for Alcobaça
- Popular amenities like Free parking on premises, Kitchen, BBQ grill are common but not universal. Offering these can provide a competitive edge.
- Warning: Wifi is not universally provided but is considered essential globally. Ensure reliable Wifi is offered.
Recommendations for Hosts
- Consider adding popular differentiators like Free parking on premises or Kitchen to increase appeal.
- Highlight unique or less common amenities you offer (e.g., hot tub, dedicated workspace, EV charger) in your listing description and photos.
- Regularly check competitor amenities in Alcobaça to stay competitive.
Alcobaça Airbnb Guest Demographics & Profile Analysis (2026)
Guest Profile Summary for Alcobaça
- The typical guest profile for Airbnb in Alcobaça consists of primarily domestic travelers (96%), often arriving from nearby Belo Horizonte, typically belonging to the Post-2000s (Gen Z/Alpha) group (50%), primarily speaking Portuguese or English.
- Domestic travelers account for 96.0% of guests.
- Key international markets include Brazil (96%) and Argentina (4%).
- Top languages spoken are Portuguese (55.6%) followed by English (22.2%).
- A significant demographic segment is the Post-2000s (Gen Z/Alpha) group, representing 50% of guests.
Recommendations for Hosts
- Target domestic marketing efforts towards travelers from Belo Horizonte and State of Minas Gerais.
- Tailor amenities and listing descriptions to appeal to the dominant Post-2000s (Gen Z/Alpha) demographic (e.g., highlight fast WiFi, smart home features, local guides).
- Highlight unique local experiences or amenities relevant to the primary guest profile.
- Consider seasonal promotions aligned with peak travel times for key origin markets.
Nearby Short-Term Rental Market Comparison
How does the Alcobaça Airbnb market stack up against its neighbors? Compare key performance metrics like average monthly revenue, ADR, and occupancy rates in surrounding areas to understand the broader regional STR landscape.
| Market | Active Properties | Monthly Revenue | Daily Rate | Avg. Occupancy |
|---|---|---|---|---|
| Porto Seguro | 3,755 | $845 | $139.02 | 30% |
| Prado | 904 | $439 | $109.79 | 23% |
| Santa Cruz Cabrália | 443 | $408 | $90.06 | 27% |
| São Mateus | 177 | $363 | $98.35 | 21% |
| Mucuri | 42 | $321 | $86.41 | 25% |
| Conceição da Barra | 139 | $291 | $79.14 | 21% |
| Caravelas | 33 | $230 | $54.08 | 22% |
| Nova Viçosa | 86 | $161 | $81.73 | 18% |
| Teixeira de Freitas | 14 | $136 | $25.93 | 29% |
| Eunápolis | 14 | $74 | $27.12 | 22% |