Paripueira Airbnb Market Analysis 2026: Short Term Rental Data & Vacation Rental Statistics in Alagoas, Brazil
Is Airbnb profitable in Paripueira in 2026? Explore comprehensive Airbnb analytics for Paripueira, Alagoas, Brazil to uncover income potential. This 2026 STR market report for Paripueira, based on AirROI data from February 2025 to January 2026, reveals key trends in the niche market of 149 active listings.
Whether you're considering an Airbnb investment in Paripueira, optimizing your existing vacation rental, or exploring rental arbitrage opportunities, understanding the Paripueira Airbnb data is crucial. Leveraging the low regulation environment is key to maximizing your short term rental income potential. Let's dive into the specifics.
Key Paripueira Airbnb Performance Metrics Overview
Monthly Airbnb Revenue Variations & Income Potential in Paripueira (2026)
Understanding the monthly revenue variations for Airbnb listings in Paripueira is key to maximizing your short term rental income potential. Seasonality significantly impacts earnings. Our analysis, based on data from the past 12 months, shows that the peak revenue month for STRs in Paripueira is typically January, while May often presents the lowest earnings, highlighting opportunities for strategic pricing adjustments during shoulder and low seasons. Explore the typical Airbnb income in Paripueira across different performance tiers:
- Best-in-class properties (Top 10%) achieve $3,226+ monthly, often utilizing dynamic pricing and superior guest experiences.
- Strong performing properties (Top 25%) earn $1,955 or more, indicating effective management and desirable locations/amenities.
- Typical properties (Median) generate around $827 per month, representing the average market performance.
- Entry-level properties (Bottom 25%) see earnings around $332, often with potential for optimization.
Average Monthly Airbnb Earnings Trend in Paripueira
Paripueira Airbnb Occupancy Rate Trends (2026)
Maximize your bookings by understanding the Paripueira STR occupancy trends. Seasonal demand shifts significantly influence how often properties are booked. Typically, Januarysees the highest demand (peak season occupancy), while June experiences the lowest (low season). Effective strategies, like adjusting minimum stays or offering promotions, can boost occupancy during slower periods. Here's how different property tiers perform in Paripueira:
- Best-in-class properties (Top 10%) achieve 68%+ occupancy, indicating high desirability and potentially optimized availability.
- Strong performing properties (Top 25%) maintain 46% or higher occupancy, suggesting good market fit and guest satisfaction.
- Typical properties (Median) have an occupancy rate around 23%.
- Entry-level properties (Bottom 25%) average 10% occupancy, potentially facing higher vacancy.
Average Monthly Occupancy Rate Trend in Paripueira
Average Daily Rate (ADR) Airbnb Trends in Paripueira (2026)
Effective short term rental pricing strategy in Paripueira involves understanding monthly ADR fluctuations. The Average Daily Rate (ADR) for Airbnb in Paripueira typically peaks in January and dips lowest during April. Leveraging Airbnb dynamic pricing tools or strategies based on this seasonality can significantly boost revenue. Here's a look at the typical nightly rates achieved:
- Best-in-class properties (Top 10%) command rates of $242+ per night, often due to premium features or locations.
- Strong performing properties (Top 25%) achieve nightly rates of $164 or more.
- Typical properties (Median) charge around $111 per night.
- Entry-level properties (Bottom 25%) earn around $74 per night.
Average Daily Rate (ADR) Trend by Month in Paripueira
Get Live Paripueira Market Intelligence 👇

Explore Real-time Analytics
Airbnb Seasonality Analysis & Trends in Paripueira (2026)
Peak Season (January, December, March)
- Revenue averages $1,993 per month
- Occupancy rates average 35.1%
- Daily rates average $155
Shoulder Season
- Revenue averages $1,383 per month
- Occupancy maintains around 31.3%
- Daily rates hold near $138
Low Season (April, May, June)
- Revenue drops to average $942 per month
- Occupancy decreases to average 25.1%
- Daily rates adjust to average $130
Seasonality Insights for Paripueira
- The Airbnb seasonality in Paripueira shows highly seasonal trends requiring careful strategy. While the sections above show seasonal averages, it's also insightful to look at the extremes:
- During the high season, the absolute peak month showcases Paripueira's highest earning potential, with monthly revenues capable of climbing to $2,312, occupancy reaching a high of 36.9%, and ADRs peaking at $167.
- Conversely, the slowest single month of the year, typically falling within the low season, marks the market's lowest point. In this month, revenue might dip to $793, occupancy could drop to 22.0%, and ADRs may adjust down to $129.
- Understanding both the seasonal averages and these monthly peaks and troughs in revenue, occupancy, and ADR is crucial for maximizing your Airbnb profit potential in Paripueira.
Seasonal Strategies for Maximizing Profit
- Peak Season: Maximize revenue through premium pricing and potentially longer minimum stays. Ensure high availability.
- Low Season: Offer competitive pricing, special promotions (e.g., extended stay discounts), and flexible cancellation policies. Target off-season travelers like remote workers or budget-conscious guests.
- Shoulder Seasons: Implement dynamic pricing that balances peak and low rates. Target weekend travelers or specific events. Offer slightly more flexible terms than peak season.
- Regularly analyze your own performance against these Paripueira seasonality benchmarks and adjust your pricing and availability strategy accordingly.
Best Areas for Airbnb Investment in Paripueira (2026)
Exploring the top neighborhoods for short-term rentals in Paripueira? This section highlights key areas, outlining why they are attractive for hosts and guests, along with notable local attractions. Consider these locations based on your target guest profile and investment strategy.
| Neighborhood / Area | Why Host Here? (Target Guests & Appeal) | Key Attractions & Landmarks |
|---|---|---|
| Praia de Paripueira | Beautiful beach known for its clear waters and coral reefs, ideal for tourists seeking relaxation and water sports. | Coral reefs, Natural pools, Beach bars, Snorkeling tours, Sunset views |
| Praia do Carro Quebrado | Famous for its stunning natural beauty and unique landscape, attracting adventure seekers and nature lovers. | Cliffs, Sand dunes, Hiking trails, Photography spots, Local artisan markets |
| Centro de Paripueira | The charming center of town with local shops and restaurants, providing visitors with a taste of local culture. | Local cuisine, Shopping, Cultural festivals, Artisan shops, Local markets |
| Praia de Frances | Nearby beach known for its lively atmosphere, water sports, and beachfront restaurants, popular with families and young people. | Water sports, Beach volleyball, Restaurants, Live music, Beach parties |
| Praia do Patacho | Less crowded beach offering tranquility and natural beauty, ideal for those looking to escape the hustle of tourist hotspots. | Natural beauty, Secluded spots, Local wildlife, Relaxation, Eco-friendly accommodations |
| Igreja Nossa Senhora da Conceição | Historical church that is a landmark in the area, attracting tourists interested in local history and architecture. | Historical architecture, Cultural significance, Local art, Community events, Relaxing ambiance |
| Mirante do Alto | Scenic viewpoint providing panoramic views of the beaches and surroundings, perfect for photography and nature appreciation. | Panoramic views, Scenic hikes, Sunset watching, Birdwatching, Quiet retreats |
| Praia da Barra de São Miguel | A lively beach area with various recreational activities, making it a hit among tourists for day trips. | Water activities, Boat tours, Local seafood, Beachfront cafes, Family-friendly activities |
Understanding Airbnb License Requirements & STR Laws in Paripueira (2026)
While Paripueira, Alagoas, Brazil currently shows low STR regulations, specific Airbnb license requirements might still exist or change. Always verify the latest short term rental regulations and Airbnb license requirements directly with local government authorities for Paripueira to ensure full compliance before hosting.
(Source: AirROI data, 2026, based on 1% licensed listings)
Top Performing Airbnb Properties in Paripueira (2026)
Benchmark your potential! Explore examples of top-performing Airbnb properties in Paripueirabased on Trailing Twelve Month (TTM) revenue. Analyze their characteristics, revenue, occupancy rate, and ADR to understand what drives success in this market.

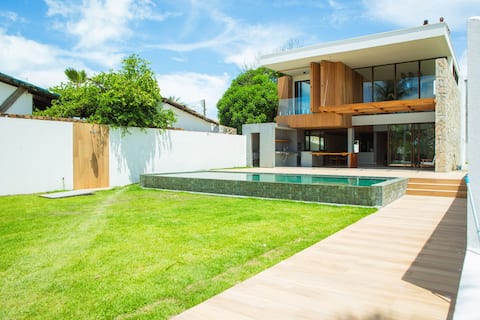
House in a gated community on Sonho Verde Beach
Entire Place • 5 bedrooms
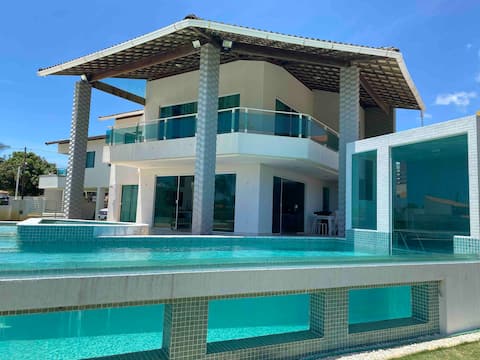
Dream House in Paripueira
Entire Place • 5 bedrooms

Large oceanfront house 23 guests
Entire Place • 8 bedrooms

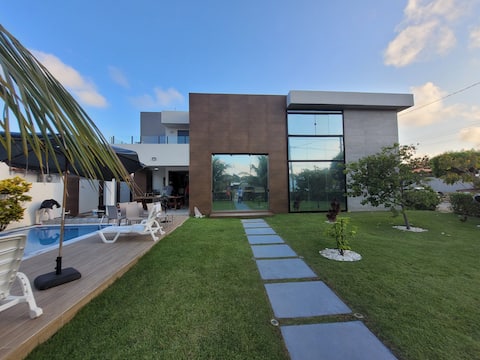
Paradise by the sea
Entire Place • 6 bedrooms
House on Sonho Verde Beach with Pool and Sauna.
Entire Place • 9 bedrooms
Exquisite house (20 people) Condomínio Águas Mansas
Entire Place • 5 bedrooms
Note: Performance varies based on location, size, amenities, seasonality, and management quality. Data reflects the past 12 months.
Top Performing Airbnb Hosts in Paripueira (2026)
Learn from the best! This table showcases top-performing Airbnb hosts in Paripueira based on the number of properties managed and estimated total revenue over the past year. Analyze their scale and performance metrics.
| Host Name | Properties | Grossing Revenue | Stay Reviews | Avg Rating |
|---|---|---|---|---|
| Juliana | 3 | $97,728 | 57 | 5.00/5.0 |
| Natalia | 1 | $95,476 | 45 | 4.87/5.0 |
| Ademar | 3 | $88,990 | 125 | 4.90/5.0 |
| Andre | 1 | $73,125 | 49 | 5.00/5.0 |
| Regina | 1 | $64,968 | 17 | 4.76/5.0 |
| Clément | 1 | $54,547 | 22 | 4.86/5.0 |
| Erich | 1 | $43,921 | 10 | 5.00/5.0 |
| Marianna | 2 | $42,109 | 47 | 5.00/5.0 |
| Reinaldo | 2 | $38,782 | 116 | 4.86/5.0 |
| Mônica | 1 | $31,216 | 75 | 4.99/5.0 |
Analyzing the strategies of top hosts, such as their property selection, pricing, and guest communication, can offer valuable lessons for optimizing your own Airbnb operations in Paripueira.
Dive Deeper: Advanced Paripueira STR Market Data (2026)
Ready to unlock more insights? AirROI provides access to advanced metrics and comprehensive Airbnb data for Paripueira. Explore detailed analytics beyond this report to refine your investment strategy, optimize pricing, and maximize your vacation rental profits.
Explore Advanced MetricsParipueira Short-Term Rental Market Composition (2026): Property & Room Types
Room Type Distribution
Property Type Distribution
Market Composition Insights for Paripueira
- The Paripueira Airbnb market composition is heavily skewed towards Entire Home/Apt listings, which make up 96.6% of the 149 active rentals. This indicates strong guest preference for privacy and space.
- Looking at the property type distribution in Paripueira, House properties are the most common (91.9%), reflecting the local real estate landscape.
- Houses represent a significant 91.9% portion, catering likely to families or larger groups.
- Smaller segments like apartment/condo, hotel/boutique, others, outdoor/unique (combined 8.1%) offer potential for unique stay experiences.
Paripueira Airbnb Room Capacity Analysis (2026): Bedroom Distribution
Distribution of Listings by Number of Bedrooms
Room Capacity Insights for Paripueira
- The dominant room capacity in Paripueira is 3 bedrooms listings, making up 35.6% of the market. This suggests a strong demand for properties suitable for families or small groups.
- Together, 3 bedrooms and 4 bedrooms properties represent 62.4% of the active Airbnb listings in Paripueira, indicating a high concentration in these sizes.
- A significant 81.2% of listings offer 3+ bedrooms, catering to larger groups and families seeking more space in Paripueira.
Paripueira Vacation Rental Guest Capacity Trends (2026)
Distribution of Listings by Guest Capacity
Guest Capacity Insights for Paripueira
- The most common guest capacity trend in Paripueira vacation rentals is listings accommodating 8+ guests (71.1%). This suggests the primary traveler segment is likely larger groups.
- Properties designed for 8+ guests and 6 guests dominate the Paripueira STR market, accounting for 80.5% of listings.
- 86.5% of properties accommodate 6+ guests, serving the market segment for larger families or group travel in Paripueira.
- On average, properties in Paripueira are equipped to host 7.1 guests.
Paripueira Airbnb Booking Patterns (2026): Available vs. Booked Days
Available Days Distribution
Booked Days Distribution
Booking Pattern Insights for Paripueira
- The most common availability pattern in Paripueira falls within the 271-366 days range, representing 75.2% of listings. This suggests many properties have significant open periods on their calendars.
- Approximately 90.6% of listings show high availability (181+ days open annually), indicating potential for increased bookings or specific owner usage patterns.
- For booked days, the 1-30 days range is most frequent in Paripueira (39.6%), reflecting common guest stay durations or potential owner blocking patterns.
- A notable 9.4% of properties secure long booking periods (181+ days booked per year), highlighting successful long-term rental strategies or significant owner usage.
Paripueira Airbnb Minimum Stay Requirements Analysis
Distribution of Listings by Minimum Night Requirement
1 Night
16 listings
10.7% of total
2 Nights
59 listings
39.6% of total
3 Nights
13 listings
8.7% of total
4-6 Nights
4 listings
2.7% of total
30+ Nights
57 listings
38.3% of total
Key Insights
- The most prevalent minimum stay requirement in Paripueira is 2 Nights, adopted by 39.6% of listings. This highlights the market's preference for shorter, flexible bookings.
- A significant segment (38.3%) caters to monthly stays (30+ nights) in Paripueira, pointing to opportunities in the extended-stay market.
Recommendations
- Align with the market by considering a 2 Nights minimum stay, as 39.6% of Paripueira hosts use this setting.
- If feasible, allowing 1-night stays, especially midweek or during low season, could capture last-minute bookings, as only 10.7% currently do.
- A 2-night minimum appears standard (39.6%). Consider this for weekends or peak periods.
- Explore offering discounts for stays of 30+ nights to attract the 38.3% of the market seeking extended stays.
- Adjust minimum nights based on seasonality – potentially shorter during low season and longer during peak demand periods in Paripueira.
Paripueira Airbnb Cancellation Policy Trends Analysis (2026)
Limited
1 listings
0.7% of total
Flexible
32 listings
21.8% of total
Moderate
36 listings
24.5% of total
Firm
56 listings
38.1% of total
Strict
22 listings
15% of total
Cancellation Policy Insights for Paripueira
- The prevailing Airbnb cancellation policy trend in Paripueira is Firm, used by 38.1% of listings.
- A majority (53.1%) of hosts in Paripueira utilize Firm or Strict policies, indicating a market where hosts prioritize booking security.
Recommendations for Hosts
- Consider adopting a Firm policy to align with the 38.1% market standard in Paripueira.
- Regularly review your cancellation policy against competitors and market demand shifts in Paripueira.
Paripueira STR Booking Lead Time Analysis (2026)
Average Booking Lead Time by Month
Booking Lead Time Insights for Paripueira
- The overall average booking lead time for vacation rentals in Paripueira is 49 days.
- Guests book furthest in advance for stays during December (average 82 days), likely coinciding with peak travel demand or local events.
- The shortest booking windows occur for stays in May (average 21 days), indicating more last-minute travel plans during this time.
- Seasonally, Winter (64 days avg.) sees the longest lead times, while Spring (34 days avg.) has the shortest, reflecting typical travel planning cycles.
Recommendations for Hosts
- Use the overall average lead time (49 days) as a baseline for your pricing and availability strategy in Paripueira.
- For December stays, consider implementing length-of-stay discounts or slightly higher rates for bookings made less than 82 days out to capitalize on advance planning.
- Target marketing efforts for the Winter season well in advance (at least 64 days) to capture early planners.
- Monitor your own booking lead times against these Paripueira averages to identify opportunities for dynamic pricing adjustments.
Popular & Essential Airbnb Amenities in Paripueira (2026)
Amenity Prevalence
Amenity Insights for Paripueira
- Essential amenities in Paripueira that guests expect include: Kitchen, TV, Wifi. Lacking these (any) could significantly impact bookings.
- Popular amenities like Air conditioning, Free parking on premises, Pool are common but not universal. Offering these can provide a competitive edge.
- A pool is a highly desired but not standard amenity, making it a key feature for attracting guests seeking leisure in Paripueira.
Recommendations for Hosts
- Ensure your listing includes all essential amenities for Paripueira: Kitchen, TV, Wifi.
- Prioritize adding missing essentials: Kitchen, TV, Wifi.
- Consider adding popular differentiators like Air conditioning or Free parking on premises to increase appeal.
- Highlight unique or less common amenities you offer (e.g., hot tub, dedicated workspace, EV charger) in your listing description and photos.
- Regularly check competitor amenities in Paripueira to stay competitive.
Paripueira Airbnb Guest Demographics & Profile Analysis (2026)
Guest Profile Summary for Paripueira
- The typical guest profile for Airbnb in Paripueira consists of primarily domestic travelers (92%), often arriving from nearby Maceió, typically belonging to the Post-2000s (Gen Z/Alpha) group (50%), primarily speaking Portuguese or English.
- Domestic travelers account for 91.6% of guests.
- Key international markets include Brazil (91.6%) and Chile (1.7%).
- Top languages spoken are Portuguese (47%) followed by English (28.7%).
- A significant demographic segment is the Post-2000s (Gen Z/Alpha) group, representing 50% of guests.
Recommendations for Hosts
- Target domestic marketing efforts towards travelers from Maceió and Alagoas.
- Tailor amenities and listing descriptions to appeal to the dominant Post-2000s (Gen Z/Alpha) demographic (e.g., highlight fast WiFi, smart home features, local guides).
- Highlight unique local experiences or amenities relevant to the primary guest profile.
- Consider seasonal promotions aligned with peak travel times for key origin markets.
Nearby Short-Term Rental Market Comparison
How does the Paripueira Airbnb market stack up against its neighbors? Compare key performance metrics like average monthly revenue, ADR, and occupancy rates in surrounding areas to understand the broader regional STR landscape.
| Market | Active Properties | Monthly Revenue | Daily Rate | Avg. Occupancy |
|---|---|---|---|---|
| Passo de Camaragibe | 155 | $2,288 | $323.99 | 30% |
| Sirinhaém | 44 | $1,343 | $225.63 | 25% |
| Porto de Pedras | 434 | $1,180 | $167.35 | 31% |
| Japaratinga | 178 | $895 | $118.94 | 29% |
| Barra de São Miguel | 441 | $875 | $174.19 | 24% |
| Ipojuca | 4,298 | $847 | $118.24 | 35% |
| Tamandaré | 1,255 | $830 | $141.81 | 28% |
| São Miguel dos Milagres | 549 | $801 | $126.23 | 27% |
| Maragogi | 768 | $792 | $120.80 | 29% |
| Maceió | 2,821 | $714 | $69.93 | 42% |