Zwischenwasser Airbnb Market Analysis 2025: Short Term Rental Data & Vacation Rental Statistics in Vorarlberg, Austria
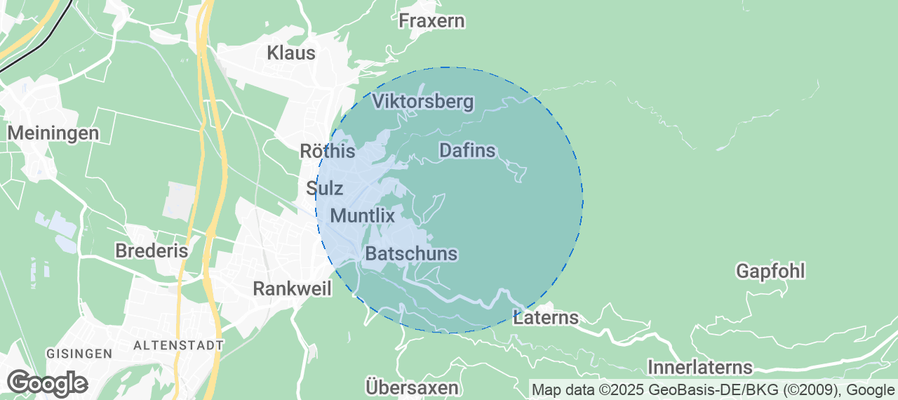
Is Airbnb profitable in Zwischenwasser in 2025? Explore comprehensive Airbnb analytics for Zwischenwasser, Vorarlberg, Austria to uncover income potential. This 2025 STR market report for Zwischenwasser, based on AirROI data from September 2024 to August 2025, reveals key trends in the niche market of 17 active listings.
Whether you're considering an Airbnb investment in Zwischenwasser, optimizing your existing vacation rental, or exploring rental arbitrage opportunities, understanding the Zwischenwasser Airbnb data is crucial. Leveraging the low regulation environment is key to maximizing your short term rental income potential. Let's dive into the specifics.
Key Zwischenwasser Airbnb Performance Metrics Overview
Monthly Airbnb Revenue Variations & Income Potential in Zwischenwasser (2025)
Understanding the monthly revenue variations for Airbnb listings in Zwischenwasser is key to maximizing your short term rental income potential. Seasonality significantly impacts earnings. Our analysis, based on data from the past 12 months, shows that the peak revenue month for STRs in Zwischenwasser is typically August, while November often presents the lowest earnings, highlighting opportunities for strategic pricing adjustments during shoulder and low seasons. Explore the typical Airbnb income in Zwischenwasser across different performance tiers:
- Best-in-class properties (Top 10%) achieve $4,266+ monthly, often utilizing dynamic pricing and superior guest experiences.
- Strong performing properties (Top 25%) earn $2,721 or more, indicating effective management and desirable locations/amenities.
- Typical properties (Median) generate around $1,597 per month, representing the average market performance.
- Entry-level properties (Bottom 25%) see earnings around $1,051, often with potential for optimization.
Average Monthly Airbnb Earnings Trend in Zwischenwasser
Zwischenwasser Airbnb Occupancy Rate Trends (2025)
Maximize your bookings by understanding the Zwischenwasser STR occupancy trends. Seasonal demand shifts significantly influence how often properties are booked. Typically, Octobersees the highest demand (peak season occupancy), while April experiences the lowest (low season). Effective strategies, like adjusting minimum stays or offering promotions, can boost occupancy during slower periods. Here's how different property tiers perform in Zwischenwasser:
- Best-in-class properties (Top 10%) achieve 82%+ occupancy, indicating high desirability and potentially optimized availability.
- Strong performing properties (Top 25%) maintain 69% or higher occupancy, suggesting good market fit and guest satisfaction.
- Typical properties (Median) have an occupancy rate around 50%.
- Entry-level properties (Bottom 25%) average 29% occupancy, potentially facing higher vacancy.
Average Monthly Occupancy Rate Trend in Zwischenwasser
Average Daily Rate (ADR) Airbnb Trends in Zwischenwasser (2025)
Effective short term rental pricing strategy in Zwischenwasser involves understanding monthly ADR fluctuations. The Average Daily Rate (ADR) for Airbnb in Zwischenwasser typically peaks in January and dips lowest during April. Leveraging Airbnb dynamic pricing tools or strategies based on this seasonality can significantly boost revenue. Here's a look at the typical nightly rates achieved:
- Best-in-class properties (Top 10%) command rates of $304+ per night, often due to premium features or locations.
- Strong performing properties (Top 25%) achieve nightly rates of $188 or more.
- Typical properties (Median) charge around $120 per night.
- Entry-level properties (Bottom 25%) earn around $75 per night.
Average Daily Rate (ADR) Trend by Month in Zwischenwasser
Get Live Zwischenwasser Market Intelligence 👇
Explore Real-time Analytics
Airbnb Seasonality Analysis & Trends in Zwischenwasser (2025)
Peak Season (August, July, September)
- Revenue averages $2,733 per month
- Occupancy rates average 62.1%
- Daily rates average $223
Shoulder Season
- Revenue averages $2,110 per month
- Occupancy maintains around 50.6%
- Daily rates hold near $220
Low Season (January, April, November)
- Revenue drops to average $1,507 per month
- Occupancy decreases to average 39.0%
- Daily rates adjust to average $217
Seasonality Insights for Zwischenwasser
- The Airbnb seasonality in Zwischenwasser shows highly seasonal trends requiring careful strategy. While the sections above show seasonal averages, it's also insightful to look at the extremes:
- During the high season, the absolute peak month showcases Zwischenwasser's highest earning potential, with monthly revenues capable of climbing to $3,064, occupancy reaching a high of 67.2%, and ADRs peaking at $227.
- Conversely, the slowest single month of the year, typically falling within the low season, marks the market's lowest point. In this month, revenue might dip to $1,416, occupancy could drop to 37.1%, and ADRs may adjust down to $205.
- Understanding both the seasonal averages and these monthly peaks and troughs in revenue, occupancy, and ADR is crucial for maximizing your Airbnb profit potential in Zwischenwasser.
Seasonal Strategies for Maximizing Profit
- Peak Season: Maximize revenue through premium pricing and potentially longer minimum stays. Ensure high availability.
- Low Season: Offer competitive pricing, special promotions (e.g., extended stay discounts), and flexible cancellation policies. Target off-season travelers like remote workers or budget-conscious guests.
- Shoulder Seasons: Implement dynamic pricing that balances peak and low rates. Target weekend travelers or specific events. Offer slightly more flexible terms than peak season.
- Regularly analyze your own performance against these Zwischenwasser seasonality benchmarks and adjust your pricing and availability strategy accordingly.
Best Areas for Airbnb Investment in Zwischenwasser (2025)
Exploring the top neighborhoods for short-term rentals in Zwischenwasser? This section highlights key areas, outlining why they are attractive for hosts and guests, along with notable local attractions. Consider these locations based on your target guest profile and investment strategy.
| Neighborhood / Area | Why Host Here? (Target Guests & Appeal) | Key Attractions & Landmarks |
|---|---|---|
| Bregenz | The capital of Vorarlberg, Bregenz offers a scenic lakeside location on Lake Constance and is famous for its cultural festivals, beautiful gardens, and the Bregenz Festival, which features opera performances on a floating stage. It's a major tourist destination with high demand for short-term rentals. | Lake Constance, Bregenz Festival, Pfänder Mountain, Kunsthaus Bregenz, The Vorarlberg Museum |
| Feldkirch | A charming medieval town with a rich history, Feldkirch is known for its well-preserved old town, vibrant culture, and proximity to ski resorts. This location attracts both summer and winter tourists. | Feldkirch Castle, Montforthaus Feldkirch, St. Nicholas Cathedral, Wildschönau Valley, Ski resorts nearby |
| Dornbirn | The largest city in Vorarlberg, Dornbirn is an important economic hub with beautiful nature around. It offers a mix of culture and outdoor activities, perfect for hikers and nature lovers, making it ideal for Airbnb hosting. | Karren Mountain, Inatura Nature Museum, Rappenlochschlucht, Dornbirn Market, Bregenz Forest |
| Schwarzach | A picturesque area known for its beautiful landscapes and access to hiking and skiing. Schwarzach is located close to Lake Constance and the surrounding mountains, offering a wide range of outdoor activities. | Lake Constance, Skiing in the Rhine Valley, Hiking trails, Local vineyards, Natural parks |
| Hard | A small town near Bregenz, Hard has a charming lakeside promenade and is known for water sports on Lake Constance. It appeals to tourists looking for lakeside activities and relaxation, making it suitable for short-term rentals. | Lakeside Promenade, Water sports, Bregenz Festival access, Local restaurants, Cycling paths |
| Lustenau | Lustenau is a vibrant town close to the border with Switzerland. Its proximity to both Lake Constance and the Rhine River makes it a popular location for visitors, offering a mix of local culture and outdoor experiences. | Reinach Park, Local markets, Bicycle routes, Cultural events, Proximity to Bregenz |
| Wolfurt | A quiet and picturesque community located on the banks of the Rhine, Wolfurt offers a peaceful environment close to the natural beauty of Vorarlberg. Visitors enjoy the tranquility and the nearby hills for hiking. | Rhine River walks, Nature parks, Local art galleries, Cultural festivals, Scenic viewpoints |
| Bregenz Forest | A scenic region offering breathtaking mountain views and outdoor activities such as hiking, skiing, and biking. The Bregenz Forest attracts both nature lovers and those looking for outdoor adventure, thus presenting a great opportunity for Airbnb investments. | Hiking trails, Ski resorts, Mountain lakes, Local artisan shops, Cultural heritage sites |
Understanding Airbnb License Requirements & STR Laws in Zwischenwasser (2025)
While Zwischenwasser, Vorarlberg, Austria currently shows low STR regulations, specific Airbnb license requirements might still exist or change. Always verify the latest short term rental regulations and Airbnb license requirements directly with local government authorities for Zwischenwasser to ensure full compliance before hosting.
(Source: AirROI data, 2025, finding no licensed listings among those analyzed)
Top Performing Airbnb Properties in Zwischenwasser (2025)
Benchmark your potential! Explore examples of top-performing Airbnb properties in Zwischenwasserbased on Trailing Twelve Month (TTM) revenue. Analyze their characteristics, revenue, occupancy rate, and ADR to understand what drives success in this market.
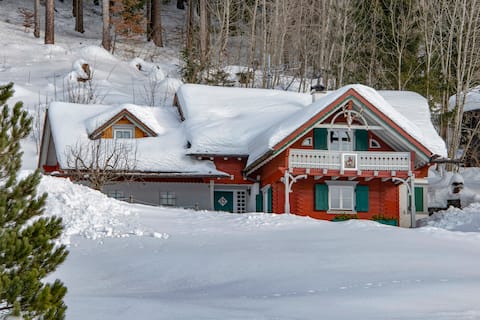
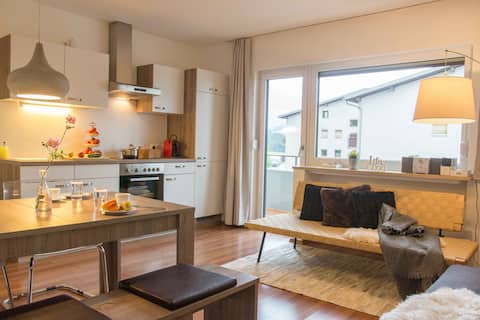
rustic hunting lodge
Entire Place • 3 bedrooms
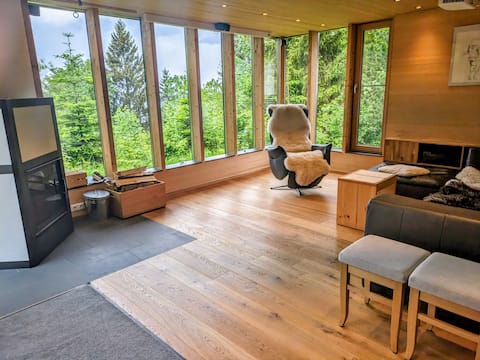
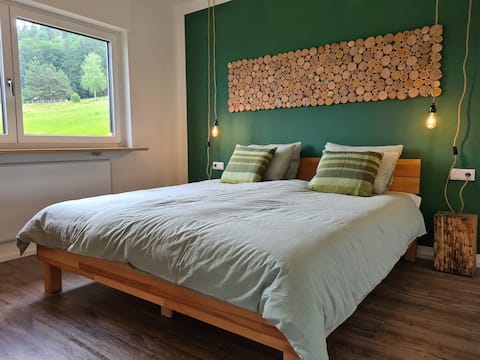
Alpenglühen / Premium / FURX4you
Entire Place • 2 bedrooms
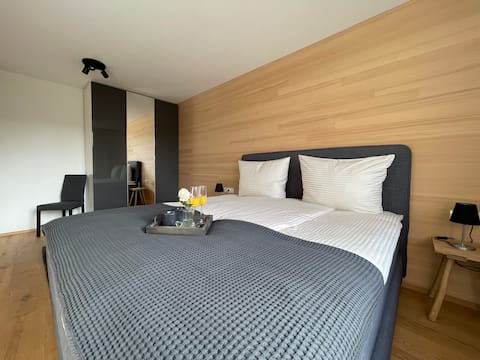
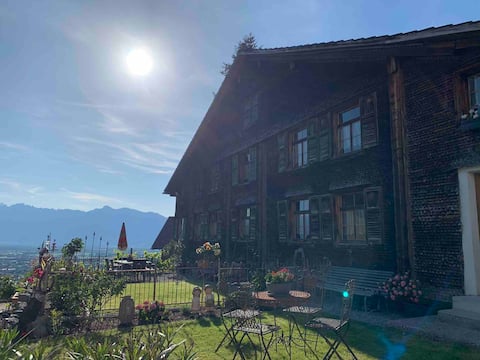
Vacation happiness with a view of the Rhine Valley
Entire Place • 3 bedrooms
hoamelig
Entire Place • 2 bedrooms
birth area
Entire Place • 1 bedroom
Rosina's view of the three countries
Entire Place • 3 bedrooms
Note: Performance varies based on location, size, amenities, seasonality, and management quality. Data reflects the past 12 months.
Top Performing Airbnb Hosts in Zwischenwasser (2025)
Learn from the best! This table showcases top-performing Airbnb hosts in Zwischenwasser based on the number of properties managed and estimated total revenue over the past year. Analyze their scale and performance metrics.
| Host Name | Properties | Grossing Revenue | Stay Reviews | Avg Rating |
|---|---|---|---|---|
| Julia | 1 | $68,338 | 49 | 4.94/5.0 |
| Gerhard | 2 | $67,966 | 272 | 4.99/5.0 |
| Christine | 2 | $47,183 | 125 | 4.78/5.0 |
| Agata | 2 | $33,670 | 42 | 4.57/5.0 |
| Christof Und Angelika | 1 | $27,743 | 34 | 4.97/5.0 |
| Detlef | 2 | $20,338 | 24 | 4.96/5.0 |
| Birgit | 1 | $20,090 | 65 | 4.94/5.0 |
| Madeleine | 1 | $18,777 | 73 | 4.64/5.0 |
| Mathias | 1 | $13,681 | 65 | 4.97/5.0 |
| Marcel | 1 | $8,590 | 7 | 4.57/5.0 |
Analyzing the strategies of top hosts, such as their property selection, pricing, and guest communication, can offer valuable lessons for optimizing your own Airbnb operations in Zwischenwasser.
Dive Deeper: Advanced Zwischenwasser STR Market Data (2025)
Ready to unlock more insights? AirROI provides access to advanced metrics and comprehensive Airbnb data for Zwischenwasser. Explore detailed analytics beyond this report to refine your investment strategy, optimize pricing, and maximize your vacation rental profits.
Explore Advanced MetricsZwischenwasser Short-Term Rental Market Composition (2025): Property & Room Types
Room Type Distribution
Property Type Distribution
Market Composition Insights for Zwischenwasser
- The Zwischenwasser Airbnb market composition is heavily skewed towards Entire Home/Apt listings, which make up 100% of the 17 active rentals. This indicates strong guest preference for privacy and space.
- Looking at the property type distribution in Zwischenwasser, Apartment/Condo properties are the most common (76.5%), reflecting the local real estate landscape.
- Houses represent a significant 23.5% portion, catering likely to families or larger groups.
Zwischenwasser Airbnb Room Capacity Analysis (2025): Bedroom Distribution
Distribution of Listings by Number of Bedrooms
Room Capacity Insights for Zwischenwasser
- The dominant room capacity in Zwischenwasser is 1 bedroom listings, making up 47.1% of the market. This suggests a strong demand for properties suitable for couples or solo travelers.
- Together, 1 bedroom and 2 bedrooms properties represent 82.4% of the active Airbnb listings in Zwischenwasser, indicating a high concentration in these sizes.
Zwischenwasser Vacation Rental Guest Capacity Trends (2025)
Distribution of Listings by Guest Capacity
Guest Capacity Insights for Zwischenwasser
- The most common guest capacity trend in Zwischenwasser vacation rentals is listings accommodating 4 guests (29.4%). This suggests the primary traveler segment is likely small families or groups.
- Properties designed for 4 guests and 2 guests dominate the Zwischenwasser STR market, accounting for 52.9% of listings.
- 23.6% of properties accommodate 6+ guests, serving the market segment for larger families or group travel in Zwischenwasser.
- On average, properties in Zwischenwasser are equipped to host 4.4 guests.
Zwischenwasser Airbnb Booking Patterns (2025): Available vs. Booked Days
Available Days Distribution
Booked Days Distribution
Booking Pattern Insights for Zwischenwasser
- The most common availability pattern in Zwischenwasser falls within the 181-270 days range, representing 35.3% of listings. This suggests many properties have significant open periods on their calendars.
- Approximately 64.7% of listings show high availability (181+ days open annually), indicating potential for increased bookings or specific owner usage patterns.
- For booked days, the 91-180 days range is most frequent in Zwischenwasser (35.3%), reflecting common guest stay durations or potential owner blocking patterns.
- A notable 41.2% of properties secure long booking periods (181+ days booked per year), highlighting successful long-term rental strategies or significant owner usage.
Zwischenwasser Airbnb Minimum Stay Requirements Analysis
Distribution of Listings by Minimum Night Requirement
1 Night
2 listings
11.8% of total
2 Nights
3 listings
17.6% of total
3 Nights
5 listings
29.4% of total
4-6 Nights
1 listings
5.9% of total
7-29 Nights
2 listings
11.8% of total
30+ Nights
4 listings
23.5% of total
Key Insights
- The most prevalent minimum stay requirement in Zwischenwasser is 3 Nights, adopted by 29.4% of listings. This highlights the market's preference for longer commitments.
- A significant segment (23.5%) caters to monthly stays (30+ nights) in Zwischenwasser, pointing to opportunities in the extended-stay market.
Recommendations
- Align with the market by considering a 3 Nights minimum stay, as 29.4% of Zwischenwasser hosts use this setting.
- If feasible, allowing 1-night stays, especially midweek or during low season, could capture last-minute bookings, as only 11.8% currently do.
- Explore offering discounts for stays of 30+ nights to attract the 23.5% of the market seeking extended stays.
- Adjust minimum nights based on seasonality – potentially shorter during low season and longer during peak demand periods in Zwischenwasser.
Zwischenwasser Airbnb Cancellation Policy Trends Analysis (2025)
Flexible
5 listings
29.4% of total
Moderate
4 listings
23.5% of total
Firm
4 listings
23.5% of total
Strict
4 listings
23.5% of total
Cancellation Policy Insights for Zwischenwasser
- The prevailing Airbnb cancellation policy trend in Zwischenwasser is Flexible, used by 29.4% of listings.
- There's a relatively balanced mix between guest-friendly (52.9%) and stricter (47.0%) policies, offering choices for different guest needs.
Recommendations for Hosts
- Consider adopting a Flexible policy to align with the 29.4% market standard in Zwischenwasser.
- Regularly review your cancellation policy against competitors and market demand shifts in Zwischenwasser.
Zwischenwasser STR Booking Lead Time Analysis (2025)
Average Booking Lead Time by Month
Booking Lead Time Insights for Zwischenwasser
- The overall average booking lead time for vacation rentals in Zwischenwasser is 69 days.
- Guests book furthest in advance for stays during December (average 112 days), likely coinciding with peak travel demand or local events.
- The shortest booking windows occur for stays in September (average 33 days), indicating more last-minute travel plans during this time.
- Seasonally, Summer (87 days avg.) sees the longest lead times, while Fall (50 days avg.) has the shortest, reflecting typical travel planning cycles.
Recommendations for Hosts
- Use the overall average lead time (69 days) as a baseline for your pricing and availability strategy in Zwischenwasser.
- For December stays, consider implementing length-of-stay discounts or slightly higher rates for bookings made less than 112 days out to capitalize on advance planning.
- Target marketing efforts for the Summer season well in advance (at least 87 days) to capture early planners.
- Monitor your own booking lead times against these Zwischenwasser averages to identify opportunities for dynamic pricing adjustments.
Popular & Essential Airbnb Amenities in Zwischenwasser (2025)
Amenity Prevalence
Amenity Insights for Zwischenwasser
- Essential amenities in Zwischenwasser that guests expect include: Free parking on premises, Kitchen. Lacking these (any) could significantly impact bookings.
- Popular amenities like Coffee maker, Hot water, Stove are common but not universal. Offering these can provide a competitive edge.
Recommendations for Hosts
- Ensure your listing includes all essential amenities for Zwischenwasser: Free parking on premises, Kitchen.
- Consider adding popular differentiators like Coffee maker or Hot water to increase appeal.
- Highlight unique or less common amenities you offer (e.g., hot tub, dedicated workspace, EV charger) in your listing description and photos.
- Regularly check competitor amenities in Zwischenwasser to stay competitive.
Zwischenwasser Airbnb Guest Demographics & Profile Analysis (2025)
Guest Profile Summary for Zwischenwasser
- The typical guest profile for Airbnb in Zwischenwasser consists of predominantly international visitors (97%), with top international origins including Switzerland, typically belonging to the Post-2000s (Gen Z/Alpha) group (50%), primarily speaking English or German.
- Domestic travelers account for 3.5% of guests.
- Key international markets include Germany (55.3%) and Switzerland (13.2%).
- Top languages spoken are English (38%) followed by German (30%).
- A significant demographic segment is the Post-2000s (Gen Z/Alpha) group, representing 50% of guests.
Recommendations for Hosts
- Focus marketing internationally, particularly towards travelers from Switzerland.
- Tailor amenities and listing descriptions to appeal to the dominant Post-2000s (Gen Z/Alpha) demographic (e.g., highlight fast WiFi, smart home features, local guides).
- Highlight unique local experiences or amenities relevant to the primary guest profile.
- Consider seasonal promotions aligned with peak travel times for key origin markets.
Nearby Short-Term Rental Market Comparison
How does the Zwischenwasser Airbnb market stack up against its neighbors? Compare key performance metrics like average monthly revenue, ADR, and occupancy rates in surrounding areas to understand the broader regional STR landscape.
| Market | Active Properties | Monthly Revenue | Daily Rate | Avg. Occupancy |
|---|---|---|---|---|
| Rothenburg | 11 | $5,709 | $293.66 | 64% |
| Grindelwald | 510 | $5,251 | $378.61 | 56% |
| Balderschwang | 10 | $4,894 | $294.10 | 58% |
| Bassersdorf | 16 | $4,604 | $383.02 | 49% |
| Vitznau | 31 | $4,346 | $414.25 | 47% |
| Brienz (BE) | 160 | $4,231 | $314.86 | 51% |
| Alpnach | 11 | $4,184 | $254.18 | 49% |
| Brand | 63 | $4,028 | $534.79 | 32% |
| Bürserberg | 43 | $3,990 | $337.09 | 42% |
| Lucerne | 339 | $3,934 | $284.83 | 52% |