Wildschönau Airbnb Market Analysis 2026: Short Term Rental Data & Vacation Rental Statistics in Tyrol, Austria
Is Airbnb profitable in Wildschönau in 2026? Explore comprehensive Airbnb analytics for Wildschönau, Tyrol, Austria to uncover income potential. This 2026 STR market report for Wildschönau, based on AirROI data from February 2025 to January 2026, reveals key trends in the niche market of 134 active listings.
Whether you're considering an Airbnb investment in Wildschönau, optimizing your existing vacation rental, or exploring rental arbitrage opportunities, understanding the Wildschönau Airbnb data is crucial. Leveraging the low regulation environment is key to maximizing your short term rental income potential. Let's dive into the specifics.
Key Wildschönau Airbnb Performance Metrics Overview
Monthly Airbnb Revenue Variations & Income Potential in Wildschönau (2026)
Understanding the monthly revenue variations for Airbnb listings in Wildschönau is key to maximizing your short term rental income potential. Seasonality significantly impacts earnings. Our analysis, based on data from the past 12 months, shows that the peak revenue month for STRs in Wildschönau is typically February, while January often presents the lowest earnings, highlighting opportunities for strategic pricing adjustments during shoulder and low seasons. Explore the typical Airbnb income in Wildschönau across different performance tiers:
- Best-in-class properties (Top 10%) achieve $6,627+ monthly, often utilizing dynamic pricing and superior guest experiences.
- Strong performing properties (Top 25%) earn $4,062 or more, indicating effective management and desirable locations/amenities.
- Typical properties (Median) generate around $2,243 per month, representing the average market performance.
- Entry-level properties (Bottom 25%) see earnings around $1,022, often with potential for optimization.
Average Monthly Airbnb Earnings Trend in Wildschönau
Wildschönau Airbnb Occupancy Rate Trends (2026)
Maximize your bookings by understanding the Wildschönau STR occupancy trends. Seasonal demand shifts significantly influence how often properties are booked. Typically, Februarysees the highest demand (peak season occupancy), while January experiences the lowest (low season). Effective strategies, like adjusting minimum stays or offering promotions, can boost occupancy during slower periods. Here's how different property tiers perform in Wildschönau:
- Best-in-class properties (Top 10%) achieve 82%+ occupancy, indicating high desirability and potentially optimized availability.
- Strong performing properties (Top 25%) maintain 59% or higher occupancy, suggesting good market fit and guest satisfaction.
- Typical properties (Median) have an occupancy rate around 36%.
- Entry-level properties (Bottom 25%) average 17% occupancy, potentially facing higher vacancy.
Average Monthly Occupancy Rate Trend in Wildschönau
Average Daily Rate (ADR) Airbnb Trends in Wildschönau (2026)
Effective short term rental pricing strategy in Wildschönau involves understanding monthly ADR fluctuations. The Average Daily Rate (ADR) for Airbnb in Wildschönau typically peaks in February and dips lowest during October. Leveraging Airbnb dynamic pricing tools or strategies based on this seasonality can significantly boost revenue. Here's a look at the typical nightly rates achieved:
- Best-in-class properties (Top 10%) command rates of $534+ per night, often due to premium features or locations.
- Strong performing properties (Top 25%) achieve nightly rates of $351 or more.
- Typical properties (Median) charge around $214 per night.
- Entry-level properties (Bottom 25%) earn around $135 per night.
Average Daily Rate (ADR) Trend by Month in Wildschönau
Get Live Wildschönau Market Intelligence 👇

Explore Real-time Analytics
Airbnb Seasonality Analysis & Trends in Wildschönau (2026)
Peak Season (February, August, July)
- Revenue averages $4,465 per month
- Occupancy rates average 53.7%
- Daily rates average $300
Shoulder Season
- Revenue averages $2,647 per month
- Occupancy maintains around 36.3%
- Daily rates hold near $259
Low Season (January, April, October)
- Revenue drops to average $2,446 per month
- Occupancy decreases to average 33.5%
- Daily rates adjust to average $267
Seasonality Insights for Wildschönau
- The Airbnb seasonality in Wildschönau shows highly seasonal trends requiring careful strategy. While the sections above show seasonal averages, it's also insightful to look at the extremes:
- During the high season, the absolute peak month showcases Wildschönau's highest earning potential, with monthly revenues capable of climbing to $5,152, occupancy reaching a high of 61.0%, and ADRs peaking at $325.
- Conversely, the slowest single month of the year, typically falling within the low season, marks the market's lowest point. In this month, revenue might dip to $2,417, occupancy could drop to 28.6%, and ADRs may adjust down to $238.
- Understanding both the seasonal averages and these monthly peaks and troughs in revenue, occupancy, and ADR is crucial for maximizing your Airbnb profit potential in Wildschönau.
Seasonal Strategies for Maximizing Profit
- Peak Season: Maximize revenue through premium pricing and potentially longer minimum stays. Ensure high availability.
- Low Season: Offer competitive pricing, special promotions (e.g., extended stay discounts), and flexible cancellation policies. Target off-season travelers like remote workers or budget-conscious guests.
- Shoulder Seasons: Implement dynamic pricing that balances peak and low rates. Target weekend travelers or specific events. Offer slightly more flexible terms than peak season.
- Regularly analyze your own performance against these Wildschönau seasonality benchmarks and adjust your pricing and availability strategy accordingly.
Best Areas for Airbnb Investment in Wildschönau (2026)
Exploring the top neighborhoods for short-term rentals in Wildschönau? This section highlights key areas, outlining why they are attractive for hosts and guests, along with notable local attractions. Consider these locations based on your target guest profile and investment strategy.
| Neighborhood / Area | Why Host Here? (Target Guests & Appeal) | Key Attractions & Landmarks |
|---|---|---|
| Mühlbach | Mühlbach is a charming village known for its ski resort and beautiful hiking trails. It's an attractive destination for skiing enthusiasts in winter and nature lovers in summer. | Skijuwel Alpbachtal Wildschönau, Weller Brachtal, Mühlbach Ski Area, Hiking trails to Schatzberg, Wildschönau Valley Museum |
| Oberau | Oberau offers a blend of traditional Tyrolean culture and stunning mountain views, making it a peaceful escape for families and couples alike. It has access to hiking and ski routes as well. | Alpbachtal Ski Resort, Hiking to the Zinsberg, Wildschönau Flora and Fauna, Tyrolean evening with traditional music |
| Niederau | Niederau is a popular destination for families and offers easy access to ski slopes, making it ideal for both winter sports and summer hiking. | Skiing at Wildschönau, Aquatic Centre in Niederau, Niederauer Dorfstraße, Mountain biking trails, Children's ski school |
| Thierbach | Thierbach is a picturesque hamlet that provides a more secluded and tranquil experience, appealing to those looking to relax in nature away from the crowds. | Hiking trails to Schatzberg and Gernstein, Local guesthouses, Traditional Tyrolean architecture, Panoramic views of the valley |
| Alpbach | Although slightly outside Wildschönau, Alpbach is known as the most beautiful village in Austria and offers stunning scenery and cultural experiences, attracting many tourists. | Alpbach's wooden houses, Conference center, Local hiking and biking trails, Alpbach skiing areas |
| Kramsach | Known for its scenic lakes and the nearby historic village, Kramsach is popular in both winter and summer for various outdoor activities and cultural experiences. | Krummsee and Reintaler See, Museum of Historical Farmhouses, Hiking and mountain biking trails |
| Wiesing | Wiesing is a small village that sits near the Zillertal and offers a cozy atmosphere for an off-the-beaten-path experience with access to nearby attractions. | Hiking to the Zillertal mountains, Local restaurants, Zillertal Arena skiing |
| Schatzberg | The Schatzberg area is known for its exceptional skiing and mountain biking opportunities, beloved by adventure-seekers and nature lovers. | Schatzberg ski area, Hiking trails leading to the summit, Beautiful alpine scenery |
Understanding Airbnb License Requirements & STR Laws in Wildschönau (2026)
While Wildschönau, Tyrol, Austria currently shows low STR regulations, specific Airbnb license requirements might still exist or change. Always verify the latest short term rental regulations and Airbnb license requirements directly with local government authorities for Wildschönau to ensure full compliance before hosting.
(Source: AirROI data, 2026, finding no licensed listings among those analyzed)
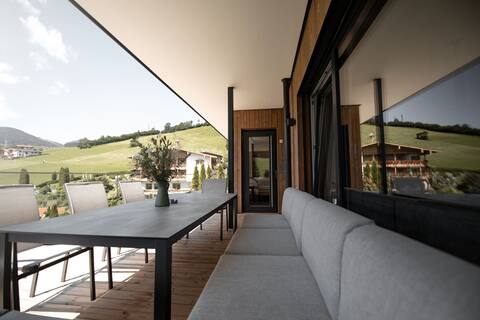
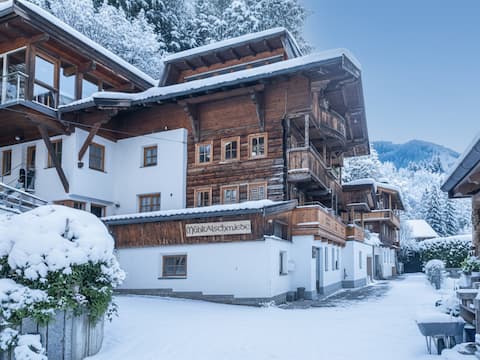
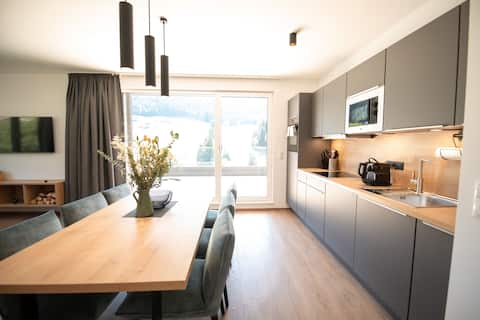
Top Performing Airbnb Properties in Wildschönau (2026)
Benchmark your potential! Explore examples of top-performing Airbnb properties in Wildschönaubased on Trailing Twelve Month (TTM) revenue. Analyze their characteristics, revenue, occupancy rate, and ADR to understand what drives success in this market.
Premium Royal Suite with sauna
Entire Place • 4 bedrooms

Haus Montenido
Entire Place • 6 bedrooms
Rustic apartment, only 100m to the ski bus
Entire Place • 3 bedrooms

Quaint farmhouse Eighteen53
Entire Place • 4 bedrooms

Fantastic holiday home in a secluded location
Entire Place • 4 bedrooms
Premium Superior Suite
Entire Place • 2 bedrooms
Note: Performance varies based on location, size, amenities, seasonality, and management quality. Data reflects the past 12 months.
Top Performing Airbnb Hosts in Wildschönau (2026)
Learn from the best! This table showcases top-performing Airbnb hosts in Wildschönau based on the number of properties managed and estimated total revenue over the past year. Analyze their scale and performance metrics.
| Host Name | Properties | Grossing Revenue | Stay Reviews | Avg Rating |
|---|---|---|---|---|
| Inncomer Apartments GmbH - Das | 13 | $655,872 | 1131 | 4.91/5.0 |
| Sybrand | 21 | $574,947 | 141 | 4.82/5.0 |
| Alice - Interhome | 13 | $311,155 | 265 | 4.83/5.0 |
| Kirsten | 3 | $204,104 | 158 | 4.92/5.0 |
| Heinz-Werner Frank | 15 | $163,828 | 56 | 4.76/5.0 |
| Nadine - Interhome | 4 | $143,973 | 50 | 4.92/5.0 |
| Chantal Villa For You | 5 | $118,174 | 18 | 4.57/5.0 |
| Minna | 1 | $113,820 | 34 | 4.71/5.0 |
| Holidu | 5 | $100,857 | 34 | 4.41/5.0 |
| Kirsten | 2 | $80,023 | 159 | 4.84/5.0 |
Analyzing the strategies of top hosts, such as their property selection, pricing, and guest communication, can offer valuable lessons for optimizing your own Airbnb operations in Wildschönau.
Dive Deeper: Advanced Wildschönau STR Market Data (2026)
Ready to unlock more insights? AirROI provides access to advanced metrics and comprehensive Airbnb data for Wildschönau. Explore detailed analytics beyond this report to refine your investment strategy, optimize pricing, and maximize your vacation rental profits.
Explore Advanced MetricsWildschönau Short-Term Rental Market Composition (2026): Property & Room Types
Room Type Distribution
Property Type Distribution
Market Composition Insights for Wildschönau
- The Wildschönau Airbnb market composition is heavily skewed towards Entire Home/Apt listings, which make up 94.8% of the 134 active rentals. This indicates strong guest preference for privacy and space.
- Looking at the property type distribution in Wildschönau, Apartment/Condo properties are the most common (72.4%), reflecting the local real estate landscape.
- Houses represent a significant 21.6% portion, catering likely to families or larger groups.
- Smaller segments like outdoor/unique, unique stays, hotel/boutique (combined 5.9%) offer potential for unique stay experiences.
Wildschönau Airbnb Room Capacity Analysis (2026): Bedroom Distribution
Distribution of Listings by Number of Bedrooms
Room Capacity Insights for Wildschönau
- The dominant room capacity in Wildschönau is 1 bedroom listings, making up 36.6% of the market. This suggests a strong demand for properties suitable for couples or solo travelers.
- Together, 1 bedroom and 2 bedrooms properties represent 63.5% of the active Airbnb listings in Wildschönau, indicating a high concentration in these sizes.
- A significant 30.6% of listings offer 3+ bedrooms, catering to larger groups and families seeking more space in Wildschönau.
Wildschönau Vacation Rental Guest Capacity Trends (2026)
Distribution of Listings by Guest Capacity
Guest Capacity Insights for Wildschönau
- The most common guest capacity trend in Wildschönau vacation rentals is listings accommodating 6 guests (25.4%). This suggests the primary traveler segment is likely larger groups.
- Properties designed for 6 guests and 4 guests dominate the Wildschönau STR market, accounting for 49.3% of listings.
- 47.0% of properties accommodate 6+ guests, serving the market segment for larger families or group travel in Wildschönau.
- On average, properties in Wildschönau are equipped to host 5.1 guests.
Wildschönau Airbnb Booking Patterns (2026): Available vs. Booked Days
Available Days Distribution
Booked Days Distribution
Booking Pattern Insights for Wildschönau
- The most common availability pattern in Wildschönau falls within the 271-366 days range, representing 57.5% of listings. This suggests many properties have significant open periods on their calendars.
- Approximately 80.6% of listings show high availability (181+ days open annually), indicating potential for increased bookings or specific owner usage patterns.
- For booked days, the 31-90 days range is most frequent in Wildschönau (38.8%), reflecting common guest stay durations or potential owner blocking patterns.
- A notable 20.9% of properties secure long booking periods (181+ days booked per year), highlighting successful long-term rental strategies or significant owner usage.
Wildschönau Airbnb Minimum Stay Requirements Analysis
Distribution of Listings by Minimum Night Requirement
1 Night
34 listings
25.4% of total
2 Nights
30 listings
22.4% of total
3 Nights
7 listings
5.2% of total
4-6 Nights
11 listings
8.2% of total
7-29 Nights
1 listings
0.7% of total
30+ Nights
51 listings
38.1% of total
Key Insights
- The most prevalent minimum stay requirement in Wildschönau is 30+ Nights, adopted by 38.1% of listings. This highlights the market's preference for longer commitments.
- A significant segment (38.1%) caters to monthly stays (30+ nights) in Wildschönau, pointing to opportunities in the extended-stay market.
Recommendations
- Align with the market by considering a 30+ Nights minimum stay, as 38.1% of Wildschönau hosts use this setting.
- If feasible, allowing 1-night stays, especially midweek or during low season, could capture last-minute bookings, as only 25.4% currently do.
- Explore offering discounts for stays of 30+ nights to attract the 38.1% of the market seeking extended stays.
- Adjust minimum nights based on seasonality – potentially shorter during low season and longer during peak demand periods in Wildschönau.
Wildschönau Airbnb Cancellation Policy Trends Analysis (2026)
Super Strict 60 Days
3 listings
2.2% of total
Super Strict 30 Days
41 listings
30.6% of total
Limited
1 listings
0.7% of total
Flexible
3 listings
2.2% of total
Moderate
17 listings
12.7% of total
Firm
64 listings
47.8% of total
Strict
5 listings
3.7% of total
Cancellation Policy Insights for Wildschönau
- The prevailing Airbnb cancellation policy trend in Wildschönau is Firm, used by 47.8% of listings.
- A majority (51.5%) of hosts in Wildschönau utilize Firm or Strict policies, indicating a market where hosts prioritize booking security.
- Strict cancellation policies are quite rare (3.7%), potentially making listings with this policy less competitive unless justified by high demand or property type.
Recommendations for Hosts
- Consider adopting a Firm policy to align with the 47.8% market standard in Wildschönau.
- Using a Strict policy might deter some guests, as only 3.7% of listings use it. Evaluate if potential revenue protection outweighs possible lower booking rates.
- Regularly review your cancellation policy against competitors and market demand shifts in Wildschönau.
Wildschönau STR Booking Lead Time Analysis (2026)
Average Booking Lead Time by Month
Booking Lead Time Insights for Wildschönau
- The overall average booking lead time for vacation rentals in Wildschönau is 96 days.
- Guests book furthest in advance for stays during November (average 138 days), likely coinciding with peak travel demand or local events.
- The shortest booking windows occur for stays in October (average 64 days), indicating more last-minute travel plans during this time.
- Seasonally, Winter (125 days avg.) sees the longest lead times, while Spring (73 days avg.) has the shortest, reflecting typical travel planning cycles.
Recommendations for Hosts
- Use the overall average lead time (96 days) as a baseline for your pricing and availability strategy in Wildschönau.
- For November stays, consider implementing length-of-stay discounts or slightly higher rates for bookings made less than 138 days out to capitalize on advance planning.
- Target marketing efforts for the Winter season well in advance (at least 125 days) to capture early planners.
- Monitor your own booking lead times against these Wildschönau averages to identify opportunities for dynamic pricing adjustments.
Popular & Essential Airbnb Amenities in Wildschönau (2026)
Amenity Prevalence
Amenity Insights for Wildschönau
- Popular amenities like Kitchen, Heating, Wifi are common but not universal. Offering these can provide a competitive edge.
- Warning: Wifi is not universally provided but is considered essential globally. Ensure reliable Wifi is offered.
Recommendations for Hosts
- Consider adding popular differentiators like Kitchen or Heating to increase appeal.
- Highlight unique or less common amenities you offer (e.g., hot tub, dedicated workspace, EV charger) in your listing description and photos.
- Regularly check competitor amenities in Wildschönau to stay competitive.
Wildschönau Airbnb Guest Demographics & Profile Analysis (2026)
Guest Profile Summary for Wildschönau
- The typical guest profile for Airbnb in Wildschönau consists of predominantly international visitors (98%), with top international origins including Netherlands, typically belonging to the Post-2000s (Gen Z/Alpha) group (50%), primarily speaking English or German.
- Domestic travelers account for 2.0% of guests.
- Key international markets include Germany (55.4%) and Netherlands (7.4%).
- Top languages spoken are English (40.8%) followed by German (28.2%).
- A significant demographic segment is the Post-2000s (Gen Z/Alpha) group, representing 50% of guests.
Recommendations for Hosts
- Focus marketing internationally, particularly towards travelers from Netherlands.
- Tailor amenities and listing descriptions to appeal to the dominant Post-2000s (Gen Z/Alpha) demographic (e.g., highlight fast WiFi, smart home features, local guides).
- Highlight unique local experiences or amenities relevant to the primary guest profile.
- Consider seasonal promotions aligned with peak travel times for key origin markets.
Nearby Short-Term Rental Market Comparison
How does the Wildschönau Airbnb market stack up against its neighbors? Compare key performance metrics like average monthly revenue, ADR, and occupancy rates in surrounding areas to understand the broader regional STR landscape.
| Market | Active Properties | Monthly Revenue | Daily Rate | Avg. Occupancy |
|---|---|---|---|---|
| Scheffau am Wilden Kaiser | 12 | $6,669 | $906.83 | 30% |
| Sankt Pankraz - San Pancrazio | 12 | $6,528 | $633.65 | 29% |
| Urtijëi - St. Ulrich in Gröden - Ortisei | 172 | $5,054 | $718.33 | 41% |
| Hallstatt | 31 | $4,918 | $293.92 | 62% |
| Kiens - Chienes | 17 | $3,715 | $377.77 | 48% |
| Cortina d'Ampezzo | 309 | $3,646 | $474.12 | 40% |
| Going am Wilden Kaiser | 27 | $3,596 | $406.50 | 37% |
| Kramsach | 12 | $3,573 | $272.32 | 48% |
| Bayrischzell | 41 | $3,550 | $389.91 | 33% |
| Krimml | 53 | $3,544 | $359.14 | 41% |