Zeltweg Airbnb Market Analysis 2026: Short Term Rental Data & Vacation Rental Statistics in Styria, Austria
Is Airbnb profitable in Zeltweg in 2026? Explore comprehensive Airbnb analytics for Zeltweg, Styria, Austria to uncover income potential. This 2026 STR market report for Zeltweg, based on AirROI data from February 2025 to January 2026, reveals key trends in the niche market of 34 active listings.
Whether you're considering an Airbnb investment in Zeltweg, optimizing your existing vacation rental, or exploring rental arbitrage opportunities, understanding the Zeltweg Airbnb data is crucial. Leveraging the low regulation environment is key to maximizing your short term rental income potential. Let's dive into the specifics.
Key Zeltweg Airbnb Performance Metrics Overview
Monthly Airbnb Revenue Variations & Income Potential in Zeltweg (2026)
Understanding the monthly revenue variations for Airbnb listings in Zeltweg is key to maximizing your short term rental income potential. Seasonality significantly impacts earnings. Our analysis, based on data from the past 12 months, shows that the peak revenue month for STRs in Zeltweg is typically July, while April often presents the lowest earnings, highlighting opportunities for strategic pricing adjustments during shoulder and low seasons. Explore the typical Airbnb income in Zeltweg across different performance tiers:
- Best-in-class properties (Top 10%) achieve $5,954+ monthly, often utilizing dynamic pricing and superior guest experiences.
- Strong performing properties (Top 25%) earn $2,745 or more, indicating effective management and desirable locations/amenities.
- Typical properties (Median) generate around $1,340 per month, representing the average market performance.
- Entry-level properties (Bottom 25%) see earnings around $740, often with potential for optimization.
Average Monthly Airbnb Earnings Trend in Zeltweg
Zeltweg Airbnb Occupancy Rate Trends (2026)
Maximize your bookings by understanding the Zeltweg STR occupancy trends. Seasonal demand shifts significantly influence how often properties are booked. Typically, Marchsees the highest demand (peak season occupancy), while April experiences the lowest (low season). Effective strategies, like adjusting minimum stays or offering promotions, can boost occupancy during slower periods. Here's how different property tiers perform in Zeltweg:
- Best-in-class properties (Top 10%) achieve 67%+ occupancy, indicating high desirability and potentially optimized availability.
- Strong performing properties (Top 25%) maintain 50% or higher occupancy, suggesting good market fit and guest satisfaction.
- Typical properties (Median) have an occupancy rate around 30%.
- Entry-level properties (Bottom 25%) average 17% occupancy, potentially facing higher vacancy.
Average Monthly Occupancy Rate Trend in Zeltweg
Average Daily Rate (ADR) Airbnb Trends in Zeltweg (2026)
Effective short term rental pricing strategy in Zeltweg involves understanding monthly ADR fluctuations. The Average Daily Rate (ADR) for Airbnb in Zeltweg typically peaks in October and dips lowest during April. Leveraging Airbnb dynamic pricing tools or strategies based on this seasonality can significantly boost revenue. Here's a look at the typical nightly rates achieved:
- Best-in-class properties (Top 10%) command rates of $501+ per night, often due to premium features or locations.
- Strong performing properties (Top 25%) achieve nightly rates of $313 or more.
- Typical properties (Median) charge around $180 per night.
- Entry-level properties (Bottom 25%) earn around $78 per night.
Average Daily Rate (ADR) Trend by Month in Zeltweg
Get Live Zeltweg Market Intelligence 👇

Explore Real-time Analytics
Airbnb Seasonality Analysis & Trends in Zeltweg (2026)
Peak Season (July, December, September)
- Revenue averages $3,471 per month
- Occupancy rates average 41.9%
- Daily rates average $237
Shoulder Season
- Revenue averages $2,209 per month
- Occupancy maintains around 31.8%
- Daily rates hold near $245
Low Season (February, March, April)
- Revenue drops to average $1,186 per month
- Occupancy decreases to average 40.2%
- Daily rates adjust to average $218
Seasonality Insights for Zeltweg
- The Airbnb seasonality in Zeltweg shows highly seasonal trends requiring careful strategy. While the sections above show seasonal averages, it's also insightful to look at the extremes:
- During the high season, the absolute peak month showcases Zeltweg's highest earning potential, with monthly revenues capable of climbing to $4,107, occupancy reaching a high of 57.0%, and ADRs peaking at $254.
- Conversely, the slowest single month of the year, typically falling within the low season, marks the market's lowest point. In this month, revenue might dip to $625, occupancy could drop to 21.7%, and ADRs may adjust down to $215.
- Understanding both the seasonal averages and these monthly peaks and troughs in revenue, occupancy, and ADR is crucial for maximizing your Airbnb profit potential in Zeltweg.
Seasonal Strategies for Maximizing Profit
- Peak Season: Maximize revenue through premium pricing and potentially longer minimum stays. Ensure high availability.
- Low Season: Offer competitive pricing, special promotions (e.g., extended stay discounts), and flexible cancellation policies. Target off-season travelers like remote workers or budget-conscious guests.
- Shoulder Seasons: Implement dynamic pricing that balances peak and low rates. Target weekend travelers or specific events. Offer slightly more flexible terms than peak season.
- Regularly analyze your own performance against these Zeltweg seasonality benchmarks and adjust your pricing and availability strategy accordingly.
Best Areas for Airbnb Investment in Zeltweg (2026)
Exploring the top neighborhoods for short-term rentals in Zeltweg? This section highlights key areas, outlining why they are attractive for hosts and guests, along with notable local attractions. Consider these locations based on your target guest profile and investment strategy.
| Neighborhood / Area | Why Host Here? (Target Guests & Appeal) | Key Attractions & Landmarks |
|---|---|---|
| Zeltweg City Center | The heart of Zeltweg, offering easy access to local restaurants, shops, and cultural sites. It's a prime location for visitors wanting to experience the local charm and amenities. | Zeltweg Town Square, Local Restaurants, Surrounding Parks, Cultural Events |
| Red Bull Ring Area | Popular for motorsport fans, especially during racing events. Properties here can attract visitors from across the globe throughout the racing season. | Red Bull Ring, Motor Sports Museum, Racing Events, Auto Shows |
| Nearby Historic Towns | Zeltweg is close to historically rich towns like Judenburg and Knittelfeld, which attract visitors interested in history and culture. | Judenburg Castle, Knittelfeld Heritage Sites, Local Museums, Architecture Tours |
| Nature Reserves | The scenic surroundings around Zeltweg offer hiking and outdoor activities, appealing to nature lovers and adventure seekers. | Hohe Tauern National Park, Hiking Trails, Scenic Views, Outdoor Sports |
| Cultural Festivals | Zeltweg hosts various cultural and seasonal festivals that attract tourists, making it a vibrant place for short-term rentals during certain times of the year. | Cultural Festivals, Music Events, Local Fairs, Food Festivals |
| Spa and Wellness Centers | With a focus on health and wellness, Zeltweg's spa facilities attract tourists seeking relaxation and rejuvenation. | Thermal Spas, Wellness Retreats, Health Resorts, Yoga Centers |
| Local Attractions | Offering unique local attractions including small museums and art galleries, this area is appealing for those interested in art and local culture. | Local Art Galleries, Museums, Cultural Workshops |
| Outdoor Sports Venues | Zeltweg is known for its outdoor sports facilities, attracting sports enthusiasts throughout the year, especially for skiing and hiking. | Ski Resorts, Hiking Trails, Biking Paths, Sports Clubs |
Understanding Airbnb License Requirements & STR Laws in Zeltweg (2026)
While Zeltweg, Styria, Austria currently shows low STR regulations, specific Airbnb license requirements might still exist or change. Always verify the latest short term rental regulations and Airbnb license requirements directly with local government authorities for Zeltweg to ensure full compliance before hosting.
(Source: AirROI data, 2026, finding no licensed listings among those analyzed)
Top Performing Airbnb Properties in Zeltweg (2026)
Benchmark your potential! Explore examples of top-performing Airbnb properties in Zeltwegbased on Trailing Twelve Month (TTM) revenue. Analyze their characteristics, revenue, occupancy rate, and ADR to understand what drives success in this market.

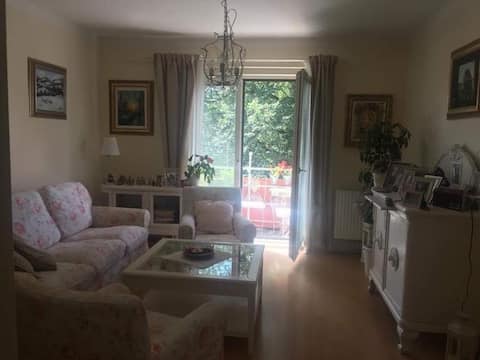
Entire home near RedBull Circuit & train station
Entire Place • 2 bedrooms
House near Red Bull Ring
Entire Place • 3 bedrooms
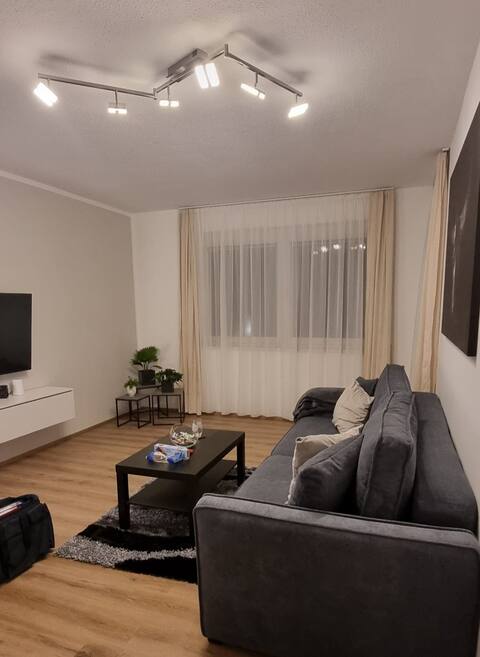
Apartment Zeltweg
Entire Place • 1 bedroom
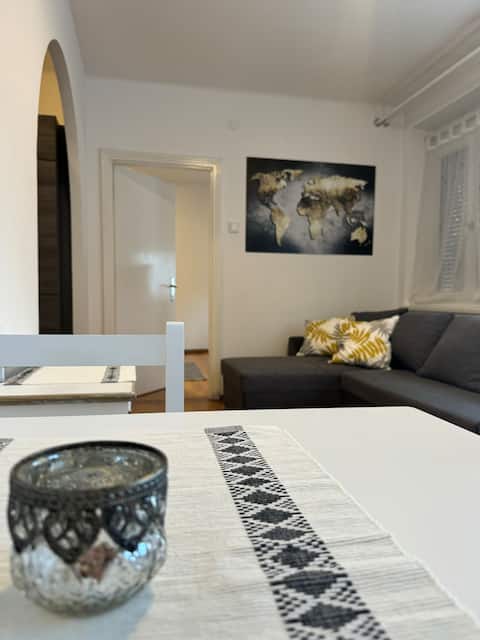
Apartment near RedBull Ring
Entire Place • 2 bedrooms
Apartment near RedBull Circuit & train station
Entire Place • 1 bedroom
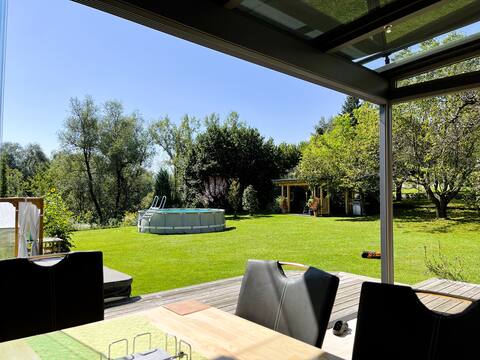
Garden cabin with pool, C toilet, shower & carport
Entire Place • 1 bedroom
Note: Performance varies based on location, size, amenities, seasonality, and management quality. Data reflects the past 12 months.
Top Performing Airbnb Hosts in Zeltweg (2026)
Learn from the best! This table showcases top-performing Airbnb hosts in Zeltweg based on the number of properties managed and estimated total revenue over the past year. Analyze their scale and performance metrics.
| Host Name | Properties | Grossing Revenue | Stay Reviews | Avg Rating |
|---|---|---|---|---|
| Kevin | 2 | $63,978 | 91 | 4.89/5.0 |
| Karola Mit Isidoro | 4 | $43,389 | 106 | 4.96/5.0 |
| Dominik | 5 | $40,503 | 88 | 4.85/5.0 |
| Alexandra | 1 | $39,337 | 1 | Not Rated |
| Claudia | 1 | $37,248 | 2 | Not Rated |
| Filip | 1 | $33,654 | 3 | 5.00/5.0 |
| Michael | 1 | $20,259 | 2 | Not Rated |
| Georg | 1 | $18,090 | 13 | 5.00/5.0 |
| Klemens | 1 | $17,271 | 2 | Not Rated |
| Jan | 1 | $12,055 | 4 | 5.00/5.0 |
Analyzing the strategies of top hosts, such as their property selection, pricing, and guest communication, can offer valuable lessons for optimizing your own Airbnb operations in Zeltweg.
Dive Deeper: Advanced Zeltweg STR Market Data (2026)
Ready to unlock more insights? AirROI provides access to advanced metrics and comprehensive Airbnb data for Zeltweg. Explore detailed analytics beyond this report to refine your investment strategy, optimize pricing, and maximize your vacation rental profits.
Explore Advanced MetricsZeltweg Short-Term Rental Market Composition (2026): Property & Room Types
Room Type Distribution
Property Type Distribution
Market Composition Insights for Zeltweg
- The Zeltweg Airbnb market composition is heavily skewed towards Entire Home/Apt listings, which make up 82.4% of the 34 active rentals. This indicates strong guest preference for privacy and space.
- Looking at the property type distribution in Zeltweg, Apartment/Condo properties are the most common (47.1%), reflecting the local real estate landscape.
- The presence of 17.6% Hotel/Boutique listings indicates integration with traditional hospitality.
Zeltweg Airbnb Room Capacity Analysis (2026): Bedroom Distribution
Distribution of Listings by Number of Bedrooms
Room Capacity Insights for Zeltweg
- The dominant room capacity in Zeltweg is 1 bedroom listings, making up 29.4% of the market. This suggests a strong demand for properties suitable for couples or solo travelers.
- Together, 1 bedroom and 2 bedrooms properties represent 58.8% of the active Airbnb listings in Zeltweg, indicating a high concentration in these sizes.
Zeltweg Vacation Rental Guest Capacity Trends (2026)
Distribution of Listings by Guest Capacity
Guest Capacity Insights for Zeltweg
- The most common guest capacity trend in Zeltweg vacation rentals is listings accommodating 4 guests (44.1%). This suggests the primary traveler segment is likely small families or groups.
- Properties designed for 4 guests and 2 guests dominate the Zeltweg STR market, accounting for 73.5% of listings.
- On average, properties in Zeltweg are equipped to host 3.3 guests.
Zeltweg Airbnb Booking Patterns (2026): Available vs. Booked Days
Available Days Distribution
Booked Days Distribution
Booking Pattern Insights for Zeltweg
- The most common availability pattern in Zeltweg falls within the 271-366 days range, representing 91.2% of listings. This suggests many properties have significant open periods on their calendars.
- Approximately 97.1% of listings show high availability (181+ days open annually), indicating potential for increased bookings or specific owner usage patterns.
- For booked days, the 1-30 days range is most frequent in Zeltweg (47.1%), reflecting common guest stay durations or potential owner blocking patterns.
- A notable 2.9% of properties secure long booking periods (181+ days booked per year), highlighting successful long-term rental strategies or significant owner usage.
Zeltweg Airbnb Minimum Stay Requirements Analysis
Distribution of Listings by Minimum Night Requirement
1 Night
6 listings
17.6% of total
2 Nights
10 listings
29.4% of total
3 Nights
2 listings
5.9% of total
30+ Nights
16 listings
47.1% of total
Key Insights
- The most prevalent minimum stay requirement in Zeltweg is 30+ Nights, adopted by 47.1% of listings. This highlights the market's preference for longer commitments.
- A significant segment (47.1%) caters to monthly stays (30+ nights) in Zeltweg, pointing to opportunities in the extended-stay market.
Recommendations
- Align with the market by considering a 30+ Nights minimum stay, as 47.1% of Zeltweg hosts use this setting.
- If feasible, allowing 1-night stays, especially midweek or during low season, could capture last-minute bookings, as only 17.6% currently do.
- Explore offering discounts for stays of 30+ nights to attract the 47.1% of the market seeking extended stays.
- Adjust minimum nights based on seasonality – potentially shorter during low season and longer during peak demand periods in Zeltweg.
Zeltweg Airbnb Cancellation Policy Trends Analysis (2026)
Flexible
8 listings
23.5% of total
Moderate
1 listings
2.9% of total
Firm
17 listings
50% of total
Strict
8 listings
23.5% of total
Cancellation Policy Insights for Zeltweg
- The prevailing Airbnb cancellation policy trend in Zeltweg is Firm, used by 50% of listings.
- A majority (73.5%) of hosts in Zeltweg utilize Firm or Strict policies, indicating a market where hosts prioritize booking security.
Recommendations for Hosts
- Consider adopting a Firm policy to align with the 50% market standard in Zeltweg.
- Regularly review your cancellation policy against competitors and market demand shifts in Zeltweg.
Zeltweg STR Booking Lead Time Analysis (2026)
Average Booking Lead Time by Month
Booking Lead Time Insights for Zeltweg
- The overall average booking lead time for vacation rentals in Zeltweg is 107 days.
- Guests book furthest in advance for stays during June (average 157 days), likely coinciding with peak travel demand or local events.
- The shortest booking windows occur for stays in November (average 2 days), indicating more last-minute travel plans during this time.
- Seasonally, Summer (99 days avg.) sees the longest lead times, while Winter (8 days avg.) has the shortest, reflecting typical travel planning cycles.
Recommendations for Hosts
- Use the overall average lead time (107 days) as a baseline for your pricing and availability strategy in Zeltweg.
- For June stays, consider implementing length-of-stay discounts or slightly higher rates for bookings made less than 157 days out to capitalize on advance planning.
- During November, focus on last-minute booking availability and promotions, as guests book with very short notice (2 days avg.).
- Target marketing efforts for the Summer season well in advance (at least 99 days) to capture early planners.
- Monitor your own booking lead times against these Zeltweg averages to identify opportunities for dynamic pricing adjustments.
Popular & Essential Airbnb Amenities in Zeltweg (2026)
Amenity Prevalence
Amenity Insights for Zeltweg
- Popular amenities like Free parking on premises, Hot water, Wifi are common but not universal. Offering these can provide a competitive edge.
- Warning: Wifi is not universally provided but is considered essential globally. Ensure reliable Wifi is offered.
Recommendations for Hosts
- Consider adding popular differentiators like Free parking on premises or Hot water to increase appeal.
- Highlight unique or less common amenities you offer (e.g., hot tub, dedicated workspace, EV charger) in your listing description and photos.
- Regularly check competitor amenities in Zeltweg to stay competitive.
Zeltweg Airbnb Guest Demographics & Profile Analysis (2026)
Guest Profile Summary for Zeltweg
- The typical guest profile for Airbnb in Zeltweg consists of predominantly international visitors (83%), with top international origins including Austria, typically belonging to the Post-2000s (Gen Z/Alpha) group (50%), primarily speaking English or German.
- Domestic travelers account for 17.1% of guests.
- Key international markets include Germany (18.6%) and Austria (17.1%).
- Top languages spoken are English (41.9%) followed by German (15.1%).
- A significant demographic segment is the Post-2000s (Gen Z/Alpha) group, representing 50% of guests.
Recommendations for Hosts
- Focus marketing internationally, particularly towards travelers from Austria.
- Tailor amenities and listing descriptions to appeal to the dominant Post-2000s (Gen Z/Alpha) demographic (e.g., highlight fast WiFi, smart home features, local guides).
- Highlight unique local experiences or amenities relevant to the primary guest profile.
- Consider seasonal promotions aligned with peak travel times for key origin markets.
Nearby Short-Term Rental Market Comparison
How does the Zeltweg Airbnb market stack up against its neighbors? Compare key performance metrics like average monthly revenue, ADR, and occupancy rates in surrounding areas to understand the broader regional STR landscape.
| Market | Active Properties | Monthly Revenue | Daily Rate | Avg. Occupancy |
|---|---|---|---|---|
| Hallstatt | 31 | $4,918 | $293.92 | 62% |
| Hof bei Salzburg | 21 | $3,403 | $301.21 | 49% |
| Unterach am Attersee | 16 | $3,220 | $285.15 | 43% |
| Molln | 14 | $3,187 | $185.03 | 52% |
| Faistenau | 11 | $3,055 | $276.07 | 40% |
| Mühlbach am Hochkönig | 86 | $3,033 | $323.28 | 40% |
| Bad Sankt Leonhard im Lavanttal | 35 | $2,804 | $300.73 | 36% |
| Salzburg | 497 | $2,785 | $204.13 | 51% |
| Golling an der Salzach | 16 | $2,601 | $241.57 | 41% |
| Spital am Semmering | 24 | $2,578 | $309.29 | 33% |