Spielberg Airbnb Market Analysis 2026: Short Term Rental Data & Vacation Rental Statistics in Styria, Austria
Is Airbnb profitable in Spielberg in 2026? Explore comprehensive Airbnb analytics for Spielberg, Styria, Austria to uncover income potential. This 2026 STR market report for Spielberg, based on AirROI data from February 2025 to January 2026, reveals key trends in the niche market of 28 active listings.
Whether you're considering an Airbnb investment in Spielberg, optimizing your existing vacation rental, or exploring rental arbitrage opportunities, understanding the Spielberg Airbnb data is crucial. Leveraging the low regulation environment is key to maximizing your short term rental income potential. Let's dive into the specifics.
Key Spielberg Airbnb Performance Metrics Overview
Monthly Airbnb Revenue Variations & Income Potential in Spielberg (2026)
Understanding the monthly revenue variations for Airbnb listings in Spielberg is key to maximizing your short term rental income potential. Seasonality significantly impacts earnings. Our analysis, based on data from the past 12 months, shows that the peak revenue month for STRs in Spielberg is typically July, while March often presents the lowest earnings, highlighting opportunities for strategic pricing adjustments during shoulder and low seasons. Explore the typical Airbnb income in Spielberg across different performance tiers:
- Best-in-class properties (Top 10%) achieve $3,664+ monthly, often utilizing dynamic pricing and superior guest experiences.
- Strong performing properties (Top 25%) earn $2,074 or more, indicating effective management and desirable locations/amenities.
- Typical properties (Median) generate around $1,240 per month, representing the average market performance.
- Entry-level properties (Bottom 25%) see earnings around $611, often with potential for optimization.
Average Monthly Airbnb Earnings Trend in Spielberg
Spielberg Airbnb Occupancy Rate Trends (2026)
Maximize your bookings by understanding the Spielberg STR occupancy trends. Seasonal demand shifts significantly influence how often properties are booked. Typically, Julysees the highest demand (peak season occupancy), while January experiences the lowest (low season). Effective strategies, like adjusting minimum stays or offering promotions, can boost occupancy during slower periods. Here's how different property tiers perform in Spielberg:
- Best-in-class properties (Top 10%) achieve 56%+ occupancy, indicating high desirability and potentially optimized availability.
- Strong performing properties (Top 25%) maintain 51% or higher occupancy, suggesting good market fit and guest satisfaction.
- Typical properties (Median) have an occupancy rate around 32%.
- Entry-level properties (Bottom 25%) average 16% occupancy, potentially facing higher vacancy.
Average Monthly Occupancy Rate Trend in Spielberg
Average Daily Rate (ADR) Airbnb Trends in Spielberg (2026)
Effective short term rental pricing strategy in Spielberg involves understanding monthly ADR fluctuations. The Average Daily Rate (ADR) for Airbnb in Spielberg typically peaks in December and dips lowest during September. Leveraging Airbnb dynamic pricing tools or strategies based on this seasonality can significantly boost revenue. Here's a look at the typical nightly rates achieved:
- Best-in-class properties (Top 10%) command rates of $314+ per night, often due to premium features or locations.
- Strong performing properties (Top 25%) achieve nightly rates of $178 or more.
- Typical properties (Median) charge around $120 per night.
- Entry-level properties (Bottom 25%) earn around $83 per night.
Average Daily Rate (ADR) Trend by Month in Spielberg
Get Live Spielberg Market Intelligence 👇

Explore Real-time Analytics
Airbnb Seasonality Analysis & Trends in Spielberg (2026)
Peak Season (July, August, June)
- Revenue averages $3,179 per month
- Occupancy rates average 56.5%
- Daily rates average $163
Shoulder Season
- Revenue averages $1,554 per month
- Occupancy maintains around 30.0%
- Daily rates hold near $170
Low Season (January, March, April)
- Revenue drops to average $703 per month
- Occupancy decreases to average 17.3%
- Daily rates adjust to average $162
Seasonality Insights for Spielberg
- The Airbnb seasonality in Spielberg shows highly seasonal trends requiring careful strategy. While the sections above show seasonal averages, it's also insightful to look at the extremes:
- During the high season, the absolute peak month showcases Spielberg's highest earning potential, with monthly revenues capable of climbing to $3,530, occupancy reaching a high of 68.6%, and ADRs peaking at $198.
- Conversely, the slowest single month of the year, typically falling within the low season, marks the market's lowest point. In this month, revenue might dip to $645, occupancy could drop to 12.9%, and ADRs may adjust down to $139.
- Understanding both the seasonal averages and these monthly peaks and troughs in revenue, occupancy, and ADR is crucial for maximizing your Airbnb profit potential in Spielberg.
Seasonal Strategies for Maximizing Profit
- Peak Season: Maximize revenue through premium pricing and potentially longer minimum stays. Ensure high availability.
- Low Season: Offer competitive pricing, special promotions (e.g., extended stay discounts), and flexible cancellation policies. Target off-season travelers like remote workers or budget-conscious guests.
- Shoulder Seasons: Implement dynamic pricing that balances peak and low rates. Target weekend travelers or specific events. Offer slightly more flexible terms than peak season.
- Regularly analyze your own performance against these Spielberg seasonality benchmarks and adjust your pricing and availability strategy accordingly.
Best Areas for Airbnb Investment in Spielberg (2026)
Exploring the top neighborhoods for short-term rentals in Spielberg? This section highlights key areas, outlining why they are attractive for hosts and guests, along with notable local attractions. Consider these locations based on your target guest profile and investment strategy.
| Neighborhood / Area | Why Host Here? (Target Guests & Appeal) | Key Attractions & Landmarks |
|---|---|---|
| Spielberg Main Square | The vibrant center of Spielberg with shops, cafes, and restaurants. It attracts visitors for its local culture and convenience to attractions. | Spielberg Castle, Local Shops, Dining Options, Festivals, Public Transportation |
| Red Bull Ring | Famous race track that hosts international motorsport events, attracting fans and tourists throughout the year. Ideal for hosting sports enthusiasts. | Red Bull Ring, Motorsport Events, Go-Karting, Car Racing, Race Events |
| Zeltweg | Nearby town with historical significance and close proximity to nature. It's a peaceful area sought for its outdoor activities and local charm. | Zeltweg Museum, Nature Trails, Historical Sites, Local Markets, Scenic Views |
| Knittelfeld | A charming town with rich history and attractive architecture. It offers guests a quieter experience while still being near major attractions. | Knittelfeld Old Town, Local Festivals, Historic Buildings, Parks, Museums |
| Mur River | Beautiful scenic area along the Mur River, perfect for nature lovers and adventure seekers. Great for outdoor activities such as cycling and hiking. | Cycling Paths, Hiking Trails, Fishing Spots, Picnic Areas, Nature Scenery |
| Frohnleiten | A picturesque town with historic buildings and beautiful riverside views. Perfect for tourists looking to relax and explore nature. | Old Town Frohnleiten, River Mur Views, Hiking Routes, Local Cuisine, Shopping |
| Aigen im Ennstal | Nestled in nature, this area is perfect for those who want a tranquil retreat. Ideal for tourists seeking hiking and skiing opportunities. | Ski Resorts, Hiking Trails, Local Wildlife, Scenic Views, Nature Parks |
| Mautern in Steiermark | A serene village known for its thermal baths and wellness offerings. Attracts visitors looking for relaxation and health-focused stays. | Thermal Baths, Spa Centers, Local Wellness Retreats, Nature Walks, Cultural Events |
Understanding Airbnb License Requirements & STR Laws in Spielberg (2026)
While Spielberg, Styria, Austria currently shows low STR regulations, specific Airbnb license requirements might still exist or change. Always verify the latest short term rental regulations and Airbnb license requirements directly with local government authorities for Spielberg to ensure full compliance before hosting.
(Source: AirROI data, 2026, finding no licensed listings among those analyzed)
Top Performing Airbnb Properties in Spielberg (2026)
Benchmark your potential! Explore examples of top-performing Airbnb properties in Spielbergbased on Trailing Twelve Month (TTM) revenue. Analyze their characteristics, revenue, occupancy rate, and ADR to understand what drives success in this market.

The entire apartment in Spielberg
Entire Place • 2 bedrooms
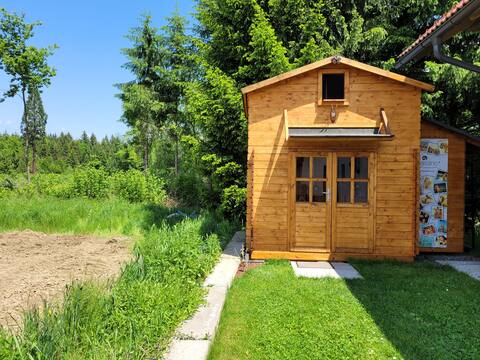
Quiet garden hut at the edge of the forest near Red Bull Ring
Entire Place • 1 bedroom

House by the swimming pond / near Red Bull Ring
Entire Place • 2 bedrooms
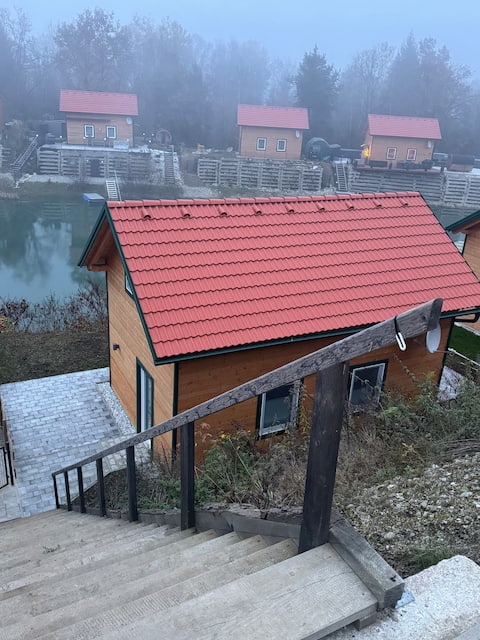
Haus am Badeteich/ Red Bull Ring
Entire Place • 2 bedrooms
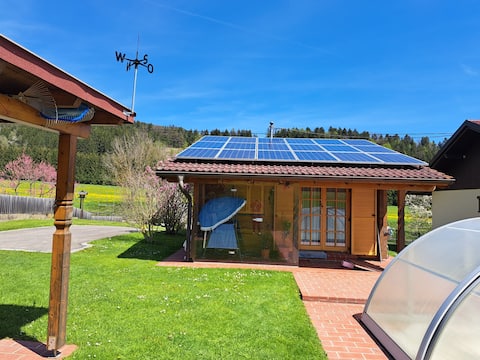
Vacation home Sonnenschein Red Bull Ring Spielberg
Entire Place • 1 bedroom

Silent Camping XL (60-70qm) Red Bull Ring/Airpower
Entire Place • N/A
Note: Performance varies based on location, size, amenities, seasonality, and management quality. Data reflects the past 12 months.
Top Performing Airbnb Hosts in Spielberg (2026)
Learn from the best! This table showcases top-performing Airbnb hosts in Spielberg based on the number of properties managed and estimated total revenue over the past year. Analyze their scale and performance metrics.
| Host Name | Properties | Grossing Revenue | Stay Reviews | Avg Rating |
|---|---|---|---|---|
| Sepp | 13 | $84,320 | 38 | 4.84/5.0 |
| Christoph | 1 | $75,087 | 2 | Not Rated |
| Walter | 2 | $38,403 | 38 | 5.00/5.0 |
| Michael | 1 | $27,597 | 10 | 5.00/5.0 |
| Sonja Und Alois | 1 | $16,067 | 16 | 5.00/5.0 |
| Bernd | 1 | $10,761 | 20 | 4.95/5.0 |
| Daniel | 1 | $9,617 | 9 | 5.00/5.0 |
| Yvonne | 1 | $3,970 | 2 | Not Rated |
| Sandra | 1 | $2,312 | 8 | 5.00/5.0 |
| Günter | 1 | $1,581 | 8 | 5.00/5.0 |
Analyzing the strategies of top hosts, such as their property selection, pricing, and guest communication, can offer valuable lessons for optimizing your own Airbnb operations in Spielberg.
Dive Deeper: Advanced Spielberg STR Market Data (2026)
Ready to unlock more insights? AirROI provides access to advanced metrics and comprehensive Airbnb data for Spielberg. Explore detailed analytics beyond this report to refine your investment strategy, optimize pricing, and maximize your vacation rental profits.
Explore Advanced MetricsSpielberg Short-Term Rental Market Composition (2026): Property & Room Types
Room Type Distribution
Property Type Distribution
Market Composition Insights for Spielberg
- The Spielberg Airbnb market composition is heavily skewed towards Entire Home/Apt listings, which make up 100% of the 28 active rentals. This indicates strong guest preference for privacy and space.
- Looking at the property type distribution in Spielberg, Outdoor/Unique properties are the most common (67.9%), reflecting the local real estate landscape.
- Smaller segments like hotel/boutique (combined 3.6%) offer potential for unique stay experiences.
Spielberg Airbnb Room Capacity Analysis (2026): Bedroom Distribution
Distribution of Listings by Number of Bedrooms
Room Capacity Insights for Spielberg
- The dominant room capacity in Spielberg is 1 bedroom listings, making up 21.4% of the market. This suggests a strong demand for properties suitable for couples or solo travelers.
- Together, 1 bedroom and 2 bedrooms properties represent 39.3% of the active Airbnb listings in Spielberg, indicating a high concentration in these sizes.
Spielberg Vacation Rental Guest Capacity Trends (2026)
Distribution of Listings by Guest Capacity
Guest Capacity Insights for Spielberg
- The most common guest capacity trend in Spielberg vacation rentals is listings accommodating 2 guests (28.6%). This suggests the primary traveler segment is likely couples or solo travelers.
- Properties designed for 2 guests and 4 guests dominate the Spielberg STR market, accounting for 57.2% of listings.
- 17.8% of properties accommodate 6+ guests, serving the market segment for larger families or group travel in Spielberg.
- On average, properties in Spielberg are equipped to host 3.6 guests.
Spielberg Airbnb Booking Patterns (2026): Available vs. Booked Days
Available Days Distribution
Booked Days Distribution
Booking Pattern Insights for Spielberg
- The most common availability pattern in Spielberg falls within the 271-366 days range, representing 71.4% of listings. This suggests many properties have significant open periods on their calendars.
- Approximately 100.0% of listings show high availability (181+ days open annually), indicating potential for increased bookings or specific owner usage patterns.
- For booked days, the 31-90 days range is most frequent in Spielberg (42.9%), reflecting common guest stay durations or potential owner blocking patterns.
Spielberg Airbnb Minimum Stay Requirements Analysis
Distribution of Listings by Minimum Night Requirement
1 Night
14 listings
50% of total
2 Nights
4 listings
14.3% of total
3 Nights
2 listings
7.1% of total
4-6 Nights
1 listings
3.6% of total
30+ Nights
7 listings
25% of total
Key Insights
- The most prevalent minimum stay requirement in Spielberg is 1 Night, adopted by 50% of listings. This highlights the market's preference for shorter, flexible bookings.
- A strong majority (64.3%) of the Spielberg Airbnb data shows acceptance of very short stays (1-2 nights), indicating a dynamic, high-turnover market.
- A significant segment (25%) caters to monthly stays (30+ nights) in Spielberg, pointing to opportunities in the extended-stay market.
Recommendations
- Align with the market by considering a 1 Night minimum stay, as 50% of Spielberg hosts use this setting.
- Explore offering discounts for stays of 30+ nights to attract the 25% of the market seeking extended stays.
- Adjust minimum nights based on seasonality – potentially shorter during low season and longer during peak demand periods in Spielberg.
Spielberg Airbnb Cancellation Policy Trends Analysis (2026)
Flexible
6 listings
21.4% of total
Moderate
1 listings
3.6% of total
Firm
9 listings
32.1% of total
Strict
12 listings
42.9% of total
Cancellation Policy Insights for Spielberg
- The prevailing Airbnb cancellation policy trend in Spielberg is Strict, used by 42.9% of listings.
- A majority (75.0%) of hosts in Spielberg utilize Firm or Strict policies, indicating a market where hosts prioritize booking security.
Recommendations for Hosts
- Consider adopting a Strict policy to align with the 42.9% market standard in Spielberg.
- With 42.9% using Strict terms, this is a viable option in Spielberg, particularly for high-value properties or during peak demand periods.
- Regularly review your cancellation policy against competitors and market demand shifts in Spielberg.
Spielberg STR Booking Lead Time Analysis (2026)
Average Booking Lead Time by Month
Booking Lead Time Insights for Spielberg
- The overall average booking lead time for vacation rentals in Spielberg is 124 days.
- Guests book furthest in advance for stays during May (average 138 days), likely coinciding with peak travel demand or local events.
- The shortest booking windows occur for stays in November (average 1 days), indicating more last-minute travel plans during this time.
- Seasonally, Summer (111 days avg.) sees the longest lead times, while Winter (34 days avg.) has the shortest, reflecting typical travel planning cycles.
Recommendations for Hosts
- Use the overall average lead time (124 days) as a baseline for your pricing and availability strategy in Spielberg.
- For May stays, consider implementing length-of-stay discounts or slightly higher rates for bookings made less than 138 days out to capitalize on advance planning.
- During November, focus on last-minute booking availability and promotions, as guests book with very short notice (1 days avg.).
- Target marketing efforts for the Summer season well in advance (at least 111 days) to capture early planners.
- Monitor your own booking lead times against these Spielberg averages to identify opportunities for dynamic pricing adjustments.
Popular & Essential Airbnb Amenities in Spielberg (2026)
Amenity Prevalence
Amenity Insights for Spielberg
- Popular amenities like Wifi, Hot water, Free parking on premises are common but not universal. Offering these can provide a competitive edge.
- Warning: Wifi is not universally provided but is considered essential globally. Ensure reliable Wifi is offered.
Recommendations for Hosts
- Consider adding popular differentiators like Wifi or Hot water to increase appeal.
- Highlight unique or less common amenities you offer (e.g., hot tub, dedicated workspace, EV charger) in your listing description and photos.
- Regularly check competitor amenities in Spielberg to stay competitive.
Spielberg Airbnb Guest Demographics & Profile Analysis (2026)
Guest Profile Summary for Spielberg
- The typical guest profile for Airbnb in Spielberg consists of predominantly international visitors (75%), with top international origins including Austria, typically belonging to the Post-2000s (Gen Z/Alpha) group (50%), primarily speaking English or German.
- Domestic travelers account for 25.0% of guests.
- Key international markets include Germany (29.2%) and Austria (25%).
- Top languages spoken are English (39.1%) followed by German (30.4%).
- A significant demographic segment is the Post-2000s (Gen Z/Alpha) group, representing 50% of guests.
Recommendations for Hosts
- Focus marketing internationally, particularly towards travelers from Austria.
- Tailor amenities and listing descriptions to appeal to the dominant Post-2000s (Gen Z/Alpha) demographic (e.g., highlight fast WiFi, smart home features, local guides).
- Highlight unique local experiences or amenities relevant to the primary guest profile.
- Consider seasonal promotions aligned with peak travel times for key origin markets.
Nearby Short-Term Rental Market Comparison
How does the Spielberg Airbnb market stack up against its neighbors? Compare key performance metrics like average monthly revenue, ADR, and occupancy rates in surrounding areas to understand the broader regional STR landscape.
| Market | Active Properties | Monthly Revenue | Daily Rate | Avg. Occupancy |
|---|---|---|---|---|
| Hallstatt | 31 | $4,918 | $293.92 | 62% |
| Hof bei Salzburg | 21 | $3,403 | $301.21 | 49% |
| Unterach am Attersee | 16 | $3,220 | $285.15 | 43% |
| Molln | 14 | $3,187 | $185.03 | 52% |
| Faistenau | 11 | $3,055 | $276.07 | 40% |
| Mühlbach am Hochkönig | 86 | $3,033 | $323.28 | 40% |
| Bad Sankt Leonhard im Lavanttal | 35 | $2,804 | $300.73 | 36% |
| Salzburg | 497 | $2,785 | $204.13 | 51% |
| Golling an der Salzach | 16 | $2,601 | $241.57 | 41% |
| Spital am Semmering | 24 | $2,578 | $309.29 | 33% |