Koppl Airbnb Market Analysis 2026: Short Term Rental Data & Vacation Rental Statistics in Salzburg, Austria
Is Airbnb profitable in Koppl in 2026? Explore comprehensive Airbnb analytics for Koppl, Salzburg, Austria to uncover income potential. This 2026 STR market report for Koppl, based on AirROI data from February 2025 to January 2026, reveals key trends in the niche market of 19 active listings.
Whether you're considering an Airbnb investment in Koppl, optimizing your existing vacation rental, or exploring rental arbitrage opportunities, understanding the Koppl Airbnb data is crucial. Navigating the high regulation landscape is key to maximizing your short term rental income potential. Let's dive into the specifics.
Key Koppl Airbnb Performance Metrics Overview
Monthly Airbnb Revenue Variations & Income Potential in Koppl (2026)
Understanding the monthly revenue variations for Airbnb listings in Koppl is key to maximizing your short term rental income potential. Seasonality significantly impacts earnings. Our analysis, based on data from the past 12 months, shows that the peak revenue month for STRs in Koppl is typically August, while January often presents the lowest earnings, highlighting opportunities for strategic pricing adjustments during shoulder and low seasons. Explore the typical Airbnb income in Koppl across different performance tiers:
- Best-in-class properties (Top 10%) achieve $5,383+ monthly, often utilizing dynamic pricing and superior guest experiences.
- Strong performing properties (Top 25%) earn $4,019 or more, indicating effective management and desirable locations/amenities.
- Typical properties (Median) generate around $2,468 per month, representing the average market performance.
- Entry-level properties (Bottom 25%) see earnings around $1,286, often with potential for optimization.
Average Monthly Airbnb Earnings Trend in Koppl
Koppl Airbnb Occupancy Rate Trends (2026)
Maximize your bookings by understanding the Koppl STR occupancy trends. Seasonal demand shifts significantly influence how often properties are booked. Typically, Augustsees the highest demand (peak season occupancy), while January experiences the lowest (low season). Effective strategies, like adjusting minimum stays or offering promotions, can boost occupancy during slower periods. Here's how different property tiers perform in Koppl:
- Best-in-class properties (Top 10%) achieve 75%+ occupancy, indicating high desirability and potentially optimized availability.
- Strong performing properties (Top 25%) maintain 60% or higher occupancy, suggesting good market fit and guest satisfaction.
- Typical properties (Median) have an occupancy rate around 44%.
- Entry-level properties (Bottom 25%) average 28% occupancy, potentially facing higher vacancy.
Average Monthly Occupancy Rate Trend in Koppl
Average Daily Rate (ADR) Airbnb Trends in Koppl (2026)
Effective short term rental pricing strategy in Koppl involves understanding monthly ADR fluctuations. The Average Daily Rate (ADR) for Airbnb in Koppl typically peaks in December and dips lowest during April. Leveraging Airbnb dynamic pricing tools or strategies based on this seasonality can significantly boost revenue. Here's a look at the typical nightly rates achieved:
- Best-in-class properties (Top 10%) command rates of $284+ per night, often due to premium features or locations.
- Strong performing properties (Top 25%) achieve nightly rates of $260 or more.
- Typical properties (Median) charge around $191 per night.
- Entry-level properties (Bottom 25%) earn around $135 per night.
Average Daily Rate (ADR) Trend by Month in Koppl
Get Live Koppl Market Intelligence 👇

Explore Real-time Analytics
Airbnb Seasonality Analysis & Trends in Koppl (2026)
Peak Season (August, July, June)
- Revenue averages $4,379 per month
- Occupancy rates average 65.8%
- Daily rates average $206
Shoulder Season
- Revenue averages $2,871 per month
- Occupancy maintains around 43.1%
- Daily rates hold near $202
Low Season (January, February, March)
- Revenue drops to average $1,642 per month
- Occupancy decreases to average 28.2%
- Daily rates adjust to average $186
Seasonality Insights for Koppl
- The Airbnb seasonality in Koppl shows highly seasonal trends requiring careful strategy. While the sections above show seasonal averages, it's also insightful to look at the extremes:
- During the high season, the absolute peak month showcases Koppl's highest earning potential, with monthly revenues capable of climbing to $4,862, occupancy reaching a high of 74.0%, and ADRs peaking at $218.
- Conversely, the slowest single month of the year, typically falling within the low season, marks the market's lowest point. In this month, revenue might dip to $1,214, occupancy could drop to 16.6%, and ADRs may adjust down to $171.
- Understanding both the seasonal averages and these monthly peaks and troughs in revenue, occupancy, and ADR is crucial for maximizing your Airbnb profit potential in Koppl.
Seasonal Strategies for Maximizing Profit
- Peak Season: Maximize revenue through premium pricing and potentially longer minimum stays. Ensure high availability.
- Low Season: Offer competitive pricing, special promotions (e.g., extended stay discounts), and flexible cancellation policies. Target off-season travelers like remote workers or budget-conscious guests.
- Shoulder Seasons: Implement dynamic pricing that balances peak and low rates. Target weekend travelers or specific events. Offer slightly more flexible terms than peak season.
- Regularly analyze your own performance against these Koppl seasonality benchmarks and adjust your pricing and availability strategy accordingly.
Best Areas for Airbnb Investment in Koppl (2026)
Exploring the top neighborhoods for short-term rentals in Koppl? This section highlights key areas, outlining why they are attractive for hosts and guests, along with notable local attractions. Consider these locations based on your target guest profile and investment strategy.
| Neighborhood / Area | Why Host Here? (Target Guests & Appeal) | Key Attractions & Landmarks |
|---|---|---|
| Koppl Village Center | Charming village atmosphere with proximity to Salzburg city. Ideal for visitors seeking a peaceful retreat while still being close to urban attractions. | Koppl Church, Koppl Village Museum, Salzach River, Scenic walking trails, Local cafes and restaurants |
| Urmersbach Valley | Scenic valley known for its natural beauty and hiking trails. Attracts nature lovers and outdoor enthusiasts. | Hiking paths, Bike trails, Natural springs, Picnic spots, Wildlife viewing |
| Seekirchen am Wallersee | Lakeside area just a short drive from Koppl, known for water activities and picturesque parks. Popular for summer vacations. | Wallersee Lake, Water sports, Beach clubs, Lakeside promenades, Local markets |
| Hohensalzburg Fortress | Iconic landmark just a few minutes from Koppl, offering stunning views of Salzburg and the surrounding landscape. A must-visit for tourists. | Fortress tours, Historical exhibits, Stunning views, Dining options, Cultural events |
| Hellbrunn Palace | Famous for its beautiful gardens and trick fountains. A great day trip for tourists looking for history and relaxation. | Hellbrunn Palace, Trick fountains, Botanical gardens, Picnic areas, Cafes |
| Salzburg Old Town | Historic center of Salzburg, a UNESCO World Heritage site. Rich in culture, history, and architecture, making it a prime spot for guests. | Mirabell Palace, Mozart's birthplace, Residenzplatz, Salzburg Cathedral, Getreidegasse |
| Gaisberg Mountain | Popular for hiking and skiing, offering breathtaking views of the Alps. Attracts outdoor enthusiasts year-round. | Hiking trails, Ski slopes, Panoramic views, Alpine restaurants, Nature reserves |
| Monchsberg Hill | A beautiful area close to the city center with walking paths and views over Salzburg. Great for those seeking an escape from the city. | Fortress views, Walking trails, Modern art museum, Scenic overlooks, Cafes |
Understanding Airbnb License Requirements & STR Laws in Koppl (2026)
Yes, Koppl, Salzburg, Austria enforces high STR regulations. Obtaining a license and ensuring compliance is almost certainly required according to current 2026 STR laws. Always verify the latest short term rental regulations and Airbnb license requirements directly with local government authorities for Koppl to ensure full compliance before hosting.
(Source: AirROI data, 2026, based on 37% licensed listings)
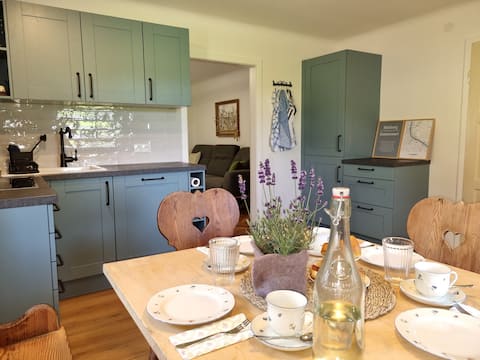
Top Performing Airbnb Properties in Koppl (2026)
Benchmark your potential! Explore examples of top-performing Airbnb properties in Kopplbased on Trailing Twelve Month (TTM) revenue. Analyze their characteristics, revenue, occupancy rate, and ADR to understand what drives success in this market.

Skyloft Salzburg – Between city, mountains & lakes
Entire Place • 3 bedrooms
Nockstein vacation home - Family vacation in Salzburg
Entire Place • 3 bedrooms
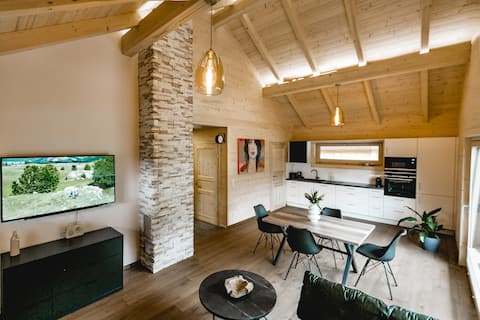
Chalet 49 Nesselgraben Niki, with a large balcony
Entire Place • 2 bedrooms
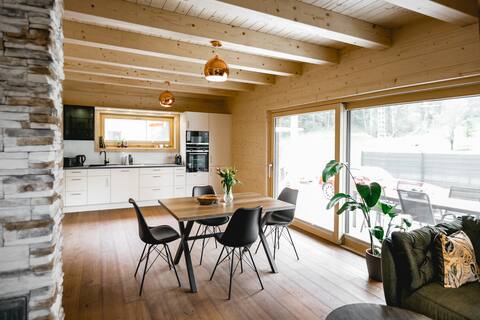
Chalet 49 Nesselgraben Jochen, with terrace/garden
Entire Place • 2 bedrooms
Edtgut Farm "Loft"
Entire Place • N/A

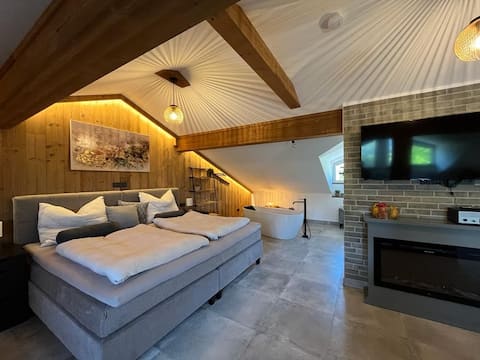
Penthouse Apartment – Close to City & Lake Region”
Entire Place • 1 bedroom
Note: Performance varies based on location, size, amenities, seasonality, and management quality. Data reflects the past 12 months.
Top Performing Airbnb Hosts in Koppl (2026)
Learn from the best! This table showcases top-performing Airbnb hosts in Koppl based on the number of properties managed and estimated total revenue over the past year. Analyze their scale and performance metrics.
| Host Name | Properties | Grossing Revenue | Stay Reviews | Avg Rating |
|---|---|---|---|---|
| Christian | 2 | $103,203 | 216 | 4.94/5.0 |
| Anna | 1 | $86,390 | 127 | 4.91/5.0 |
| Andreas | 1 | $52,871 | 70 | 4.89/5.0 |
| Evelin | 1 | $45,920 | 71 | 4.99/5.0 |
| Elisabeth | 1 | $42,292 | 38 | 4.97/5.0 |
| Roman | 1 | $37,768 | 51 | 4.90/5.0 |
| Klaus | 1 | $32,119 | 79 | 4.99/5.0 |
| Thomas | 1 | $26,286 | 40 | 4.80/5.0 |
| Julia Elisa | 1 | $21,662 | 213 | 4.91/5.0 |
| Barbara | 1 | $19,597 | 9 | 4.89/5.0 |
Analyzing the strategies of top hosts, such as their property selection, pricing, and guest communication, can offer valuable lessons for optimizing your own Airbnb operations in Koppl.
Dive Deeper: Advanced Koppl STR Market Data (2026)
Ready to unlock more insights? AirROI provides access to advanced metrics and comprehensive Airbnb data for Koppl. Explore detailed analytics beyond this report to refine your investment strategy, optimize pricing, and maximize your vacation rental profits.
Explore Advanced MetricsKoppl Short-Term Rental Market Composition (2026): Property & Room Types
Room Type Distribution
Property Type Distribution
Market Composition Insights for Koppl
- The Koppl Airbnb market composition is heavily skewed towards Entire Home/Apt listings, which make up 100% of the 19 active rentals. This indicates strong guest preference for privacy and space.
- Looking at the property type distribution in Koppl, Apartment/Condo properties are the most common (73.7%), reflecting the local real estate landscape.
- Houses represent a significant 26.3% portion, catering likely to families or larger groups.
Koppl Airbnb Room Capacity Analysis (2026): Bedroom Distribution
Distribution of Listings by Number of Bedrooms
Room Capacity Insights for Koppl
- The dominant room capacity in Koppl is 1 bedroom listings, making up 47.4% of the market. This suggests a strong demand for properties suitable for couples or solo travelers.
- Together, 1 bedroom and 2 bedrooms properties represent 79.0% of the active Airbnb listings in Koppl, indicating a high concentration in these sizes.
Koppl Vacation Rental Guest Capacity Trends (2026)
Distribution of Listings by Guest Capacity
Guest Capacity Insights for Koppl
- The most common guest capacity trend in Koppl vacation rentals is listings accommodating 4 guests (47.4%). This suggests the primary traveler segment is likely small families or groups.
- Properties designed for 4 guests and 6 guests dominate the Koppl STR market, accounting for 68.5% of listings.
- 21.1% of properties accommodate 6+ guests, serving the market segment for larger families or group travel in Koppl.
- On average, properties in Koppl are equipped to host 4.1 guests.
Koppl Airbnb Booking Patterns (2026): Available vs. Booked Days
Available Days Distribution
Booked Days Distribution
Booking Pattern Insights for Koppl
- The most common availability pattern in Koppl falls within the 271-366 days range, representing 42.1% of listings. This suggests many properties have significant open periods on their calendars.
- Approximately 57.9% of listings show high availability (181+ days open annually), indicating potential for increased bookings or specific owner usage patterns.
- For booked days, the 181-270 days range is most frequent in Koppl (42.1%), reflecting common guest stay durations or potential owner blocking patterns.
- A notable 42.1% of properties secure long booking periods (181+ days booked per year), highlighting successful long-term rental strategies or significant owner usage.
Koppl Airbnb Minimum Stay Requirements Analysis
Distribution of Listings by Minimum Night Requirement
2 Nights
5 listings
26.3% of total
3 Nights
3 listings
15.8% of total
4-6 Nights
1 listings
5.3% of total
30+ Nights
10 listings
52.6% of total
Key Insights
- The most prevalent minimum stay requirement in Koppl is 30+ Nights, adopted by 52.6% of listings. This highlights the market's preference for longer commitments.
- A significant segment (52.6%) caters to monthly stays (30+ nights) in Koppl, pointing to opportunities in the extended-stay market.
Recommendations
- Align with the market by considering a 30+ Nights minimum stay, as 52.6% of Koppl hosts use this setting.
- Explore offering discounts for stays of 30+ nights to attract the 52.6% of the market seeking extended stays.
- Adjust minimum nights based on seasonality – potentially shorter during low season and longer during peak demand periods in Koppl.
Koppl Airbnb Cancellation Policy Trends Analysis (2026)
Flexible
4 listings
21.1% of total
Moderate
9 listings
47.4% of total
Firm
5 listings
26.3% of total
Strict
1 listings
5.3% of total
Cancellation Policy Insights for Koppl
- The prevailing Airbnb cancellation policy trend in Koppl is Moderate, used by 47.4% of listings.
- There's a relatively balanced mix between guest-friendly (68.5%) and stricter (31.6%) policies, offering choices for different guest needs.
- Strict cancellation policies are quite rare (5.3%), potentially making listings with this policy less competitive unless justified by high demand or property type.
Recommendations for Hosts
- Consider adopting a Moderate policy to align with the 47.4% market standard in Koppl.
- Using a Strict policy might deter some guests, as only 5.3% of listings use it. Evaluate if potential revenue protection outweighs possible lower booking rates.
- Regularly review your cancellation policy against competitors and market demand shifts in Koppl.
Koppl STR Booking Lead Time Analysis (2026)
Average Booking Lead Time by Month
Booking Lead Time Insights for Koppl
- The overall average booking lead time for vacation rentals in Koppl is 58 days.
- Guests book furthest in advance for stays during July (average 111 days), likely coinciding with peak travel demand or local events.
- The shortest booking windows occur for stays in March (average 26 days), indicating more last-minute travel plans during this time.
- Seasonally, Summer (93 days avg.) sees the longest lead times, while Spring (42 days avg.) has the shortest, reflecting typical travel planning cycles.
Recommendations for Hosts
- Use the overall average lead time (58 days) as a baseline for your pricing and availability strategy in Koppl.
- For July stays, consider implementing length-of-stay discounts or slightly higher rates for bookings made less than 111 days out to capitalize on advance planning.
- Target marketing efforts for the Summer season well in advance (at least 93 days) to capture early planners.
- Monitor your own booking lead times against these Koppl averages to identify opportunities for dynamic pricing adjustments.
Popular & Essential Airbnb Amenities in Koppl (2026)
Amenity Prevalence
Amenity Insights for Koppl
- Essential amenities in Koppl that guests expect include: Free parking on premises, Kitchen. Lacking these (any) could significantly impact bookings.
- Popular amenities like Heating, Hair dryer, Dishes and silverware are common but not universal. Offering these can provide a competitive edge.
- Warning: Wifi is not universally provided but is considered essential globally. Ensure reliable Wifi is offered.
Recommendations for Hosts
- Ensure your listing includes all essential amenities for Koppl: Free parking on premises, Kitchen.
- Consider adding popular differentiators like Heating or Hair dryer to increase appeal.
- Highlight unique or less common amenities you offer (e.g., hot tub, dedicated workspace, EV charger) in your listing description and photos.
- Regularly check competitor amenities in Koppl to stay competitive.
Koppl Airbnb Guest Demographics & Profile Analysis (2026)
Guest Profile Summary for Koppl
- The typical guest profile for Airbnb in Koppl consists of predominantly international visitors (99%), with top international origins including Germany, typically belonging to the Post-2000s (Gen Z/Alpha) group (50%), primarily speaking English or German.
- Domestic travelers account for 1.4% of guests.
- Key international markets include United States (26.8%) and Germany (23.9%).
- Top languages spoken are English (45.2%) followed by German (17.8%).
- A significant demographic segment is the Post-2000s (Gen Z/Alpha) group, representing 50% of guests.
Recommendations for Hosts
- Focus marketing internationally, particularly towards travelers from Germany.
- Tailor amenities and listing descriptions to appeal to the dominant Post-2000s (Gen Z/Alpha) demographic (e.g., highlight fast WiFi, smart home features, local guides).
- Highlight unique local experiences or amenities relevant to the primary guest profile.
- Consider seasonal promotions aligned with peak travel times for key origin markets.
Nearby Short-Term Rental Market Comparison
How does the Koppl Airbnb market stack up against its neighbors? Compare key performance metrics like average monthly revenue, ADR, and occupancy rates in surrounding areas to understand the broader regional STR landscape.
| Market | Active Properties | Monthly Revenue | Daily Rate | Avg. Occupancy |
|---|---|---|---|---|
| Scheffau am Wilden Kaiser | 12 | $6,669 | $906.83 | 30% |
| Hallstatt | 31 | $4,918 | $293.92 | 62% |
| Cortina d'Ampezzo | 309 | $3,646 | $474.12 | 40% |
| Going am Wilden Kaiser | 27 | $3,596 | $406.50 | 37% |
| Bayrischzell | 41 | $3,550 | $389.91 | 33% |
| Krimml | 53 | $3,544 | $359.14 | 41% |
| Hof bei Salzburg | 21 | $3,403 | $301.21 | 49% |
| Reith bei Kitzbühel | 49 | $3,385 | $356.25 | 34% |
| Colle Santa Lucia | 21 | $3,353 | $248.56 | 46% |
| Unterach am Attersee | 16 | $3,220 | $285.15 | 43% |