Kaprun Airbnb Market Analysis 2026: Short Term Rental Data & Vacation Rental Statistics in Salzburg, Austria
Is Airbnb profitable in Kaprun in 2026? Explore comprehensive Airbnb analytics for Kaprun, Salzburg, Austria to uncover income potential. This 2026 STR market report for Kaprun, based on AirROI data from February 2025 to January 2026, reveals key trends in the market of 207 active listings.
Whether you're considering an Airbnb investment in Kaprun, optimizing your existing vacation rental, or exploring rental arbitrage opportunities, understanding the Kaprun Airbnb data is crucial. Navigating the high regulation landscape is key to maximizing your short term rental income potential. Let's dive into the specifics.
Key Kaprun Airbnb Performance Metrics Overview
Monthly Airbnb Revenue Variations & Income Potential in Kaprun (2026)
Understanding the monthly revenue variations for Airbnb listings in Kaprun is key to maximizing your short term rental income potential. Seasonality significantly impacts earnings. Our analysis, based on data from the past 12 months, shows that the peak revenue month for STRs in Kaprun is typically February, while May often presents the lowest earnings, highlighting opportunities for strategic pricing adjustments during shoulder and low seasons. Explore the typical Airbnb income in Kaprun across different performance tiers:
- Best-in-class properties (Top 10%) achieve $7,002+ monthly, often utilizing dynamic pricing and superior guest experiences.
- Strong performing properties (Top 25%) earn $4,272 or more, indicating effective management and desirable locations/amenities.
- Typical properties (Median) generate around $2,258 per month, representing the average market performance.
- Entry-level properties (Bottom 25%) see earnings around $1,170, often with potential for optimization.
Average Monthly Airbnb Earnings Trend in Kaprun
Kaprun Airbnb Occupancy Rate Trends (2026)
Maximize your bookings by understanding the Kaprun STR occupancy trends. Seasonal demand shifts significantly influence how often properties are booked. Typically, Februarysees the highest demand (peak season occupancy), while January experiences the lowest (low season). Effective strategies, like adjusting minimum stays or offering promotions, can boost occupancy during slower periods. Here's how different property tiers perform in Kaprun:
- Best-in-class properties (Top 10%) achieve 68%+ occupancy, indicating high desirability and potentially optimized availability.
- Strong performing properties (Top 25%) maintain 50% or higher occupancy, suggesting good market fit and guest satisfaction.
- Typical properties (Median) have an occupancy rate around 29%.
- Entry-level properties (Bottom 25%) average 14% occupancy, potentially facing higher vacancy.
Average Monthly Occupancy Rate Trend in Kaprun
Average Daily Rate (ADR) Airbnb Trends in Kaprun (2026)
Effective short term rental pricing strategy in Kaprun involves understanding monthly ADR fluctuations. The Average Daily Rate (ADR) for Airbnb in Kaprun typically peaks in February and dips lowest during May. Leveraging Airbnb dynamic pricing tools or strategies based on this seasonality can significantly boost revenue. Here's a look at the typical nightly rates achieved:
- Best-in-class properties (Top 10%) command rates of $600+ per night, often due to premium features or locations.
- Strong performing properties (Top 25%) achieve nightly rates of $396 or more.
- Typical properties (Median) charge around $259 per night.
- Entry-level properties (Bottom 25%) earn around $181 per night.
Average Daily Rate (ADR) Trend by Month in Kaprun
Get Live Kaprun Market Intelligence 👇

Explore Real-time Analytics
Airbnb Seasonality Analysis & Trends in Kaprun (2026)
Peak Season (February, August, July)
- Revenue averages $4,890 per month
- Occupancy rates average 47.4%
- Daily rates average $364
Shoulder Season
- Revenue averages $2,963 per month
- Occupancy maintains around 30.8%
- Daily rates hold near $328
Low Season (May, September, November)
- Revenue drops to average $2,086 per month
- Occupancy decreases to average 27.0%
- Daily rates adjust to average $299
Seasonality Insights for Kaprun
- The Airbnb seasonality in Kaprun shows highly seasonal trends requiring careful strategy. While the sections above show seasonal averages, it's also insightful to look at the extremes:
- During the high season, the absolute peak month showcases Kaprun's highest earning potential, with monthly revenues capable of climbing to $6,106, occupancy reaching a high of 55.2%, and ADRs peaking at $419.
- Conversely, the slowest single month of the year, typically falling within the low season, marks the market's lowest point. In this month, revenue might dip to $1,915, occupancy could drop to 25.2%, and ADRs may adjust down to $274.
- Understanding both the seasonal averages and these monthly peaks and troughs in revenue, occupancy, and ADR is crucial for maximizing your Airbnb profit potential in Kaprun.
Seasonal Strategies for Maximizing Profit
- Peak Season: Maximize revenue through premium pricing and potentially longer minimum stays. Ensure high availability.
- Low Season: Offer competitive pricing, special promotions (e.g., extended stay discounts), and flexible cancellation policies. Target off-season travelers like remote workers or budget-conscious guests.
- Shoulder Seasons: Implement dynamic pricing that balances peak and low rates. Target weekend travelers or specific events. Offer slightly more flexible terms than peak season.
- Regularly analyze your own performance against these Kaprun seasonality benchmarks and adjust your pricing and availability strategy accordingly.
Best Areas for Airbnb Investment in Kaprun (2026)
Exploring the top neighborhoods for short-term rentals in Kaprun? This section highlights key areas, outlining why they are attractive for hosts and guests, along with notable local attractions. Consider these locations based on your target guest profile and investment strategy.
| Neighborhood / Area | Why Host Here? (Target Guests & Appeal) | Key Attractions & Landmarks |
|---|---|---|
| Schmittenhöhe | A stunning mountain area popular for skiing and hiking, offering breathtaking views and proximity to nature. Ideal for outdoor enthusiasts looking for both winter sports and summer activities. | Schmittenhöhe ski resort, Zeller See, Hiking trails, Cable cars, Restaurants with mountain views |
| Kaprun Castle | A historic landmark with cultural significance, attracting history buffs and tourists looking for unique experiences. The castle offers guided tours and beautiful views of the valley. | Kaprun Castle, Cultural events, Local history exhibitions, Scenic overlooks, Photography spots |
| Lake Zeller | A picturesque lake surrounded by the Alps, perfect for water sports and relaxation. It attracts families and tourists looking for scenic spots and recreational activities. | Swimming and boating, Hiking around the lake, Lakeside parks, Picnic areas, Cycling paths |
| Maiskogel | Popular ski and hiking area that is family-friendly and offers a range of leisure activities, making it a go-to destination for families and adventure seekers. | Maiskogel ski resort, Hiking paths, Alpine coaster, Family-friendly activities, Mountain restaurants |
| Ice Arena Kaprun | A year-round ice rink attracting families and sports enthusiasts. It's a great spot for leisure activities and social gatherings. | Ice skating, Ice hockey, Curling events, Events and shows, Food and drinks |
| Kaprun Spa | A wellness and spa destination that attracts visitors looking to relax and rejuvenate. Offers a range of treatments and relaxation opportunities. | Thermal baths, Wellness treatments, Saunas and spas, Relaxation areas, Indoor pools |
| Zell am See | Nearby town famous for its beautiful lake and ski resort, attracting tourists year-round. Offers vibrant nightlife, dining, and shopping options. | Zell am See ski area, Zeller See beach, City center shops, Restaurants, Nightlife spots |
| Pinzgauer Spaziergang | A scenic hiking trail that runs along the mountains, catering to hiking enthusiasts looking for beautiful views and nature experiences. | Scenic lookout points, Hiking paths, Wildlife spotting, Photography opportunities, Parks along the trail |
Understanding Airbnb License Requirements & STR Laws in Kaprun (2026)
Yes, Kaprun, Salzburg, Austria enforces high STR regulations. Obtaining a license and ensuring compliance is almost certainly required according to current 2026 STR laws. Always verify the latest short term rental regulations and Airbnb license requirements directly with local government authorities for Kaprun to ensure full compliance before hosting.
(Source: AirROI data, 2026, based on 58% licensed listings)
Top Performing Airbnb Properties in Kaprun (2026)
Benchmark your potential! Explore examples of top-performing Airbnb properties in Kaprunbased on Trailing Twelve Month (TTM) revenue. Analyze their characteristics, revenue, occupancy rate, and ADR to understand what drives success in this market.

Luxury Chalet with private sauna in Kaprun
Entire Place • 5 bedrooms
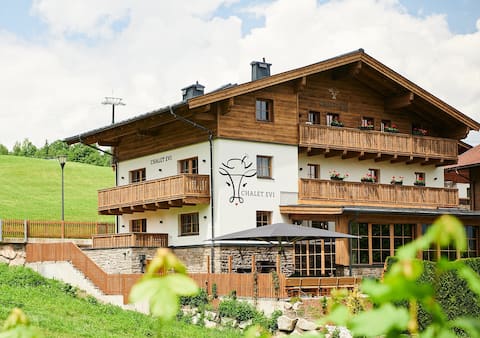
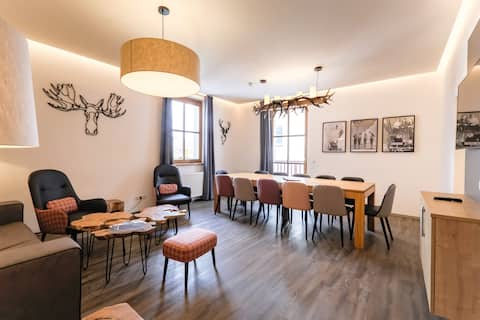
Serviced Luxury Chalet Evi Kaprun
Entire Place • 8 bedrooms
4 Bedroom Apartment w. Sauna KR4 incl. summercard
Entire Place • 4 bedrooms
Perfect location! Chalet Helen 380m2 Air Condition
Entire Place • 5 bedrooms
Penthouse in the heart of Kaprun & stunning view
Entire Place • 2 bedrooms

Haus Almkreek | 400m2 | sauna | WIFI | near center
Entire Place • 9 bedrooms
Note: Performance varies based on location, size, amenities, seasonality, and management quality. Data reflects the past 12 months.
Top Performing Airbnb Hosts in Kaprun (2026)
Learn from the best! This table showcases top-performing Airbnb hosts in Kaprun based on the number of properties managed and estimated total revenue over the past year. Analyze their scale and performance metrics.
| Host Name | Properties | Grossing Revenue | Stay Reviews | Avg Rating |
|---|---|---|---|---|
| Alpin Rentals | 22 | $819,238 | 71 | 4.58/5.0 |
| Bella | 18 | $709,056 | 330 | 4.38/5.0 |
| Sybrand | 13 | $501,466 | 229 | 4.70/5.0 |
| Alex | 9 | $346,110 | 91 | 4.32/5.0 |
| All In One | 16 | $305,935 | 211 | 4.56/5.0 |
| Alpen Apartments | 14 | $215,739 | 156 | 4.35/5.0 |
| Jerry&Els | 3 | $184,125 | 14 | 4.77/5.0 |
| Chantal Villa For You | 4 | $178,273 | 34 | 4.39/5.0 |
| Christoph - Interhome | 5 | $171,952 | 80 | 4.71/5.0 |
| Via Montes E.U. | 4 | $132,709 | 136 | 4.63/5.0 |
Analyzing the strategies of top hosts, such as their property selection, pricing, and guest communication, can offer valuable lessons for optimizing your own Airbnb operations in Kaprun.
Dive Deeper: Advanced Kaprun STR Market Data (2026)
Ready to unlock more insights? AirROI provides access to advanced metrics and comprehensive Airbnb data for Kaprun. Explore detailed analytics beyond this report to refine your investment strategy, optimize pricing, and maximize your vacation rental profits.
Explore Advanced MetricsKaprun Short-Term Rental Market Composition (2026): Property & Room Types
Room Type Distribution
Property Type Distribution
Market Composition Insights for Kaprun
- The Kaprun Airbnb market composition is heavily skewed towards Entire Home/Apt listings, which make up 94.2% of the 207 active rentals. This indicates strong guest preference for privacy and space.
- Looking at the property type distribution in Kaprun, Apartment/Condo properties are the most common (81.6%), reflecting the local real estate landscape.
- Houses represent a significant 16.9% portion, catering likely to families or larger groups.
- Smaller segments like hotel/boutique (combined 1.4%) offer potential for unique stay experiences.
Kaprun Airbnb Room Capacity Analysis (2026): Bedroom Distribution
Distribution of Listings by Number of Bedrooms
Room Capacity Insights for Kaprun
- The dominant room capacity in Kaprun is 1 bedroom listings, making up 30.4% of the market. This suggests a strong demand for properties suitable for couples or solo travelers.
- Together, 1 bedroom and 2 bedrooms properties represent 60.4% of the active Airbnb listings in Kaprun, indicating a high concentration in these sizes.
- A significant 28.5% of listings offer 3+ bedrooms, catering to larger groups and families seeking more space in Kaprun.
Kaprun Vacation Rental Guest Capacity Trends (2026)
Distribution of Listings by Guest Capacity
Guest Capacity Insights for Kaprun
- The most common guest capacity trend in Kaprun vacation rentals is listings accommodating 4 guests (28%). This suggests the primary traveler segment is likely small families or groups.
- Properties designed for 4 guests and 8+ guests dominate the Kaprun STR market, accounting for 51.7% of listings.
- 47.3% of properties accommodate 6+ guests, serving the market segment for larger families or group travel in Kaprun.
- On average, properties in Kaprun are equipped to host 5.2 guests.
Kaprun Airbnb Booking Patterns (2026): Available vs. Booked Days
Available Days Distribution
Booked Days Distribution
Booking Pattern Insights for Kaprun
- The most common availability pattern in Kaprun falls within the 271-366 days range, representing 62.3% of listings. This suggests many properties have significant open periods on their calendars.
- Approximately 93.7% of listings show high availability (181+ days open annually), indicating potential for increased bookings or specific owner usage patterns.
- For booked days, the 31-90 days range is most frequent in Kaprun (39.6%), reflecting common guest stay durations or potential owner blocking patterns.
- A notable 6.7% of properties secure long booking periods (181+ days booked per year), highlighting successful long-term rental strategies or significant owner usage.
Kaprun Airbnb Minimum Stay Requirements Analysis
Distribution of Listings by Minimum Night Requirement
1 Night
6 listings
2.9% of total
2 Nights
13 listings
6.3% of total
3 Nights
8 listings
3.9% of total
4-6 Nights
19 listings
9.2% of total
7-29 Nights
5 listings
2.4% of total
30+ Nights
156 listings
75.4% of total
Key Insights
- The most prevalent minimum stay requirement in Kaprun is 30+ Nights, adopted by 75.4% of listings. This highlights the market's preference for longer commitments.
- Very short stays (1-2 nights) are less common (9.2%), suggesting hosts prefer slightly longer bookings to optimize turnover.
- A significant segment (75.4%) caters to monthly stays (30+ nights) in Kaprun, pointing to opportunities in the extended-stay market.
Recommendations
- Align with the market by considering a 30+ Nights minimum stay, as 75.4% of Kaprun hosts use this setting.
- If feasible, allowing 1-night stays, especially midweek or during low season, could capture last-minute bookings, as only 2.9% currently do.
- Explore offering discounts for stays of 30+ nights to attract the 75.4% of the market seeking extended stays.
- Adjust minimum nights based on seasonality – potentially shorter during low season and longer during peak demand periods in Kaprun.
Kaprun Airbnb Cancellation Policy Trends Analysis (2026)
Super Strict 30 Days
31 listings
15% of total
Limited
21 listings
10.1% of total
Super Strict 60 Days
18 listings
8.7% of total
Flexible
2 listings
1% of total
Moderate
28 listings
13.5% of total
Firm
74 listings
35.7% of total
Strict
33 listings
15.9% of total
Cancellation Policy Insights for Kaprun
- The prevailing Airbnb cancellation policy trend in Kaprun is Firm, used by 35.7% of listings.
- A majority (51.6%) of hosts in Kaprun utilize Firm or Strict policies, indicating a market where hosts prioritize booking security.
Recommendations for Hosts
- Consider adopting a Firm policy to align with the 35.7% market standard in Kaprun.
- Regularly review your cancellation policy against competitors and market demand shifts in Kaprun.
Kaprun STR Booking Lead Time Analysis (2026)
Average Booking Lead Time by Month
Booking Lead Time Insights for Kaprun
- The overall average booking lead time for vacation rentals in Kaprun is 73 days.
- Guests book furthest in advance for stays during January (average 102 days), likely coinciding with peak travel demand or local events.
- The shortest booking windows occur for stays in October (average 41 days), indicating more last-minute travel plans during this time.
- Seasonally, Winter (95 days avg.) sees the longest lead times, while Fall (51 days avg.) has the shortest, reflecting typical travel planning cycles.
Recommendations for Hosts
- Use the overall average lead time (73 days) as a baseline for your pricing and availability strategy in Kaprun.
- For January stays, consider implementing length-of-stay discounts or slightly higher rates for bookings made less than 102 days out to capitalize on advance planning.
- Target marketing efforts for the Winter season well in advance (at least 95 days) to capture early planners.
- Monitor your own booking lead times against these Kaprun averages to identify opportunities for dynamic pricing adjustments.
Popular & Essential Airbnb Amenities in Kaprun (2026)
Amenity Prevalence
Amenity Insights for Kaprun
- Essential amenities in Kaprun that guests expect include: TV, Wifi, Heating. Lacking these (any) could significantly impact bookings.
- Popular amenities like Kitchen, Free parking on premises, Dishes and silverware are common but not universal. Offering these can provide a competitive edge.
Recommendations for Hosts
- Ensure your listing includes all essential amenities for Kaprun: TV, Wifi, Heating.
- Prioritize adding missing essentials: TV, Wifi, Heating.
- Consider adding popular differentiators like Kitchen or Free parking on premises to increase appeal.
- Highlight unique or less common amenities you offer (e.g., hot tub, dedicated workspace, EV charger) in your listing description and photos.
- Regularly check competitor amenities in Kaprun to stay competitive.
Kaprun Airbnb Guest Demographics & Profile Analysis (2026)
Guest Profile Summary for Kaprun
- The typical guest profile for Airbnb in Kaprun consists of predominantly international visitors (97%), with top international origins including Netherlands, typically belonging to the Post-2000s (Gen Z/Alpha) group (50%), primarily speaking English or German.
- Domestic travelers account for 2.9% of guests.
- Key international markets include Germany (30.3%) and Netherlands (15.3%).
- Top languages spoken are English (40.3%) followed by German (20.4%).
- A significant demographic segment is the Post-2000s (Gen Z/Alpha) group, representing 50% of guests.
Recommendations for Hosts
- Focus marketing internationally, particularly towards travelers from Netherlands.
- Tailor amenities and listing descriptions to appeal to the dominant Post-2000s (Gen Z/Alpha) demographic (e.g., highlight fast WiFi, smart home features, local guides).
- Highlight unique local experiences or amenities relevant to the primary guest profile.
- Consider seasonal promotions aligned with peak travel times for key origin markets.
Nearby Short-Term Rental Market Comparison
How does the Kaprun Airbnb market stack up against its neighbors? Compare key performance metrics like average monthly revenue, ADR, and occupancy rates in surrounding areas to understand the broader regional STR landscape.
| Market | Active Properties | Monthly Revenue | Daily Rate | Avg. Occupancy |
|---|---|---|---|---|
| Scheffau am Wilden Kaiser | 12 | $6,669 | $906.83 | 30% |
| Sankt Pankraz - San Pancrazio | 12 | $6,528 | $633.65 | 29% |
| Urtijëi - St. Ulrich in Gröden - Ortisei | 172 | $5,054 | $718.33 | 41% |
| Hallstatt | 31 | $4,918 | $293.92 | 62% |
| Kiens - Chienes | 17 | $3,715 | $377.77 | 48% |
| Cortina d'Ampezzo | 309 | $3,646 | $474.12 | 40% |
| Going am Wilden Kaiser | 27 | $3,596 | $406.50 | 37% |
| Kramsach | 12 | $3,573 | $272.32 | 48% |
| Bayrischzell | 41 | $3,550 | $389.91 | 33% |
| Krimml | 53 | $3,544 | $359.14 | 41% |