Wagga Wagga City Council Airbnb Market Analysis 2026: Short Term Rental Data & Vacation Rental Statistics in New South Wales, Australia
Is Airbnb profitable in Wagga Wagga City Council in 2026? Explore comprehensive Airbnb analytics for Wagga Wagga City Council, New South Wales, Australia to uncover income potential. This 2026 STR market report for Wagga Wagga City Council, based on AirROI data from February 2025 to January 2026, reveals key trends in the market of 283 active listings.
Whether you're considering an Airbnb investment in Wagga Wagga City Council, optimizing your existing vacation rental, or exploring rental arbitrage opportunities, understanding the Wagga Wagga City Council Airbnb data is crucial. Navigating the high regulation landscape is key to maximizing your short term rental income potential. Let's dive into the specifics.
Key Wagga Wagga City Council Airbnb Performance Metrics Overview
Monthly Airbnb Revenue Variations & Income Potential in Wagga Wagga City Council (2026)
Understanding the monthly revenue variations for Airbnb listings in Wagga Wagga City Council is key to maximizing your short term rental income potential. Seasonality significantly impacts earnings. Our analysis, based on data from the past 12 months, shows that the peak revenue month for STRs in Wagga Wagga City Council is typically April, while January often presents the lowest earnings, highlighting opportunities for strategic pricing adjustments during shoulder and low seasons. Explore the typical Airbnb income in Wagga Wagga City Council across different performance tiers:
- Best-in-class properties (Top 10%) achieve $4,951+ monthly, often utilizing dynamic pricing and superior guest experiences.
- Strong performing properties (Top 25%) earn $3,278 or more, indicating effective management and desirable locations/amenities.
- Typical properties (Median) generate around $2,112 per month, representing the average market performance.
- Entry-level properties (Bottom 25%) see earnings around $1,068, often with potential for optimization.
Average Monthly Airbnb Earnings Trend in Wagga Wagga City Council
Wagga Wagga City Council Airbnb Occupancy Rate Trends (2026)
Maximize your bookings by understanding the Wagga Wagga City Council STR occupancy trends. Seasonal demand shifts significantly influence how often properties are booked. Typically, Aprilsees the highest demand (peak season occupancy), while January experiences the lowest (low season). Effective strategies, like adjusting minimum stays or offering promotions, can boost occupancy during slower periods. Here's how different property tiers perform in Wagga Wagga City Council:
- Best-in-class properties (Top 10%) achieve 83%+ occupancy, indicating high desirability and potentially optimized availability.
- Strong performing properties (Top 25%) maintain 68% or higher occupancy, suggesting good market fit and guest satisfaction.
- Typical properties (Median) have an occupancy rate around 43%.
- Entry-level properties (Bottom 25%) average 22% occupancy, potentially facing higher vacancy.
Average Monthly Occupancy Rate Trend in Wagga Wagga City Council
Average Daily Rate (ADR) Airbnb Trends in Wagga Wagga City Council (2026)
Effective short term rental pricing strategy in Wagga Wagga City Council involves understanding monthly ADR fluctuations. The Average Daily Rate (ADR) for Airbnb in Wagga Wagga City Council typically peaks in September and dips lowest during May. Leveraging Airbnb dynamic pricing tools or strategies based on this seasonality can significantly boost revenue. Here's a look at the typical nightly rates achieved:
- Best-in-class properties (Top 10%) command rates of $364+ per night, often due to premium features or locations.
- Strong performing properties (Top 25%) achieve nightly rates of $255 or more.
- Typical properties (Median) charge around $171 per night.
- Entry-level properties (Bottom 25%) earn around $113 per night.
Average Daily Rate (ADR) Trend by Month in Wagga Wagga City Council
Get Live Wagga Wagga City Council Market Intelligence 👇

Explore Real-time Analytics
Airbnb Seasonality Analysis & Trends in Wagga Wagga City Council (2026)
Peak Season (April, September, May)
- Revenue averages $2,945 per month
- Occupancy rates average 50.6%
- Daily rates average $223
Shoulder Season
- Revenue averages $2,548 per month
- Occupancy maintains around 44.9%
- Daily rates hold near $227
Low Season (January, March, November)
- Revenue drops to average $2,208 per month
- Occupancy decreases to average 41.0%
- Daily rates adjust to average $225
Seasonality Insights for Wagga Wagga City Council
- The Airbnb seasonality in Wagga Wagga City Council shows moderate seasonality with distinct peak and low periods. While the sections above show seasonal averages, it's also insightful to look at the extremes:
- During the high season, the absolute peak month showcases Wagga Wagga City Council's highest earning potential, with monthly revenues capable of climbing to $3,214, occupancy reaching a high of 56.3%, and ADRs peaking at $235.
- Conversely, the slowest single month of the year, typically falling within the low season, marks the market's lowest point. In this month, revenue might dip to $1,988, occupancy could drop to 36.0%, and ADRs may adjust down to $215.
- Understanding both the seasonal averages and these monthly peaks and troughs in revenue, occupancy, and ADR is crucial for maximizing your Airbnb profit potential in Wagga Wagga City Council.
Seasonal Strategies for Maximizing Profit
- Peak Season: Maximize revenue through premium pricing and potentially longer minimum stays. Ensure high availability.
- Low Season: Offer competitive pricing, special promotions (e.g., extended stay discounts), and flexible cancellation policies. Target off-season travelers like remote workers or budget-conscious guests.
- Shoulder Seasons: Implement dynamic pricing that balances peak and low rates. Target weekend travelers or specific events. Offer slightly more flexible terms than peak season.
- Regularly analyze your own performance against these Wagga Wagga City Council seasonality benchmarks and adjust your pricing and availability strategy accordingly.
Best Areas for Airbnb Investment in Wagga Wagga City Council (2026)
Exploring the top neighborhoods for short-term rentals in Wagga Wagga City Council? This section highlights key areas, outlining why they are attractive for hosts and guests, along with notable local attractions. Consider these locations based on your target guest profile and investment strategy.
| Neighborhood / Area | Why Host Here? (Target Guests & Appeal) | Key Attractions & Landmarks |
|---|---|---|
| Central Business District | The heart of Wagga Wagga with easy access to shops, restaurants, and tourist attractions. Ideal for business travelers and tourists alike. | Wagga Wagga Civic Theatre, Wagga Wagga Art Gallery, Botanic Gardens, Marrambidya Wetland, Victory Memorial Gardens |
| Kooringal | A suburban area with family-friendly amenities and close proximity to parks and recreation. Attracts families and those looking for a quieter stay. | Kooringal Mall, Kooringal Park, Wagga Wagga Golf Club, Wagga Wagga Baseball Club |
| Estella | A growing suburb known for its peaceful environment and modern amenities. Appeals to longer-term stays and families. | Estella State Forest, Wagga Wagga Country Club, local parks and playgrounds |
| Lake Albert | A picturesque lakeside area perfect for outdoor enthusiasts. Ideal for tourists looking to enjoy water sports and nature. | Lake Albert, Wagga Wagga Boat Club, Walking trails around the lake |
| Narrandera Road | En route to regional attractions, this area offers easy access for travelers exploring the Riverina region. | Wagga Wagga Botanical Gardens, Local vineyards, Haven for road trippers exploring beyond Wagga |
| Springvale | A suburb close to local facilities and schools, appealing to families visiting Wagga Wagga for extended periods. | Springvale Park, Local cafes and shops |
| Turvey Park | A residential area with good access to parks and recreational facilities, making it ideal for families. | Turvey Park, Nearby schools and local shops |
| Bourkelands | A family-friendly suburb with spacious homes and parks. Attractive for longer stays and for guests looking for comfort. | Bourkelands Playground, Local shopping areas, Parks and bike paths |
Understanding Airbnb License Requirements & STR Laws in Wagga Wagga City Council (2026)
Yes, Wagga Wagga City Council, New South Wales, Australia enforces high STR regulations. Obtaining a license and ensuring compliance is almost certainly required according to current 2026 STR laws. Always verify the latest short term rental regulations and Airbnb license requirements directly with local government authorities for Wagga Wagga City Council to ensure full compliance before hosting.
(Source: AirROI data, 2026, based on 95% licensed listings)
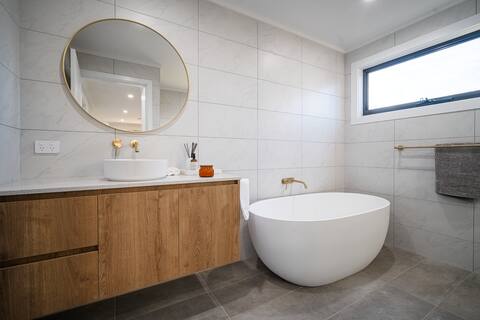
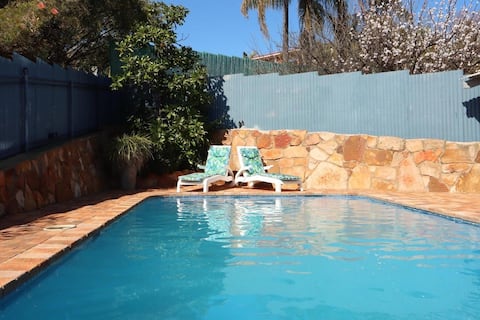
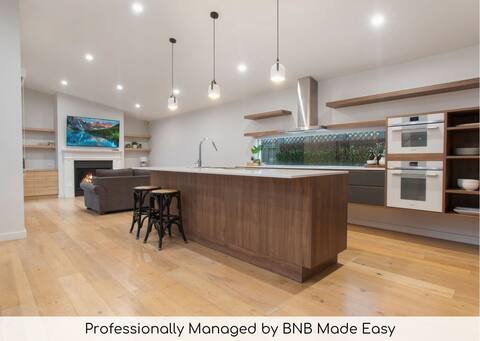
Top Performing Airbnb Properties in Wagga Wagga City Council (2026)
Benchmark your potential! Explore examples of top-performing Airbnb properties in Wagga Wagga City Councilbased on Trailing Twelve Month (TTM) revenue. Analyze their characteristics, revenue, occupancy rate, and ADR to understand what drives success in this market.
Elegance and style 2
Entire Place • 3 bedrooms

Elegance
Entire Place • 3 bedrooms
Large 5 bedroom family home.
Entire Place • 5 bedrooms
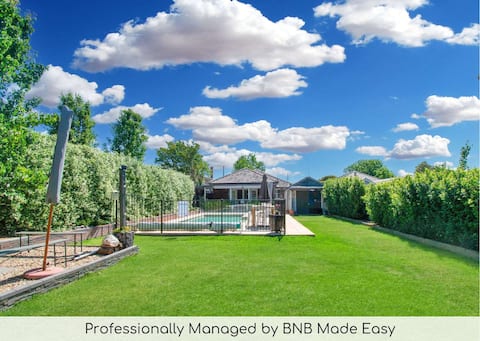
The Macleay | Poolside Entertainer, Pets Allowed
Entire Place • 4 bedrooms
Thorne St Luxe Loft | CBD Location, Modern Design
Entire Place • 5 bedrooms
4 Bedroom Executive City Apartment!
Entire Place • 4 bedrooms
Note: Performance varies based on location, size, amenities, seasonality, and management quality. Data reflects the past 12 months.
Top Performing Airbnb Hosts in Wagga Wagga City Council (2026)
Learn from the best! This table showcases top-performing Airbnb hosts in Wagga Wagga City Council based on the number of properties managed and estimated total revenue over the past year. Analyze their scale and performance metrics.
| Host Name | Properties | Grossing Revenue | Stay Reviews | Avg Rating |
|---|---|---|---|---|
| BNB Made Easy: Timmy | 31 | $1,158,236 | 531 | 4.81/5.0 |
| Glen | 33 | $529,030 | 507 | 4.69/5.0 |
| Jenni | 10 | $505,818 | 758 | 4.95/5.0 |
| Tom | 2 | $273,817 | 38 | 4.84/5.0 |
| Wayne | 7 | $218,885 | 254 | 4.96/5.0 |
| Briony | 4 | $169,115 | 333 | 4.93/5.0 |
| Ruth | 6 | $150,188 | 642 | 4.72/5.0 |
| Leanne And Andrew | 1 | $97,893 | 60 | 5.00/5.0 |
| Grant | 3 | $97,003 | 831 | 4.91/5.0 |
| Claremont Hospitality Group | 3 | $95,108 | 90 | 4.91/5.0 |
Analyzing the strategies of top hosts, such as their property selection, pricing, and guest communication, can offer valuable lessons for optimizing your own Airbnb operations in Wagga Wagga City Council.
Dive Deeper: Advanced Wagga Wagga City Council STR Market Data (2026)
Ready to unlock more insights? AirROI provides access to advanced metrics and comprehensive Airbnb data for Wagga Wagga City Council. Explore detailed analytics beyond this report to refine your investment strategy, optimize pricing, and maximize your vacation rental profits.
Explore Advanced MetricsWagga Wagga City Council Short-Term Rental Market Composition (2026): Property & Room Types
Room Type Distribution
Property Type Distribution
Market Composition Insights for Wagga Wagga City Council
- The Wagga Wagga City Council Airbnb market composition is heavily skewed towards Entire Home/Apt listings, which make up 86.6% of the 283 active rentals. This indicates strong guest preference for privacy and space.
- Looking at the property type distribution in Wagga Wagga City Council, House properties are the most common (54.1%), reflecting the local real estate landscape.
- Houses represent a significant 54.1% portion, catering likely to families or larger groups.
- The presence of 11.3% Hotel/Boutique listings indicates integration with traditional hospitality.
- Smaller segments like others (combined 3.5%) offer potential for unique stay experiences.
Wagga Wagga City Council Airbnb Room Capacity Analysis (2026): Bedroom Distribution
Distribution of Listings by Number of Bedrooms
Room Capacity Insights for Wagga Wagga City Council
- The dominant room capacity in Wagga Wagga City Council is 3 bedrooms listings, making up 26.5% of the market. This suggests a strong demand for properties suitable for families or small groups.
- Together, 3 bedrooms and 2 bedrooms properties represent 49.8% of the active Airbnb listings in Wagga Wagga City Council, indicating a high concentration in these sizes.
- A significant 46.2% of listings offer 3+ bedrooms, catering to larger groups and families seeking more space in Wagga Wagga City Council.
Wagga Wagga City Council Vacation Rental Guest Capacity Trends (2026)
Distribution of Listings by Guest Capacity
Guest Capacity Insights for Wagga Wagga City Council
- The most common guest capacity trend in Wagga Wagga City Council vacation rentals is listings accommodating 6 guests (24.4%). This suggests the primary traveler segment is likely larger groups.
- Properties designed for 6 guests and 4 guests dominate the Wagga Wagga City Council STR market, accounting for 47.0% of listings.
- 47.7% of properties accommodate 6+ guests, serving the market segment for larger families or group travel in Wagga Wagga City Council.
- On average, properties in Wagga Wagga City Council are equipped to host 4.8 guests.
Wagga Wagga City Council Airbnb Booking Patterns (2026): Available vs. Booked Days
Available Days Distribution
Booked Days Distribution
Booking Pattern Insights for Wagga Wagga City Council
- The most common availability pattern in Wagga Wagga City Council falls within the 271-366 days range, representing 41% of listings. This suggests many properties have significant open periods on their calendars.
- Approximately 68.2% of listings show high availability (181+ days open annually), indicating potential for increased bookings or specific owner usage patterns.
- For booked days, the 91-180 days range is most frequent in Wagga Wagga City Council (28.3%), reflecting common guest stay durations or potential owner blocking patterns.
- A notable 32.1% of properties secure long booking periods (181+ days booked per year), highlighting successful long-term rental strategies or significant owner usage.
Wagga Wagga City Council Airbnb Minimum Stay Requirements Analysis
Distribution of Listings by Minimum Night Requirement
1 Night
105 listings
37.1% of total
2 Nights
50 listings
17.7% of total
3 Nights
3 listings
1.1% of total
4-6 Nights
7 listings
2.5% of total
7-29 Nights
41 listings
14.5% of total
30+ Nights
77 listings
27.2% of total
Key Insights
- The most prevalent minimum stay requirement in Wagga Wagga City Council is 1 Night, adopted by 37.1% of listings. This highlights the market's preference for shorter, flexible bookings.
- A significant segment (27.2%) caters to monthly stays (30+ nights) in Wagga Wagga City Council, pointing to opportunities in the extended-stay market.
Recommendations
- Align with the market by considering a 1 Night minimum stay, as 37.1% of Wagga Wagga City Council hosts use this setting.
- Explore offering discounts for stays of 30+ nights to attract the 27.2% of the market seeking extended stays.
- Adjust minimum nights based on seasonality – potentially shorter during low season and longer during peak demand periods in Wagga Wagga City Council.
Wagga Wagga City Council Airbnb Cancellation Policy Trends Analysis (2026)
Limited
3 listings
1.1% of total
Flexible
115 listings
40.6% of total
Moderate
129 listings
45.6% of total
Firm
29 listings
10.2% of total
Strict
7 listings
2.5% of total
Cancellation Policy Insights for Wagga Wagga City Council
- The prevailing Airbnb cancellation policy trend in Wagga Wagga City Council is Moderate, used by 45.6% of listings.
- The market strongly favors guest-friendly terms, with 86.2% of listings offering Flexible or Moderate policies. This suggests guests in Wagga Wagga City Council may expect booking flexibility.
- Strict cancellation policies are quite rare (2.5%), potentially making listings with this policy less competitive unless justified by high demand or property type.
Recommendations for Hosts
- Consider adopting a Moderate policy to align with the 45.6% market standard in Wagga Wagga City Council.
- Using a Strict policy might deter some guests, as only 2.5% of listings use it. Evaluate if potential revenue protection outweighs possible lower booking rates.
- Regularly review your cancellation policy against competitors and market demand shifts in Wagga Wagga City Council.
Wagga Wagga City Council STR Booking Lead Time Analysis (2026)
Average Booking Lead Time by Month
Booking Lead Time Insights for Wagga Wagga City Council
- The overall average booking lead time for vacation rentals in Wagga Wagga City Council is 48 days.
- Guests book furthest in advance for stays during October (average 69 days), likely coinciding with peak travel demand or local events.
- The shortest booking windows occur for stays in July (average 28 days), indicating more last-minute travel plans during this time.
- Seasonally, Fall (58 days avg.) sees the longest lead times, while Summer (32 days avg.) has the shortest, reflecting typical travel planning cycles.
Recommendations for Hosts
- Use the overall average lead time (48 days) as a baseline for your pricing and availability strategy in Wagga Wagga City Council.
- For October stays, consider implementing length-of-stay discounts or slightly higher rates for bookings made less than 69 days out to capitalize on advance planning.
- Target marketing efforts for the Fall season well in advance (at least 58 days) to capture early planners.
- Monitor your own booking lead times against these Wagga Wagga City Council averages to identify opportunities for dynamic pricing adjustments.
Popular & Essential Airbnb Amenities in Wagga Wagga City Council (2026)
Amenity Prevalence
Amenity Insights for Wagga Wagga City Council
- Essential amenities in Wagga Wagga City Council that guests expect include: Air conditioning, Smoke alarm, TV. Lacking these (any) could significantly impact bookings.
- Popular amenities like Free parking on premises, Heating, Wifi are common but not universal. Offering these can provide a competitive edge.
- Warning: Wifi is not universally provided but is considered essential globally. Ensure reliable Wifi is offered.
Recommendations for Hosts
- Ensure your listing includes all essential amenities for Wagga Wagga City Council: Air conditioning, Smoke alarm, TV.
- Prioritize adding missing essentials: Air conditioning, Smoke alarm, TV.
- Consider adding popular differentiators like Free parking on premises or Heating to increase appeal.
- Highlight unique or less common amenities you offer (e.g., hot tub, dedicated workspace, EV charger) in your listing description and photos.
- Regularly check competitor amenities in Wagga Wagga City Council to stay competitive.
Wagga Wagga City Council Airbnb Guest Demographics & Profile Analysis (2026)
Guest Profile Summary for Wagga Wagga City Council
- The typical guest profile for Airbnb in Wagga Wagga City Council consists of primarily domestic travelers (95%), often arriving from nearby Sydney, typically belonging to the Post-2000s (Gen Z/Alpha) group (50%), primarily speaking English or Chinese.
- Domestic travelers account for 95.1% of guests.
- Key international markets include Australia (95.1%) and United Kingdom (1.1%).
- Top languages spoken are English (76.8%) followed by Chinese (3%).
- A significant demographic segment is the Post-2000s (Gen Z/Alpha) group, representing 50% of guests.
Recommendations for Hosts
- Target domestic marketing efforts towards travelers from Sydney and New South Wales.
- Tailor amenities and listing descriptions to appeal to the dominant Post-2000s (Gen Z/Alpha) demographic (e.g., highlight fast WiFi, smart home features, local guides).
- Highlight unique local experiences or amenities relevant to the primary guest profile.
- Consider seasonal promotions aligned with peak travel times for key origin markets.
Nearby Short-Term Rental Market Comparison
How does the Wagga Wagga City Council Airbnb market stack up against its neighbors? Compare key performance metrics like average monthly revenue, ADR, and occupancy rates in surrounding areas to understand the broader regional STR landscape.
| Market | Active Properties | Monthly Revenue | Daily Rate | Avg. Occupancy |
|---|---|---|---|---|
| Snowy Monaro Regional Council | 228 | $3,405 | $386.39 | 35% |
| East Jindabyne | 125 | $3,146 | $402.31 | 37% |
| Bright | 492 | $2,935 | $281.84 | 38% |
| Thredbo | 283 | $2,767 | $518.96 | 27% |
| Yarrawonga | 109 | $2,674 | $380.30 | 30% |
| Falls Creek | 48 | $2,589 | $433.92 | 31% |
| Beechworth | 123 | $2,577 | $249.85 | 39% |
| Anglers Reach | 12 | $2,537 | $247.74 | 41% |
| Porepunkah | 41 | $2,532 | $329.06 | 33% |
| Whitfield | 21 | $2,445 | $249.07 | 43% |