South West Rocks Airbnb Market Analysis 2026: Short Term Rental Data & Vacation Rental Statistics in New South Wales, Australia
Is Airbnb profitable in South West Rocks in 2026? Explore comprehensive Airbnb analytics for South West Rocks, New South Wales, Australia to uncover income potential. This 2026 STR market report for South West Rocks, based on AirROI data from February 2025 to January 2026, reveals key trends in the niche market of 174 active listings.
Whether you're considering an Airbnb investment in South West Rocks, optimizing your existing vacation rental, or exploring rental arbitrage opportunities, understanding the South West Rocks Airbnb data is crucial. Navigating the high regulation landscape is key to maximizing your short term rental income potential. Let's dive into the specifics.
Key South West Rocks Airbnb Performance Metrics Overview
Monthly Airbnb Revenue Variations & Income Potential in South West Rocks (2026)
Understanding the monthly revenue variations for Airbnb listings in South West Rocks is key to maximizing your short term rental income potential. Seasonality significantly impacts earnings. Our analysis, based on data from the past 12 months, shows that the peak revenue month for STRs in South West Rocks is typically December, while May often presents the lowest earnings, highlighting opportunities for strategic pricing adjustments during shoulder and low seasons. Explore the typical Airbnb income in South West Rocks across different performance tiers:
- Best-in-class properties (Top 10%) achieve $3,945+ monthly, often utilizing dynamic pricing and superior guest experiences.
- Strong performing properties (Top 25%) earn $2,653 or more, indicating effective management and desirable locations/amenities.
- Typical properties (Median) generate around $1,452 per month, representing the average market performance.
- Entry-level properties (Bottom 25%) see earnings around $707, often with potential for optimization.
Average Monthly Airbnb Earnings Trend in South West Rocks
South West Rocks Airbnb Occupancy Rate Trends (2026)
Maximize your bookings by understanding the South West Rocks STR occupancy trends. Seasonal demand shifts significantly influence how often properties are booked. Typically, Februarysees the highest demand (peak season occupancy), while May experiences the lowest (low season). Effective strategies, like adjusting minimum stays or offering promotions, can boost occupancy during slower periods. Here's how different property tiers perform in South West Rocks:
- Best-in-class properties (Top 10%) achieve 72%+ occupancy, indicating high desirability and potentially optimized availability.
- Strong performing properties (Top 25%) maintain 52% or higher occupancy, suggesting good market fit and guest satisfaction.
- Typical properties (Median) have an occupancy rate around 30%.
- Entry-level properties (Bottom 25%) average 15% occupancy, potentially facing higher vacancy.
Average Monthly Occupancy Rate Trend in South West Rocks
Average Daily Rate (ADR) Airbnb Trends in South West Rocks (2026)
Effective short term rental pricing strategy in South West Rocks involves understanding monthly ADR fluctuations. The Average Daily Rate (ADR) for Airbnb in South West Rocks typically peaks in January and dips lowest during May. Leveraging Airbnb dynamic pricing tools or strategies based on this seasonality can significantly boost revenue. Here's a look at the typical nightly rates achieved:
- Best-in-class properties (Top 10%) command rates of $282+ per night, often due to premium features or locations.
- Strong performing properties (Top 25%) achieve nightly rates of $209 or more.
- Typical properties (Median) charge around $158 per night.
- Entry-level properties (Bottom 25%) earn around $122 per night.
Average Daily Rate (ADR) Trend by Month in South West Rocks
Get Live South West Rocks Market Intelligence 👇

Explore Real-time Analytics
Airbnb Seasonality Analysis & Trends in South West Rocks (2026)
Peak Season (December, April, January)
- Revenue averages $2,535 per month
- Occupancy rates average 40.7%
- Daily rates average $203
Shoulder Season
- Revenue averages $1,991 per month
- Occupancy maintains around 37.5%
- Daily rates hold near $179
Low Season (May, June, August)
- Revenue drops to average $1,209 per month
- Occupancy decreases to average 24.6%
- Daily rates adjust to average $164
Seasonality Insights for South West Rocks
- The Airbnb seasonality in South West Rocks shows highly seasonal trends requiring careful strategy. While the sections above show seasonal averages, it's also insightful to look at the extremes:
- During the high season, the absolute peak month showcases South West Rocks's highest earning potential, with monthly revenues capable of climbing to $2,685, occupancy reaching a high of 48.4%, and ADRs peaking at $220.
- Conversely, the slowest single month of the year, typically falling within the low season, marks the market's lowest point. In this month, revenue might dip to $1,056, occupancy could drop to 21.8%, and ADRs may adjust down to $160.
- Understanding both the seasonal averages and these monthly peaks and troughs in revenue, occupancy, and ADR is crucial for maximizing your Airbnb profit potential in South West Rocks.
Seasonal Strategies for Maximizing Profit
- Peak Season: Maximize revenue through premium pricing and potentially longer minimum stays. Ensure high availability.
- Low Season: Offer competitive pricing, special promotions (e.g., extended stay discounts), and flexible cancellation policies. Target off-season travelers like remote workers or budget-conscious guests.
- Shoulder Seasons: Implement dynamic pricing that balances peak and low rates. Target weekend travelers or specific events. Offer slightly more flexible terms than peak season.
- Regularly analyze your own performance against these South West Rocks seasonality benchmarks and adjust your pricing and availability strategy accordingly.
Best Areas for Airbnb Investment in South West Rocks (2026)
Exploring the top neighborhoods for short-term rentals in South West Rocks? This section highlights key areas, outlining why they are attractive for hosts and guests, along with notable local attractions. Consider these locations based on your target guest profile and investment strategy.
| Neighborhood / Area | Why Host Here? (Target Guests & Appeal) | Key Attractions & Landmarks |
|---|---|---|
| Corrindi Road | Close proximity to the beach and local amenities, making it a favored choice for tourists seeking convenience and comfort. | South West Rocks Beach, Fish Rock Cave, Trial Bay Gaol, South West Rocks Lighthouse, Little Bay |
| South West Rocks Beachfront | Stunning beach views and direct beach access, ideal for holidaymakers looking for a relaxing getaway. | Beachfront restaurants, Rocky Beach, Surfing spots, Fishing areas, Scenic walking trails |
| Trial Bay | A picturesque area known for its scenic beauty and historical site, attracting visitors interested in nature and history. | Trial Bay Gaol, Historical landmarks, Pristine beaches, Picnic areas, Walking trails |
| Kayaking & Dolphin Watching Area | Unique outdoor experiences available for water sports enthusiasts and wildlife lovers, drawing adventure seekers. | Dolphin spotting, Kayaking tours, Snorkeling, Fishing, Scenic boat rides |
| Local Shops and Cafes | A vibrant local hub, perfect for guests wanting to experience the local culture and cuisine. | Cafes and restaurants, Boutique shops, Local markets, Art galleries, Community events |
| Heritage Walks | Rich in history and natural beauty, attracting those interested in walking tours and local heritage. | Heritage-listed sites, Aboriginal history, Scenic viewpoints, Nature walks, Botanicals |
| Family-Friendly Parks | Ideal for families traveling with children, providing recreational activities and safe environments. | Playgrounds, Picnic areas, Barbecue facilities, Family events, Nature explorations |
| Nearby National Parks | Offers nature enthusiasts a wild escape, attracting visitors interested in hiking and exploring Australia's unique flora and fauna. | Hat Head National Park, Bellinger River National Park, Park walking trails, Nature reserves, Wildlife watching |
Understanding Airbnb License Requirements & STR Laws in South West Rocks (2026)
Yes, South West Rocks, New South Wales, Australia enforces high STR regulations. Obtaining a license and ensuring compliance is almost certainly required according to current 2026 STR laws. Always verify the latest short term rental regulations and Airbnb license requirements directly with local government authorities for South West Rocks to ensure full compliance before hosting.
(Source: AirROI data, 2026, based on 97% licensed listings)
Top Performing Airbnb Properties in South West Rocks (2026)
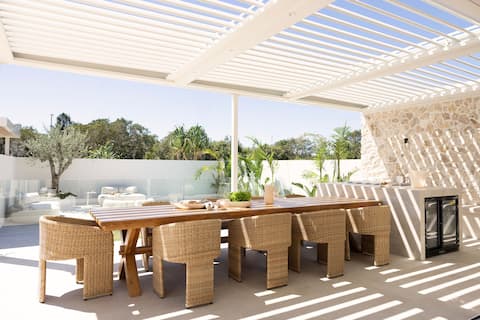
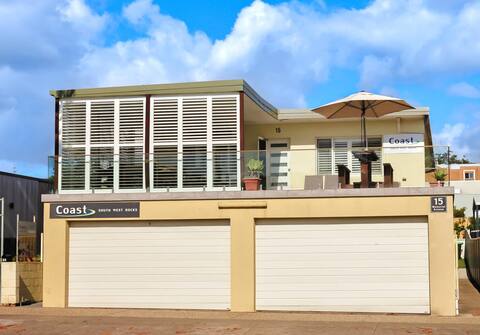
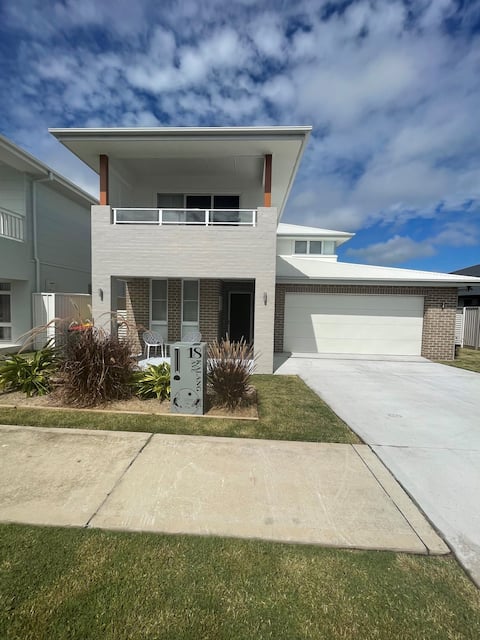
Benchmark your potential! Explore examples of top-performing Airbnb properties in South West Rocksbased on Trailing Twelve Month (TTM) revenue. Analyze their characteristics, revenue, occupancy rate, and ADR to understand what drives success in this market.

SWR House ~ home by the sea with sauna
Entire Place • 3 bedrooms

🏖Beachfront South West Rocks 🏖 ABSOLUTE BEACHFRONT
Entire Place • 2 bedrooms
Luxury Beach House with Pool – Solace SWR
Entire Place • 5 bedrooms
WholeTopFloor Modern Central Ocean View -HUGE DECK
Entire Place • 4 bedrooms

Luxury family & pet friendly house 500m from beach
Entire Place • 3 bedrooms
Reelaxing@TheRocks
Entire Place • 4 bedrooms
Note: Performance varies based on location, size, amenities, seasonality, and management quality. Data reflects the past 12 months.
Top Performing Airbnb Hosts in South West Rocks (2026)
Learn from the best! This table showcases top-performing Airbnb hosts in South West Rocks based on the number of properties managed and estimated total revenue over the past year. Analyze their scale and performance metrics.
| Host Name | Properties | Grossing Revenue | Stay Reviews | Avg Rating |
|---|---|---|---|---|
| SouthWest Rocks Accommodation | 72 | $644,802 | 159 | 4.57/5.0 |
| Lifestyle | 29 | $385,495 | 293 | 4.58/5.0 |
| Candace | 4 | $119,240 | 554 | 4.79/5.0 |
| James | 3 | $108,357 | 539 | 4.86/5.0 |
| Ingenia South West Rocks | 10 | $105,924 | 70 | 4.66/5.0 |
| Michelle | 1 | $68,783 | 57 | 4.95/5.0 |
| Lachy | 2 | $67,176 | 145 | 4.89/5.0 |
| Chris | 1 | $62,567 | 295 | 4.94/5.0 |
| Atters | 1 | $60,769 | 141 | 4.94/5.0 |
| Leah | 1 | $47,266 | 89 | 4.98/5.0 |
Analyzing the strategies of top hosts, such as their property selection, pricing, and guest communication, can offer valuable lessons for optimizing your own Airbnb operations in South West Rocks.
Dive Deeper: Advanced South West Rocks STR Market Data (2026)
Ready to unlock more insights? AirROI provides access to advanced metrics and comprehensive Airbnb data for South West Rocks. Explore detailed analytics beyond this report to refine your investment strategy, optimize pricing, and maximize your vacation rental profits.
Explore Advanced MetricsSouth West Rocks Short-Term Rental Market Composition (2026): Property & Room Types
Room Type Distribution
Property Type Distribution
Market Composition Insights for South West Rocks
- The South West Rocks Airbnb market composition is heavily skewed towards Entire Home/Apt listings, which make up 99.4% of the 174 active rentals. This indicates strong guest preference for privacy and space.
- Looking at the property type distribution in South West Rocks, Apartment/Condo properties are the most common (47.1%), reflecting the local real estate landscape.
- Houses represent a significant 42.5% portion, catering likely to families or larger groups.
- Smaller segments like others, hotel/boutique (combined 2.8%) offer potential for unique stay experiences.
South West Rocks Airbnb Room Capacity Analysis (2026): Bedroom Distribution
Distribution of Listings by Number of Bedrooms
Room Capacity Insights for South West Rocks
- The dominant room capacity in South West Rocks is 2 bedrooms listings, making up 45.4% of the market. This suggests a strong demand for properties suitable for couples or solo travelers.
- Together, 2 bedrooms and 3 bedrooms properties represent 78.2% of the active Airbnb listings in South West Rocks, indicating a high concentration in these sizes.
- A significant 43.7% of listings offer 3+ bedrooms, catering to larger groups and families seeking more space in South West Rocks.
South West Rocks Vacation Rental Guest Capacity Trends (2026)
Distribution of Listings by Guest Capacity
Guest Capacity Insights for South West Rocks
- The most common guest capacity trend in South West Rocks vacation rentals is listings accommodating 6 guests (28.7%). This suggests the primary traveler segment is likely larger groups.
- Properties designed for 6 guests and 4 guests dominate the South West Rocks STR market, accounting for 46.5% of listings.
- 55.1% of properties accommodate 6+ guests, serving the market segment for larger families or group travel in South West Rocks.
- On average, properties in South West Rocks are equipped to host 5.6 guests.
South West Rocks Airbnb Booking Patterns (2026): Available vs. Booked Days
Available Days Distribution
Booked Days Distribution
Booking Pattern Insights for South West Rocks
- The most common availability pattern in South West Rocks falls within the 271-366 days range, representing 68.4% of listings. This suggests many properties have significant open periods on their calendars.
- Approximately 89.7% of listings show high availability (181+ days open annually), indicating potential for increased bookings or specific owner usage patterns.
- For booked days, the 31-90 days range is most frequent in South West Rocks (52.3%), reflecting common guest stay durations or potential owner blocking patterns.
- A notable 10.9% of properties secure long booking periods (181+ days booked per year), highlighting successful long-term rental strategies or significant owner usage.
South West Rocks Airbnb Minimum Stay Requirements Analysis
Distribution of Listings by Minimum Night Requirement
1 Night
12 listings
6.9% of total
2 Nights
16 listings
9.2% of total
3 Nights
53 listings
30.5% of total
4-6 Nights
16 listings
9.2% of total
7-29 Nights
9 listings
5.2% of total
30+ Nights
68 listings
39.1% of total
Key Insights
- The most prevalent minimum stay requirement in South West Rocks is 30+ Nights, adopted by 39.1% of listings. This highlights the market's preference for longer commitments.
- Very short stays (1-2 nights) are less common (16.1%), suggesting hosts prefer slightly longer bookings to optimize turnover.
- A significant segment (39.1%) caters to monthly stays (30+ nights) in South West Rocks, pointing to opportunities in the extended-stay market.
Recommendations
- Align with the market by considering a 30+ Nights minimum stay, as 39.1% of South West Rocks hosts use this setting.
- If feasible, allowing 1-night stays, especially midweek or during low season, could capture last-minute bookings, as only 6.9% currently do.
- Explore offering discounts for stays of 30+ nights to attract the 39.1% of the market seeking extended stays.
- Adjust minimum nights based on seasonality – potentially shorter during low season and longer during peak demand periods in South West Rocks.
South West Rocks Airbnb Cancellation Policy Trends Analysis (2026)
Super Strict 30 Days
72 listings
41.4% of total
Super Strict 60 Days
30 listings
17.2% of total
Limited
1 listings
0.6% of total
Flexible
9 listings
5.2% of total
Moderate
28 listings
16.1% of total
Firm
27 listings
15.5% of total
Strict
7 listings
4% of total
Cancellation Policy Insights for South West Rocks
- The prevailing Airbnb cancellation policy trend in South West Rocks is Super Strict 30 Days, used by 41.4% of listings.
- There's a relatively balanced mix between guest-friendly (21.3%) and stricter (19.5%) policies, offering choices for different guest needs.
- Strict cancellation policies are quite rare (4%), potentially making listings with this policy less competitive unless justified by high demand or property type.
Recommendations for Hosts
- Consider adopting a Super Strict 30 Days policy to align with the 41.4% market standard in South West Rocks.
- Using a Strict policy might deter some guests, as only 4% of listings use it. Evaluate if potential revenue protection outweighs possible lower booking rates.
- Regularly review your cancellation policy against competitors and market demand shifts in South West Rocks.
South West Rocks STR Booking Lead Time Analysis (2026)
Average Booking Lead Time by Month
Booking Lead Time Insights for South West Rocks
- The overall average booking lead time for vacation rentals in South West Rocks is 74 days.
- Guests book furthest in advance for stays during January (average 135 days), likely coinciding with peak travel demand or local events.
- The shortest booking windows occur for stays in May (average 45 days), indicating more last-minute travel plans during this time.
- Seasonally, Winter (92 days avg.) sees the longest lead times, while Spring (54 days avg.) has the shortest, reflecting typical travel planning cycles.
Recommendations for Hosts
- Use the overall average lead time (74 days) as a baseline for your pricing and availability strategy in South West Rocks.
- For January stays, consider implementing length-of-stay discounts or slightly higher rates for bookings made less than 135 days out to capitalize on advance planning.
- Target marketing efforts for the Winter season well in advance (at least 92 days) to capture early planners.
- Monitor your own booking lead times against these South West Rocks averages to identify opportunities for dynamic pricing adjustments.
Popular & Essential Airbnb Amenities in South West Rocks (2026)
Amenity Prevalence
Amenity Insights for South West Rocks
- Popular amenities like Washer, TV, Air conditioning are common but not universal. Offering these can provide a competitive edge.
- Warning: Wifi is not universally provided but is considered essential globally. Ensure reliable Wifi is offered.
Recommendations for Hosts
- Consider adding popular differentiators like Washer or TV to increase appeal.
- Highlight unique or less common amenities you offer (e.g., hot tub, dedicated workspace, EV charger) in your listing description and photos.
- Regularly check competitor amenities in South West Rocks to stay competitive.
South West Rocks Airbnb Guest Demographics & Profile Analysis (2026)
Guest Profile Summary for South West Rocks
- The typical guest profile for Airbnb in South West Rocks consists of primarily domestic travelers (93%), often arriving from nearby New South Wales, typically belonging to the Post-2000s (Gen Z/Alpha) group (50%), primarily speaking English or Spanish.
- Domestic travelers account for 92.9% of guests.
- Key international markets include Australia (92.9%) and United Kingdom (2.1%).
- Top languages spoken are English (69.8%) followed by Spanish (5.7%).
- A significant demographic segment is the Post-2000s (Gen Z/Alpha) group, representing 50% of guests.
Recommendations for Hosts
- Target domestic marketing efforts towards travelers from New South Wales and Sydney.
- Tailor amenities and listing descriptions to appeal to the dominant Post-2000s (Gen Z/Alpha) demographic (e.g., highlight fast WiFi, smart home features, local guides).
- Highlight unique local experiences or amenities relevant to the primary guest profile.
- Consider seasonal promotions aligned with peak travel times for key origin markets.
Nearby Short-Term Rental Market Comparison
How does the South West Rocks Airbnb market stack up against its neighbors? Compare key performance metrics like average monthly revenue, ADR, and occupancy rates in surrounding areas to understand the broader regional STR landscape.
| Market | Active Properties | Monthly Revenue | Daily Rate | Avg. Occupancy |
|---|---|---|---|---|
| Fernmount | 16 | $2,889 | $292.41 | 38% |
| Gleniffer | 32 | $2,767 | $354.22 | 38% |
| Minnie Water | 13 | $2,696 | $236.11 | 41% |
| Sawtell | 147 | $2,568 | $264.40 | 39% |
| Coffs Harbour | 332 | $2,568 | $239.30 | 42% |
| Emerald Beach | 48 | $2,549 | $274.32 | 42% |
| Clarence Valley Council | 79 | $2,465 | $255.04 | 39% |
| Korora | 48 | $2,434 | $245.87 | 43% |
| Yamba | 432 | $2,385 | $312.91 | 34% |
| Bellingen Shire Council | 12 | $2,345 | $156.34 | 50% |