Shellharbour City Council Airbnb Market Analysis 2026: Short Term Rental Data & Vacation Rental Statistics in New South Wales, Australia
Is Airbnb profitable in Shellharbour City Council in 2026? Explore comprehensive Airbnb analytics for Shellharbour City Council, New South Wales, Australia to uncover income potential. This 2026 STR market report for Shellharbour City Council, based on AirROI data from February 2025 to January 2026, reveals key trends in the niche market of 179 active listings.
Whether you're considering an Airbnb investment in Shellharbour City Council, optimizing your existing vacation rental, or exploring rental arbitrage opportunities, understanding the Shellharbour City Council Airbnb data is crucial. Navigating the high regulation landscape is key to maximizing your short term rental income potential. Let's dive into the specifics.
Key Shellharbour City Council Airbnb Performance Metrics Overview
Monthly Airbnb Revenue Variations & Income Potential in Shellharbour City Council (2026)
Understanding the monthly revenue variations for Airbnb listings in Shellharbour City Council is key to maximizing your short term rental income potential. Seasonality significantly impacts earnings. Our analysis, based on data from the past 12 months, shows that the peak revenue month for STRs in Shellharbour City Council is typically January, while June often presents the lowest earnings, highlighting opportunities for strategic pricing adjustments during shoulder and low seasons. Explore the typical Airbnb income in Shellharbour City Council across different performance tiers:
- Best-in-class properties (Top 10%) achieve $8,239+ monthly, often utilizing dynamic pricing and superior guest experiences.
- Strong performing properties (Top 25%) earn $5,250 or more, indicating effective management and desirable locations/amenities.
- Typical properties (Median) generate around $2,996 per month, representing the average market performance.
- Entry-level properties (Bottom 25%) see earnings around $1,791, often with potential for optimization.
Average Monthly Airbnb Earnings Trend in Shellharbour City Council
Shellharbour City Council Airbnb Occupancy Rate Trends (2026)
Maximize your bookings by understanding the Shellharbour City Council STR occupancy trends. Seasonal demand shifts significantly influence how often properties are booked. Typically, Octobersees the highest demand (peak season occupancy), while August experiences the lowest (low season). Effective strategies, like adjusting minimum stays or offering promotions, can boost occupancy during slower periods. Here's how different property tiers perform in Shellharbour City Council:
- Best-in-class properties (Top 10%) achieve 78%+ occupancy, indicating high desirability and potentially optimized availability.
- Strong performing properties (Top 25%) maintain 62% or higher occupancy, suggesting good market fit and guest satisfaction.
- Typical properties (Median) have an occupancy rate around 42%.
- Entry-level properties (Bottom 25%) average 24% occupancy, potentially facing higher vacancy.
Average Monthly Occupancy Rate Trend in Shellharbour City Council
Average Daily Rate (ADR) Airbnb Trends in Shellharbour City Council (2026)
Effective short term rental pricing strategy in Shellharbour City Council involves understanding monthly ADR fluctuations. The Average Daily Rate (ADR) for Airbnb in Shellharbour City Council typically peaks in January and dips lowest during March. Leveraging Airbnb dynamic pricing tools or strategies based on this seasonality can significantly boost revenue. Here's a look at the typical nightly rates achieved:
- Best-in-class properties (Top 10%) command rates of $618+ per night, often due to premium features or locations.
- Strong performing properties (Top 25%) achieve nightly rates of $408 or more.
- Typical properties (Median) charge around $291 per night.
- Entry-level properties (Bottom 25%) earn around $161 per night.
Average Daily Rate (ADR) Trend by Month in Shellharbour City Council
Get Live Shellharbour City Council Market Intelligence 👇

Explore Real-time Analytics
Airbnb Seasonality Analysis & Trends in Shellharbour City Council (2026)
Peak Season (January, December, October)
- Revenue averages $5,651 per month
- Occupancy rates average 53.5%
- Daily rates average $350
Shoulder Season
- Revenue averages $3,733 per month
- Occupancy maintains around 43.4%
- Daily rates hold near $324
Low Season (May, June, August)
- Revenue drops to average $2,963 per month
- Occupancy decreases to average 35.1%
- Daily rates adjust to average $326
Seasonality Insights for Shellharbour City Council
- The Airbnb seasonality in Shellharbour City Council shows highly seasonal trends requiring careful strategy. While the sections above show seasonal averages, it's also insightful to look at the extremes:
- During the high season, the absolute peak month showcases Shellharbour City Council's highest earning potential, with monthly revenues capable of climbing to $5,769, occupancy reaching a high of 55.2%, and ADRs peaking at $359.
- Conversely, the slowest single month of the year, typically falling within the low season, marks the market's lowest point. In this month, revenue might dip to $2,899, occupancy could drop to 33.1%, and ADRs may adjust down to $317.
- Understanding both the seasonal averages and these monthly peaks and troughs in revenue, occupancy, and ADR is crucial for maximizing your Airbnb profit potential in Shellharbour City Council.
Seasonal Strategies for Maximizing Profit
- Peak Season: Maximize revenue through premium pricing and potentially longer minimum stays. Ensure high availability.
- Low Season: Offer competitive pricing, special promotions (e.g., extended stay discounts), and flexible cancellation policies. Target off-season travelers like remote workers or budget-conscious guests.
- Shoulder Seasons: Implement dynamic pricing that balances peak and low rates. Target weekend travelers or specific events. Offer slightly more flexible terms than peak season.
- Regularly analyze your own performance against these Shellharbour City Council seasonality benchmarks and adjust your pricing and availability strategy accordingly.
Best Areas for Airbnb Investment in Shellharbour City Council (2026)
Exploring the top neighborhoods for short-term rentals in Shellharbour City Council? This section highlights key areas, outlining why they are attractive for hosts and guests, along with notable local attractions. Consider these locations based on your target guest profile and investment strategy.
| Neighborhood / Area | Why Host Here? (Target Guests & Appeal) | Key Attractions & Landmarks |
|---|---|---|
| Shellharbour Village | A charming coastal village known for its beautiful harbor, beaches, and community atmosphere. Ideal for tourists who enjoy a relaxed seaside lifestyle with local dining and shops. | Shellharbour Village Beach, The Shellharbour Club, Killalea State Park, Shellharbour Marina, Little Park |
| Warilla | A suburb offering a mix of beach access and local amenities, appealing to families and those looking for a friendly neighborhood vibe. Close to lovely parks and schools, making it a good choice for longer stays. | Warilla Beach, Peterborough Park, Warilla Grove Shopping Centre, Bingara Sanctuary, Windang Island |
| Lake Illawarra | A scenic area surrounding the lake, perfect for water activities and nature lovers. Attracts visitors interested in fishing, kayaking, and enjoying nature, as well as those seeking a tranquil escape. | Lake Illawarra, Windang Beach, Historical Sites, Fishing Spots, Nature Reserves |
| Barrack Point | Known for its stunning coastal views and proximity to beaches. A great spot for tourists wanting to relax and enjoy water sports and beach activities. | Barrack Point Beach, Warilla Beach, Little Lake, Local cafes and restaurants, Shelly Beach |
| Albion Park | Situated inland, this area is known for its rich history and community spirit. It offers a variety of local attractions and has easy access to the surrounding natural beauty, appealing to families and history enthusiasts. | Historical Museum, Albion Park Rail, Local Wineries, Restaurants, Surrounding National Parks |
| Shell Cove | An emerging coastal community with a marina and modern developments, appealing to those looking for a fresh experience by the water. Great for visitors wanting new accommodations and amenities. | Shell Cove Marina, Killalea State Park, The Farm, Local shops and cafes, Nearby beaches |
| Port Kembla | A unique industrial beach suburb, known for its cultural diversity and historic sites. It attracts a variety of visitors interested in experiencing the local vibe and exploring the beaches. | Port Kembla Beach, Villa Maria Surf Lifesaving Club, Historical Significance, Local Markets, Diverse eateries |
| Dapto | A suburb with a both suburban and rural feel, offering parks and local amenities. Dapto has easy access to the beaches and major roads, making it a versatile choice for tourists. | Dapto Mall, Parks and Recreation Areas, Local Coffee Shops, Nearby Nature Trails, Dapto Show |
Understanding Airbnb License Requirements & STR Laws in Shellharbour City Council (2026)
Yes, Shellharbour City Council, New South Wales, Australia enforces high STR regulations. Obtaining a license and ensuring compliance is almost certainly required according to current 2026 STR laws. Always verify the latest short term rental regulations and Airbnb license requirements directly with local government authorities for Shellharbour City Council to ensure full compliance before hosting.
(Source: AirROI data, 2026, based on 93% licensed listings)
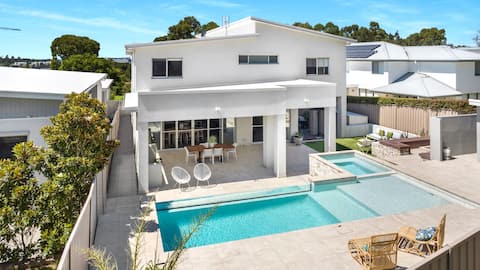
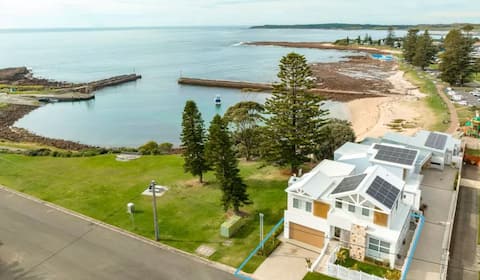
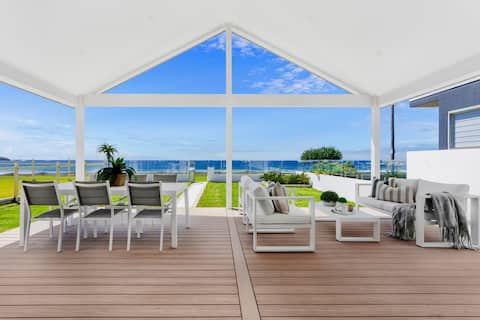
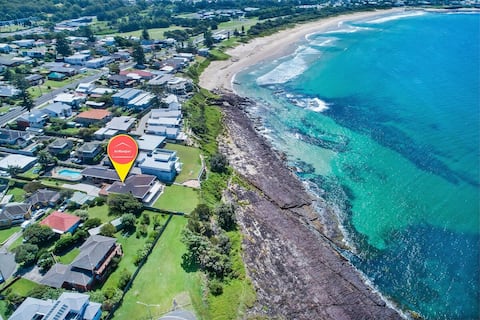
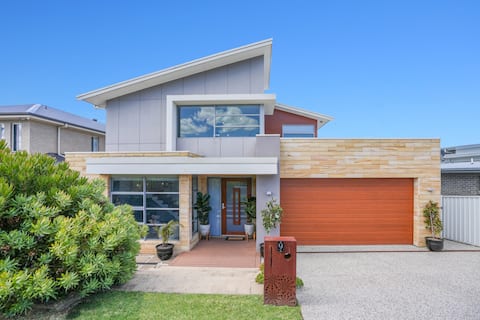
Top Performing Airbnb Properties in Shellharbour City Council (2026)
Benchmark your potential! Explore examples of top-performing Airbnb properties in Shellharbour City Councilbased on Trailing Twelve Month (TTM) revenue. Analyze their characteristics, revenue, occupancy rate, and ADR to understand what drives success in this market.

BEACH-FRONT! Luxury House with Pool & SPA
Entire Place • 4 bedrooms
Casablanca Luxury Retreat near Shellharbour Marina
Entire Place • 6 bedrooms
LegaSea Lodge - Beachfront
Entire Place • 4 bedrooms
La Palma Beach House
Entire Place • 4 bedrooms
Spectacular Ocean Front home With Pool
Entire Place • 5 bedrooms
Modern Executive Ocean View Mansion Sleeps 16
Entire Place • 6 bedrooms
Note: Performance varies based on location, size, amenities, seasonality, and management quality. Data reflects the past 12 months.
Top Performing Airbnb Hosts in Shellharbour City Council (2026)
Learn from the best! This table showcases top-performing Airbnb hosts in Shellharbour City Council based on the number of properties managed and estimated total revenue over the past year. Analyze their scale and performance metrics.
| Host Name | Properties | Grossing Revenue | Stay Reviews | Avg Rating |
|---|---|---|---|---|
| Marty And Jade | 11 | $653,704 | 509 | 4.82/5.0 |
| Shellharbour Accommodation | 12 | $506,931 | 199 | 4.84/5.0 |
| Ben | 2 | $255,506 | 335 | 4.99/5.0 |
| Mailys | 2 | $250,536 | 245 | 4.99/5.0 |
| AirKeeper | 3 | $244,636 | 221 | 4.66/5.0 |
| Laura | 2 | $192,454 | 101 | 4.88/5.0 |
| Holiday Rental Specialists | 2 | $188,605 | 30 | 4.67/5.0 |
| South Coast Holidays | 3 | $188,048 | 33 | 4.79/5.0 |
| Lindy | 1 | $164,993 | 27 | 5.00/5.0 |
| John | 5 | $149,012 | 177 | 4.77/5.0 |
Analyzing the strategies of top hosts, such as their property selection, pricing, and guest communication, can offer valuable lessons for optimizing your own Airbnb operations in Shellharbour City Council.
Dive Deeper: Advanced Shellharbour City Council STR Market Data (2026)
Ready to unlock more insights? AirROI provides access to advanced metrics and comprehensive Airbnb data for Shellharbour City Council. Explore detailed analytics beyond this report to refine your investment strategy, optimize pricing, and maximize your vacation rental profits.
Explore Advanced MetricsShellharbour City Council Short-Term Rental Market Composition (2026): Property & Room Types
Room Type Distribution
Property Type Distribution
Market Composition Insights for Shellharbour City Council
- The Shellharbour City Council Airbnb market composition is heavily skewed towards Entire Home/Apt listings, which make up 97.2% of the 179 active rentals. This indicates strong guest preference for privacy and space.
- Looking at the property type distribution in Shellharbour City Council, House properties are the most common (59.8%), reflecting the local real estate landscape.
- Houses represent a significant 59.8% portion, catering likely to families or larger groups.
- The presence of 7.8% Hotel/Boutique listings indicates integration with traditional hospitality.
- Smaller segments like outdoor/unique (combined 1.7%) offer potential for unique stay experiences.
Shellharbour City Council Airbnb Room Capacity Analysis (2026): Bedroom Distribution
Distribution of Listings by Number of Bedrooms
Room Capacity Insights for Shellharbour City Council
- The dominant room capacity in Shellharbour City Council is 3 bedrooms listings, making up 29.1% of the market. This suggests a strong demand for properties suitable for families or small groups.
- Together, 3 bedrooms and 4 bedrooms properties represent 49.2% of the active Airbnb listings in Shellharbour City Council, indicating a high concentration in these sizes.
- A significant 60.9% of listings offer 3+ bedrooms, catering to larger groups and families seeking more space in Shellharbour City Council.
Shellharbour City Council Vacation Rental Guest Capacity Trends (2026)
Distribution of Listings by Guest Capacity
Guest Capacity Insights for Shellharbour City Council
- The most common guest capacity trend in Shellharbour City Council vacation rentals is listings accommodating 8+ guests (39.1%). This suggests the primary traveler segment is likely larger groups.
- Properties designed for 8+ guests and 4 guests dominate the Shellharbour City Council STR market, accounting for 57.0% of listings.
- 62.0% of properties accommodate 6+ guests, serving the market segment for larger families or group travel in Shellharbour City Council.
- On average, properties in Shellharbour City Council are equipped to host 5.7 guests.
Shellharbour City Council Airbnb Booking Patterns (2026): Available vs. Booked Days
Available Days Distribution
Booked Days Distribution
Booking Pattern Insights for Shellharbour City Council
- The most common availability pattern in Shellharbour City Council falls within the 271-366 days range, representing 36.9% of listings. This suggests many properties have significant open periods on their calendars.
- Approximately 72.7% of listings show high availability (181+ days open annually), indicating potential for increased bookings or specific owner usage patterns.
- For booked days, the 91-180 days range is most frequent in Shellharbour City Council (36.9%), reflecting common guest stay durations or potential owner blocking patterns.
- A notable 28.4% of properties secure long booking periods (181+ days booked per year), highlighting successful long-term rental strategies or significant owner usage.
Shellharbour City Council Airbnb Minimum Stay Requirements Analysis
Distribution of Listings by Minimum Night Requirement
1 Night
22 listings
12.3% of total
2 Nights
62 listings
34.6% of total
3 Nights
1 listings
0.6% of total
4-6 Nights
6 listings
3.4% of total
7-29 Nights
6 listings
3.4% of total
30+ Nights
82 listings
45.8% of total
Key Insights
- The most prevalent minimum stay requirement in Shellharbour City Council is 30+ Nights, adopted by 45.8% of listings. This highlights the market's preference for longer commitments.
- A significant segment (45.8%) caters to monthly stays (30+ nights) in Shellharbour City Council, pointing to opportunities in the extended-stay market.
Recommendations
- Align with the market by considering a 30+ Nights minimum stay, as 45.8% of Shellharbour City Council hosts use this setting.
- If feasible, allowing 1-night stays, especially midweek or during low season, could capture last-minute bookings, as only 12.3% currently do.
- A 2-night minimum appears standard (34.6%). Consider this for weekends or peak periods.
- Explore offering discounts for stays of 30+ nights to attract the 45.8% of the market seeking extended stays.
- Adjust minimum nights based on seasonality – potentially shorter during low season and longer during peak demand periods in Shellharbour City Council.
Shellharbour City Council Airbnb Cancellation Policy Trends Analysis (2026)
Super Strict 60 Days
6 listings
3.4% of total
Limited
8 listings
4.5% of total
Super Strict 30 Days
7 listings
3.9% of total
Flexible
21 listings
11.7% of total
Moderate
54 listings
30.2% of total
Firm
73 listings
40.8% of total
Strict
10 listings
5.6% of total
Cancellation Policy Insights for Shellharbour City Council
- The prevailing Airbnb cancellation policy trend in Shellharbour City Council is Firm, used by 40.8% of listings.
- There's a relatively balanced mix between guest-friendly (41.9%) and stricter (46.4%) policies, offering choices for different guest needs.
- Strict cancellation policies are quite rare (5.6%), potentially making listings with this policy less competitive unless justified by high demand or property type.
Recommendations for Hosts
- Consider adopting a Firm policy to align with the 40.8% market standard in Shellharbour City Council.
- Using a Strict policy might deter some guests, as only 5.6% of listings use it. Evaluate if potential revenue protection outweighs possible lower booking rates.
- Regularly review your cancellation policy against competitors and market demand shifts in Shellharbour City Council.
Shellharbour City Council STR Booking Lead Time Analysis (2026)
Average Booking Lead Time by Month
Booking Lead Time Insights for Shellharbour City Council
- The overall average booking lead time for vacation rentals in Shellharbour City Council is 51 days.
- Guests book furthest in advance for stays during December (average 93 days), likely coinciding with peak travel demand or local events.
- The shortest booking windows occur for stays in July (average 27 days), indicating more last-minute travel plans during this time.
- Seasonally, Winter (64 days avg.) sees the longest lead times, while Summer (34 days avg.) has the shortest, reflecting typical travel planning cycles.
Recommendations for Hosts
- Use the overall average lead time (51 days) as a baseline for your pricing and availability strategy in Shellharbour City Council.
- For December stays, consider implementing length-of-stay discounts or slightly higher rates for bookings made less than 93 days out to capitalize on advance planning.
- Target marketing efforts for the Winter season well in advance (at least 64 days) to capture early planners.
- Monitor your own booking lead times against these Shellharbour City Council averages to identify opportunities for dynamic pricing adjustments.
Popular & Essential Airbnb Amenities in Shellharbour City Council (2026)
Amenity Prevalence
Amenity Insights for Shellharbour City Council
- Essential amenities in Shellharbour City Council that guests expect include: TV, Smoke alarm, Wifi, Kitchen. Lacking these (any) could significantly impact bookings.
- Popular amenities like Refrigerator, Hot water, Bed linens are common but not universal. Offering these can provide a competitive edge.
Recommendations for Hosts
- Ensure your listing includes all essential amenities for Shellharbour City Council: TV, Smoke alarm, Wifi, Kitchen.
- Prioritize adding missing essentials: Wifi, Kitchen.
- Consider adding popular differentiators like Refrigerator or Hot water to increase appeal.
- Highlight unique or less common amenities you offer (e.g., hot tub, dedicated workspace, EV charger) in your listing description and photos.
- Regularly check competitor amenities in Shellharbour City Council to stay competitive.
Shellharbour City Council Airbnb Guest Demographics & Profile Analysis (2026)
Guest Profile Summary for Shellharbour City Council
- The typical guest profile for Airbnb in Shellharbour City Council consists of primarily domestic travelers (89%), often arriving from nearby Sydney, typically belonging to the Post-2000s (Gen Z/Alpha) group (50%), primarily speaking English or Chinese.
- Domestic travelers account for 88.6% of guests.
- Key international markets include Australia (88.6%) and United Kingdom (1.9%).
- Top languages spoken are English (69.7%) followed by Chinese (7.1%).
- A significant demographic segment is the Post-2000s (Gen Z/Alpha) group, representing 50% of guests.
Recommendations for Hosts
- Target domestic marketing efforts towards travelers from Sydney and New South Wales.
- Tailor amenities and listing descriptions to appeal to the dominant Post-2000s (Gen Z/Alpha) demographic (e.g., highlight fast WiFi, smart home features, local guides).
- Highlight unique local experiences or amenities relevant to the primary guest profile.
- Consider seasonal promotions aligned with peak travel times for key origin markets.
Nearby Short-Term Rental Market Comparison
How does the Shellharbour City Council Airbnb market stack up against its neighbors? Compare key performance metrics like average monthly revenue, ADR, and occupancy rates in surrounding areas to understand the broader regional STR landscape.
| Market | Active Properties | Monthly Revenue | Daily Rate | Avg. Occupancy |
|---|---|---|---|---|
| Berry | 118 | $5,709 | $559.76 | 40% |
| Dawes Point | 10 | $5,632 | $415.45 | 62% |
| Millers Point | 16 | $5,345 | $388.13 | 62% |
| Burrawang | 12 | $5,242 | $557.61 | 38% |
| Penrose | 13 | $5,227 | $681.36 | 40% |
| Exeter | 34 | $4,551 | $515.98 | 41% |
| Jaspers Brush | 15 | $4,452 | $445.36 | 34% |
| The Council of the Municipality of Kiama | 109 | $4,372 | $437.99 | 42% |
| Robertson | 46 | $4,320 | $396.04 | 39% |
| Brightwaters | 10 | $4,086 | $467.19 | 35% |