Orange Airbnb Market Analysis 2026: Short Term Rental Data & Vacation Rental Statistics in New South Wales, Australia
Is Airbnb profitable in Orange in 2026? Explore comprehensive Airbnb analytics for Orange, New South Wales, Australia to uncover income potential. This 2026 STR market report for Orange, based on AirROI data from February 2025 to January 2026, reveals key trends in the market of 347 active listings.
Whether you're considering an Airbnb investment in Orange, optimizing your existing vacation rental, or exploring rental arbitrage opportunities, understanding the Orange Airbnb data is crucial. Navigating the high regulation landscape is key to maximizing your short term rental income potential. Let's dive into the specifics.
Key Orange Airbnb Performance Metrics Overview
Monthly Airbnb Revenue Variations & Income Potential in Orange (2026)
Understanding the monthly revenue variations for Airbnb listings in Orange is key to maximizing your short term rental income potential. Seasonality significantly impacts earnings. Our analysis, based on data from the past 12 months, shows that the peak revenue month for STRs in Orange is typically October, while February often presents the lowest earnings, highlighting opportunities for strategic pricing adjustments during shoulder and low seasons. Explore the typical Airbnb income in Orange across different performance tiers:
- Best-in-class properties (Top 10%) achieve $5,183+ monthly, often utilizing dynamic pricing and superior guest experiences.
- Strong performing properties (Top 25%) earn $3,808 or more, indicating effective management and desirable locations/amenities.
- Typical properties (Median) generate around $2,543 per month, representing the average market performance.
- Entry-level properties (Bottom 25%) see earnings around $1,470, often with potential for optimization.
Average Monthly Airbnb Earnings Trend in Orange
Orange Airbnb Occupancy Rate Trends (2026)
Maximize your bookings by understanding the Orange STR occupancy trends. Seasonal demand shifts significantly influence how often properties are booked. Typically, Octobersees the highest demand (peak season occupancy), while February experiences the lowest (low season). Effective strategies, like adjusting minimum stays or offering promotions, can boost occupancy during slower periods. Here's how different property tiers perform in Orange:
- Best-in-class properties (Top 10%) achieve 79%+ occupancy, indicating high desirability and potentially optimized availability.
- Strong performing properties (Top 25%) maintain 65% or higher occupancy, suggesting good market fit and guest satisfaction.
- Typical properties (Median) have an occupancy rate around 46%.
- Entry-level properties (Bottom 25%) average 26% occupancy, potentially facing higher vacancy.
Average Monthly Occupancy Rate Trend in Orange
Average Daily Rate (ADR) Airbnb Trends in Orange (2026)
Effective short term rental pricing strategy in Orange involves understanding monthly ADR fluctuations. The Average Daily Rate (ADR) for Airbnb in Orange typically peaks in October and dips lowest during February. Leveraging Airbnb dynamic pricing tools or strategies based on this seasonality can significantly boost revenue. Here's a look at the typical nightly rates achieved:
- Best-in-class properties (Top 10%) command rates of $345+ per night, often due to premium features or locations.
- Strong performing properties (Top 25%) achieve nightly rates of $249 or more.
- Typical properties (Median) charge around $186 per night.
- Entry-level properties (Bottom 25%) earn around $139 per night.
Average Daily Rate (ADR) Trend by Month in Orange
Get Live Orange Market Intelligence 👇

Explore Real-time Analytics
Airbnb Seasonality Analysis & Trends in Orange (2026)
Peak Season (October, April, March)
- Revenue averages $3,536 per month
- Occupancy rates average 53.8%
- Daily rates average $221
Shoulder Season
- Revenue averages $2,801 per month
- Occupancy maintains around 43.9%
- Daily rates hold near $215
Low Season (January, February, August)
- Revenue drops to average $2,314 per month
- Occupancy decreases to average 40.3%
- Daily rates adjust to average $206
Seasonality Insights for Orange
- The Airbnb seasonality in Orange shows moderate seasonality with distinct peak and low periods. While the sections above show seasonal averages, it's also insightful to look at the extremes:
- During the high season, the absolute peak month showcases Orange's highest earning potential, with monthly revenues capable of climbing to $3,976, occupancy reaching a high of 55.8%, and ADRs peaking at $237.
- Conversely, the slowest single month of the year, typically falling within the low season, marks the market's lowest point. In this month, revenue might dip to $2,089, occupancy could drop to 39.0%, and ADRs may adjust down to $198.
- Understanding both the seasonal averages and these monthly peaks and troughs in revenue, occupancy, and ADR is crucial for maximizing your Airbnb profit potential in Orange.
Seasonal Strategies for Maximizing Profit
- Peak Season: Maximize revenue through premium pricing and potentially longer minimum stays. Ensure high availability.
- Low Season: Offer competitive pricing, special promotions (e.g., extended stay discounts), and flexible cancellation policies. Target off-season travelers like remote workers or budget-conscious guests.
- Shoulder Seasons: Implement dynamic pricing that balances peak and low rates. Target weekend travelers or specific events. Offer slightly more flexible terms than peak season.
- Regularly analyze your own performance against these Orange seasonality benchmarks and adjust your pricing and availability strategy accordingly.
Best Areas for Airbnb Investment in Orange (2026)
Exploring the top neighborhoods for short-term rentals in Orange? This section highlights key areas, outlining why they are attractive for hosts and guests, along with notable local attractions. Consider these locations based on your target guest profile and investment strategy.
| Neighborhood / Area | Why Host Here? (Target Guests & Appeal) | Key Attractions & Landmarks |
|---|---|---|
| Orange CBD | The bustling heart of Orange, featuring shops, cafes, and a vibrant cultural scene. Ideal for tourists seeking convenience and access to local amenities and attractions. | Orange Regional Museum, Botanic Gardens, Cook Park, Orange Farmers Market, Local wineries |
| Mount Canobolas | Scenic location offering stunning views and outdoor activities. Attracts nature lovers and those seeking a peaceful retreat amidst beautiful landscapes. | Mount Canobolas Lookout, Walking trails, Canobolas State Conservation Area, Wine tasting experiences |
| Lake Canobolas | A picturesque lake area popular for picnics and outdoor activities. Great for families and those looking to relax in nature while being close to the Orange township. | Fishing and boating, Picnic areas, Walking trails, Playground facilities |
| Borenore | A quaint area known for its wineries and rural charm. Attracts visitors interested in wine tourism and the local agricultural experience. | Borenore Wines, Local farms, Scenic rural views |
| Wine Districts near Orange | Famous wine region with numerous vineyards and cellar doors. Perfect for wine enthusiasts and tourists looking for gourmet experiences. | Cellar doors, Wine tasting tours, Culinary experiences |
| Towards Mudgee | A growing area that offers a mix of rural tranquility and access to both Orange and Mudgee's attractions. Great for guests seeking a countryside escape. | Mudgee wine region, Rural landscapes, Outdoor activities |
| Dunns Swamp | A stunning natural site known for its recreational activities. Perfect for nature enthusiasts and adventure seekers looking to explore beautiful landscapes. | Kayaking, Camping facilities, Bird watching, Walking trails |
| Lidster | A quiet suburb close to Orange with easy access to the city and surrounding countryside. Appeals to guests looking for peaceful accommodations while still near urban attractions. | Rural settings, Local parks, Close proximity to wineries |
Understanding Airbnb License Requirements & STR Laws in Orange (2026)
Yes, Orange, New South Wales, Australia enforces high STR regulations. Obtaining a license and ensuring compliance is almost certainly required according to current 2026 STR laws. Always verify the latest short term rental regulations and Airbnb license requirements directly with local government authorities for Orange to ensure full compliance before hosting.
(Source: AirROI data, 2026, based on 95% licensed listings)
Top Performing Airbnb Properties in Orange (2026)
Benchmark your potential! Explore examples of top-performing Airbnb properties in Orangebased on Trailing Twelve Month (TTM) revenue. Analyze their characteristics, revenue, occupancy rate, and ADR to understand what drives success in this market.
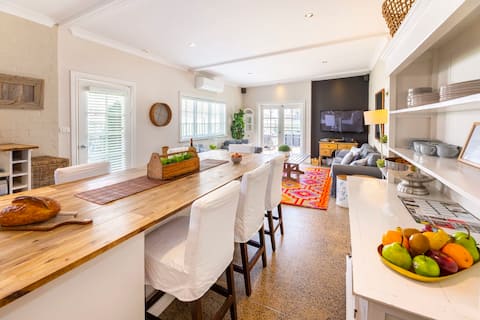
The Edward Townhouses 151-157
Entire Place • 12 bedrooms

Ultimate Orange | 17 ppl | Pool!
Entire Place • 7 bedrooms
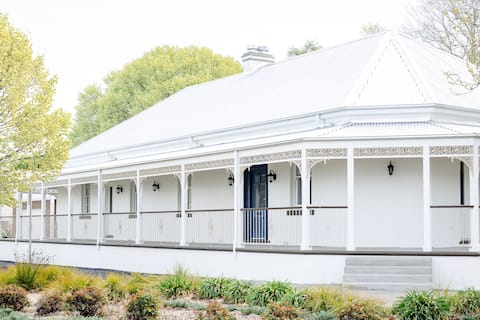
The Welcome Inn | Central Orange | Pet friendly
Entire Place • 5 bedrooms

Amongst the vines | Large home & garden | Orange
Entire Place • 7 bedrooms
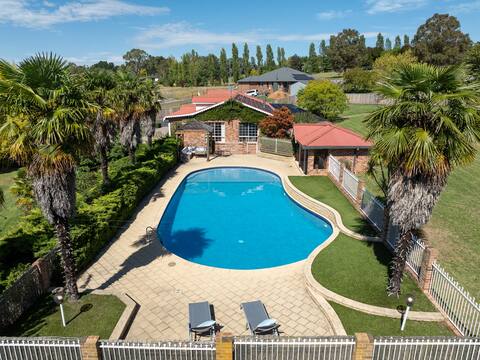
Entertainer's Dream - 6 Bedroom Home with Pool
Entire Place • 6 bedrooms
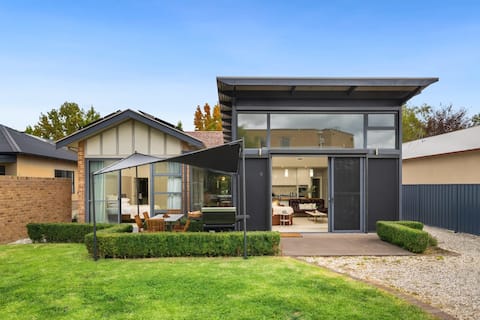
Stunning on Summer - Heart of Orange
Entire Place • 6 bedrooms
Note: Performance varies based on location, size, amenities, seasonality, and management quality. Data reflects the past 12 months.
Top Performing Airbnb Hosts in Orange (2026)
Learn from the best! This table showcases top-performing Airbnb hosts in Orange based on the number of properties managed and estimated total revenue over the past year. Analyze their scale and performance metrics.
| Host Name | Properties | Grossing Revenue | Stay Reviews | Avg Rating |
|---|---|---|---|---|
| BNB Made Easy: Timmy | 102 | $3,319,116 | 5621 | 4.78/5.0 |
| YourStay | 38 | $1,445,845 | 3564 | 4.78/5.0 |
| Book Regional | 32 | $1,158,397 | 1826 | 4.86/5.0 |
| Lisa | 10 | $438,804 | 358 | 4.91/5.0 |
| Glenda | 14 | $260,583 | 368 | 4.91/5.0 |
| Jody | 5 | $165,267 | 855 | 4.85/5.0 |
| Cici | 12 | $141,674 | 178 | 4.58/5.0 |
| Joel | 3 | $131,177 | 439 | 4.94/5.0 |
| Jan | 4 | $88,007 | 298 | 4.83/5.0 |
| Rachel | 2 | $72,728 | 348 | 4.92/5.0 |
Analyzing the strategies of top hosts, such as their property selection, pricing, and guest communication, can offer valuable lessons for optimizing your own Airbnb operations in Orange.
Dive Deeper: Advanced Orange STR Market Data (2026)
Ready to unlock more insights? AirROI provides access to advanced metrics and comprehensive Airbnb data for Orange. Explore detailed analytics beyond this report to refine your investment strategy, optimize pricing, and maximize your vacation rental profits.
Explore Advanced MetricsOrange Short-Term Rental Market Composition (2026): Property & Room Types
Room Type Distribution
Property Type Distribution
Market Composition Insights for Orange
- The Orange Airbnb market composition is heavily skewed towards Entire Home/Apt listings, which make up 95.1% of the 347 active rentals. This indicates strong guest preference for privacy and space.
- Looking at the property type distribution in Orange, House properties are the most common (73.2%), reflecting the local real estate landscape.
- Houses represent a significant 73.2% portion, catering likely to families or larger groups.
- Smaller segments like hotel/boutique, others, outdoor/unique, unique stays (combined 9.2%) offer potential for unique stay experiences.
Orange Airbnb Room Capacity Analysis (2026): Bedroom Distribution
Distribution of Listings by Number of Bedrooms
Room Capacity Insights for Orange
- The dominant room capacity in Orange is 3 bedrooms listings, making up 27.7% of the market. This suggests a strong demand for properties suitable for families or small groups.
- Together, 3 bedrooms and 2 bedrooms properties represent 51.9% of the active Airbnb listings in Orange, indicating a high concentration in these sizes.
- A significant 53.4% of listings offer 3+ bedrooms, catering to larger groups and families seeking more space in Orange.
Orange Vacation Rental Guest Capacity Trends (2026)
Distribution of Listings by Guest Capacity
Guest Capacity Insights for Orange
- The most common guest capacity trend in Orange vacation rentals is listings accommodating 6 guests (25.4%). This suggests the primary traveler segment is likely larger groups.
- Properties designed for 6 guests and 8+ guests dominate the Orange STR market, accounting for 50.5% of listings.
- 52.5% of properties accommodate 6+ guests, serving the market segment for larger families or group travel in Orange.
- On average, properties in Orange are equipped to host 5.1 guests.
Orange Airbnb Booking Patterns (2026): Available vs. Booked Days
Available Days Distribution
Booked Days Distribution
Booking Pattern Insights for Orange
- The most common availability pattern in Orange falls within the 181-270 days range, representing 39.5% of listings. This suggests many properties have significant open periods on their calendars.
- Approximately 70.0% of listings show high availability (181+ days open annually), indicating potential for increased bookings or specific owner usage patterns.
- For booked days, the 91-180 days range is most frequent in Orange (39.8%), reflecting common guest stay durations or potential owner blocking patterns.
- A notable 31.7% of properties secure long booking periods (181+ days booked per year), highlighting successful long-term rental strategies or significant owner usage.
Orange Airbnb Minimum Stay Requirements Analysis
Distribution of Listings by Minimum Night Requirement
1 Night
48 listings
13.8% of total
2 Nights
156 listings
45% of total
3 Nights
3 listings
0.9% of total
4-6 Nights
2 listings
0.6% of total
7-29 Nights
6 listings
1.7% of total
30+ Nights
132 listings
38% of total
Key Insights
- The most prevalent minimum stay requirement in Orange is 2 Nights, adopted by 45% of listings. This highlights the market's preference for shorter, flexible bookings.
- A significant segment (38%) caters to monthly stays (30+ nights) in Orange, pointing to opportunities in the extended-stay market.
Recommendations
- Align with the market by considering a 2 Nights minimum stay, as 45% of Orange hosts use this setting.
- If feasible, allowing 1-night stays, especially midweek or during low season, could capture last-minute bookings, as only 13.8% currently do.
- A 2-night minimum appears standard (45%). Consider this for weekends or peak periods.
- Explore offering discounts for stays of 30+ nights to attract the 38% of the market seeking extended stays.
- Adjust minimum nights based on seasonality – potentially shorter during low season and longer during peak demand periods in Orange.
Orange Airbnb Cancellation Policy Trends Analysis (2026)
Limited
1 listings
0.3% of total
Flexible
62 listings
17.9% of total
Moderate
234 listings
67.4% of total
Firm
29 listings
8.4% of total
Strict
21 listings
6.1% of total
Cancellation Policy Insights for Orange
- The prevailing Airbnb cancellation policy trend in Orange is Moderate, used by 67.4% of listings.
- The market strongly favors guest-friendly terms, with 85.3% of listings offering Flexible or Moderate policies. This suggests guests in Orange may expect booking flexibility.
- Strict cancellation policies are quite rare (6.1%), potentially making listings with this policy less competitive unless justified by high demand or property type.
Recommendations for Hosts
- Consider adopting a Moderate policy to align with the 67.4% market standard in Orange.
- Using a Strict policy might deter some guests, as only 6.1% of listings use it. Evaluate if potential revenue protection outweighs possible lower booking rates.
- Regularly review your cancellation policy against competitors and market demand shifts in Orange.
Orange STR Booking Lead Time Analysis (2026)
Average Booking Lead Time by Month
Booking Lead Time Insights for Orange
- The overall average booking lead time for vacation rentals in Orange is 44 days.
- Guests book furthest in advance for stays during October (average 65 days), likely coinciding with peak travel demand or local events.
- The shortest booking windows occur for stays in February (average 31 days), indicating more last-minute travel plans during this time.
- Seasonally, Fall (54 days avg.) sees the longest lead times, while Summer (39 days avg.) has the shortest, reflecting typical travel planning cycles.
Recommendations for Hosts
- Use the overall average lead time (44 days) as a baseline for your pricing and availability strategy in Orange.
- For October stays, consider implementing length-of-stay discounts or slightly higher rates for bookings made less than 65 days out to capitalize on advance planning.
- Target marketing efforts for the Fall season well in advance (at least 54 days) to capture early planners.
- Monitor your own booking lead times against these Orange averages to identify opportunities for dynamic pricing adjustments.
Popular & Essential Airbnb Amenities in Orange (2026)
Amenity Prevalence
Amenity Insights for Orange
- Essential amenities in Orange that guests expect include: TV, Heating, Smoke alarm, Iron, Wifi. Lacking these (any) could significantly impact bookings.
- Popular amenities like Dishes and silverware, Microwave, Hot water are common but not universal. Offering these can provide a competitive edge.
Recommendations for Hosts
- Ensure your listing includes all essential amenities for Orange: TV, Heating, Smoke alarm, Iron, Wifi.
- Prioritize adding missing essentials: TV, Heating, Smoke alarm, Iron, Wifi.
- Consider adding popular differentiators like Dishes and silverware or Microwave to increase appeal.
- Highlight unique or less common amenities you offer (e.g., hot tub, dedicated workspace, EV charger) in your listing description and photos.
- Regularly check competitor amenities in Orange to stay competitive.
Orange Airbnb Guest Demographics & Profile Analysis (2026)
Guest Profile Summary for Orange
- The typical guest profile for Airbnb in Orange consists of primarily domestic travelers (94%), often arriving from nearby Sydney, typically belonging to the Post-2000s (Gen Z/Alpha) group (50%), primarily speaking English or French.
- Domestic travelers account for 93.7% of guests.
- Key international markets include Australia (93.7%) and United Kingdom (2.3%).
- Top languages spoken are English (71.8%) followed by French (4.5%).
- A significant demographic segment is the Post-2000s (Gen Z/Alpha) group, representing 50% of guests.
Recommendations for Hosts
- Target domestic marketing efforts towards travelers from Sydney and New South Wales.
- Tailor amenities and listing descriptions to appeal to the dominant Post-2000s (Gen Z/Alpha) demographic (e.g., highlight fast WiFi, smart home features, local guides).
- Highlight unique local experiences or amenities relevant to the primary guest profile.
- Consider seasonal promotions aligned with peak travel times for key origin markets.
Nearby Short-Term Rental Market Comparison
How does the Orange Airbnb market stack up against its neighbors? Compare key performance metrics like average monthly revenue, ADR, and occupancy rates in surrounding areas to understand the broader regional STR landscape.
| Market | Active Properties | Monthly Revenue | Daily Rate | Avg. Occupancy |
|---|---|---|---|---|
| Berry | 118 | $5,709 | $559.76 | 40% |
| Burrawang | 12 | $5,242 | $557.61 | 38% |
| Penrose | 13 | $5,227 | $681.36 | 40% |
| Exeter | 34 | $4,551 | $515.98 | 41% |
| Jaspers Brush | 15 | $4,452 | $445.36 | 34% |
| The Council of the Municipality of Kiama | 109 | $4,372 | $437.99 | 42% |
| Robertson | 46 | $4,320 | $396.04 | 39% |
| Bundanoon | 52 | $4,078 | $405.13 | 41% |
| Bowral | 194 | $3,956 | $389.30 | 43% |
| Glenquarry | 14 | $3,947 | $375.09 | 45% |