Nowra Airbnb Market Analysis 2026: Short Term Rental Data & Vacation Rental Statistics in New South Wales, Australia
Is Airbnb profitable in Nowra in 2026? Explore comprehensive Airbnb analytics for Nowra, New South Wales, Australia to uncover income potential. This 2026 STR market report for Nowra, based on AirROI data from February 2025 to January 2026, reveals key trends in the niche market of 20 active listings.
Whether you're considering an Airbnb investment in Nowra, optimizing your existing vacation rental, or exploring rental arbitrage opportunities, understanding the Nowra Airbnb data is crucial. Navigating the high regulation landscape is key to maximizing your short term rental income potential. Let's dive into the specifics.
Key Nowra Airbnb Performance Metrics Overview
Monthly Airbnb Revenue Variations & Income Potential in Nowra (2026)
Understanding the monthly revenue variations for Airbnb listings in Nowra is key to maximizing your short term rental income potential. Seasonality significantly impacts earnings. Our analysis, based on data from the past 12 months, shows that the peak revenue month for STRs in Nowra is typically October, while August often presents the lowest earnings, highlighting opportunities for strategic pricing adjustments during shoulder and low seasons. Explore the typical Airbnb income in Nowra across different performance tiers:
- Best-in-class properties (Top 10%) achieve $4,118+ monthly, often utilizing dynamic pricing and superior guest experiences.
- Strong performing properties (Top 25%) earn $2,385 or more, indicating effective management and desirable locations/amenities.
- Typical properties (Median) generate around $1,211 per month, representing the average market performance.
- Entry-level properties (Bottom 25%) see earnings around $654, often with potential for optimization.
Average Monthly Airbnb Earnings Trend in Nowra
Nowra Airbnb Occupancy Rate Trends (2026)
Maximize your bookings by understanding the Nowra STR occupancy trends. Seasonal demand shifts significantly influence how often properties are booked. Typically, Octobersees the highest demand (peak season occupancy), while July experiences the lowest (low season). Effective strategies, like adjusting minimum stays or offering promotions, can boost occupancy during slower periods. Here's how different property tiers perform in Nowra:
- Best-in-class properties (Top 10%) achieve 64%+ occupancy, indicating high desirability and potentially optimized availability.
- Strong performing properties (Top 25%) maintain 42% or higher occupancy, suggesting good market fit and guest satisfaction.
- Typical properties (Median) have an occupancy rate around 26%.
- Entry-level properties (Bottom 25%) average 14% occupancy, potentially facing higher vacancy.
Average Monthly Occupancy Rate Trend in Nowra
Average Daily Rate (ADR) Airbnb Trends in Nowra (2026)
Effective short term rental pricing strategy in Nowra involves understanding monthly ADR fluctuations. The Average Daily Rate (ADR) for Airbnb in Nowra typically peaks in December and dips lowest during August. Leveraging Airbnb dynamic pricing tools or strategies based on this seasonality can significantly boost revenue. Here's a look at the typical nightly rates achieved:
- Best-in-class properties (Top 10%) command rates of $369+ per night, often due to premium features or locations.
- Strong performing properties (Top 25%) achieve nightly rates of $259 or more.
- Typical properties (Median) charge around $162 per night.
- Entry-level properties (Bottom 25%) earn around $119 per night.
Average Daily Rate (ADR) Trend by Month in Nowra
Get Live Nowra Market Intelligence 👇

Explore Real-time Analytics
Airbnb Seasonality Analysis & Trends in Nowra (2026)
Peak Season (October, December, January)
- Revenue averages $2,376 per month
- Occupancy rates average 38.1%
- Daily rates average $240
Shoulder Season
- Revenue averages $1,652 per month
- Occupancy maintains around 30.3%
- Daily rates hold near $198
Low Season (June, August, November)
- Revenue drops to average $1,361 per month
- Occupancy decreases to average 24.4%
- Daily rates adjust to average $207
Seasonality Insights for Nowra
- The Airbnb seasonality in Nowra shows highly seasonal trends requiring careful strategy. While the sections above show seasonal averages, it's also insightful to look at the extremes:
- During the high season, the absolute peak month showcases Nowra's highest earning potential, with monthly revenues capable of climbing to $2,851, occupancy reaching a high of 41.4%, and ADRs peaking at $249.
- Conversely, the slowest single month of the year, typically falling within the low season, marks the market's lowest point. In this month, revenue might dip to $1,287, occupancy could drop to 22.2%, and ADRs may adjust down to $190.
- Understanding both the seasonal averages and these monthly peaks and troughs in revenue, occupancy, and ADR is crucial for maximizing your Airbnb profit potential in Nowra.
Seasonal Strategies for Maximizing Profit
- Peak Season: Maximize revenue through premium pricing and potentially longer minimum stays. Ensure high availability.
- Low Season: Offer competitive pricing, special promotions (e.g., extended stay discounts), and flexible cancellation policies. Target off-season travelers like remote workers or budget-conscious guests.
- Shoulder Seasons: Implement dynamic pricing that balances peak and low rates. Target weekend travelers or specific events. Offer slightly more flexible terms than peak season.
- Regularly analyze your own performance against these Nowra seasonality benchmarks and adjust your pricing and availability strategy accordingly.
Best Areas for Airbnb Investment in Nowra (2026)
Exploring the top neighborhoods for short-term rentals in Nowra? This section highlights key areas, outlining why they are attractive for hosts and guests, along with notable local attractions. Consider these locations based on your target guest profile and investment strategy.
| Neighborhood / Area | Why Host Here? (Target Guests & Appeal) | Key Attractions & Landmarks |
|---|---|---|
| South Nowra | A thriving suburb with a mix of residential and commercial areas. Close proximity to parks, shopping centers, and schools makes it attractive for families and travelers. | Nowra Zoo, Stockland Nowra, Shoalhaven River, Nowra Showground, Bens Walk |
| Nowra CBD | The central business district offers easy access to shops, cafes, and local attractions. Ideal for guests looking for convenience and urban amenities. | Illaroo Road, Shoalhaven Regional Gallery, Nowra Farmers Market, local dining and shopping options |
| Worrigee | A peaceful residential area that appeals to families and those seeking a quiet retreat yet close enough to Nowra's attractions and services. | Worrigee Nature Reserve, local parks, cycling paths |
| Bomaderry | An adjacent suburb to Nowra with good transport links and local amenities. Attracts visitors looking for a more laid-back environment while being close to the main town. | Bomaderry Creek, Shoalhaven River |
| Huskisson | Popular coastal town known for its beautiful beaches and marine activities. A favorite spot for tourists looking to explore the Jervis Bay area. | Huskisson Beach, Jervis Bay Marine Park, local cafes and shops |
| Berry | Charming town famous for its markets and boutique shops. Ideal for visitors interested in local produce and scenic countryside. | Berry Markets, Berry Historic Museum, local wineries |
| Jervis Bay | Renowned for its stunning beaches and coastal experiences. Highly sought after for beach holidays and nature retreats. | Hyams Beach, Booderee National Park, Jervis Bay Whale Watching |
| Shoalhaven Heads | A serene coastal area ideal for holiday makers seeking relaxation by the beach and close to nature, great for surf and bush walks. | Shoalhaven Heads Beach, local surf spots, natural reserves |
Understanding Airbnb License Requirements & STR Laws in Nowra (2026)
Yes, Nowra, New South Wales, Australia enforces high STR regulations. Obtaining a license and ensuring compliance is almost certainly required according to current 2026 STR laws. Always verify the latest short term rental regulations and Airbnb license requirements directly with local government authorities for Nowra to ensure full compliance before hosting.
(Source: AirROI data, 2026, based on 100% licensed listings)
Top Performing Airbnb Properties in Nowra (2026)
Benchmark your potential! Explore examples of top-performing Airbnb properties in Nowrabased on Trailing Twelve Month (TTM) revenue. Analyze their characteristics, revenue, occupancy rate, and ADR to understand what drives success in this market.
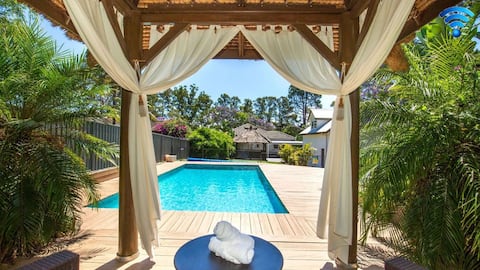
Bali Huts Escape – unwind in your private oasis
Entire Place • 4 bedrooms
Quiet, central location, Pet Friendly
Entire Place • 2 bedrooms
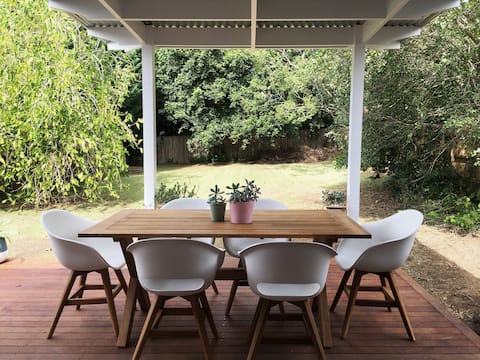
Spring cottage • Family 4BR Retreat •Walk to Nowra
Entire Place • 4 bedrooms

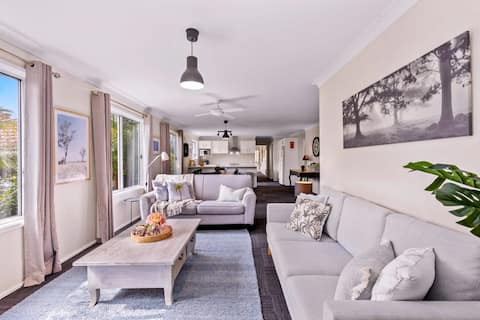
Casa de Soleil - New Modern Home Central Location
Entire Place • 3 bedrooms
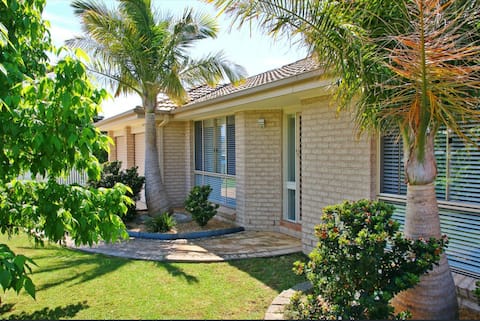
Bright Nowra Stay in Stunning Shoalhaven Region
Entire Place • 3 bedrooms
Blue Horizon Escape – Private Pool & Pet Friendly
Entire Place • 3 bedrooms
Note: Performance varies based on location, size, amenities, seasonality, and management quality. Data reflects the past 12 months.
Top Performing Airbnb Hosts in Nowra (2026)
Learn from the best! This table showcases top-performing Airbnb hosts in Nowra based on the number of properties managed and estimated total revenue over the past year. Analyze their scale and performance metrics.
| Host Name | Properties | Grossing Revenue | Stay Reviews | Avg Rating |
|---|---|---|---|---|
| Holiday Rental Specialists | 1 | $47,137 | 3 | 2.67/5.0 |
| Catherine & Rob | 1 | $45,496 | 129 | 4.86/5.0 |
| Michele | 4 | $40,302 | 194 | 4.10/5.0 |
| Jenny | 1 | $35,282 | 55 | 4.95/5.0 |
| Donna | 1 | $30,743 | 33 | 5.00/5.0 |
| Winston | 2 | $30,068 | 22 | 4.68/5.0 |
| Zane | 1 | $21,991 | 16 | 4.44/5.0 |
| William John | 1 | $21,083 | 29 | 5.00/5.0 |
| Elena | 1 | $17,070 | 60 | 4.88/5.0 |
| Adrian. Sarah | 1 | $16,809 | 41 | 4.68/5.0 |
Analyzing the strategies of top hosts, such as their property selection, pricing, and guest communication, can offer valuable lessons for optimizing your own Airbnb operations in Nowra.
Dive Deeper: Advanced Nowra STR Market Data (2026)
Ready to unlock more insights? AirROI provides access to advanced metrics and comprehensive Airbnb data for Nowra. Explore detailed analytics beyond this report to refine your investment strategy, optimize pricing, and maximize your vacation rental profits.
Explore Advanced MetricsNowra Short-Term Rental Market Composition (2026): Property & Room Types
Room Type Distribution
Property Type Distribution
Market Composition Insights for Nowra
- The Nowra Airbnb market composition is heavily skewed towards Entire Home/Apt listings, which make up 90% of the 20 active rentals. This indicates strong guest preference for privacy and space.
- Looking at the property type distribution in Nowra, House properties are the most common (60%), reflecting the local real estate landscape.
- Houses represent a significant 60% portion, catering likely to families or larger groups.
Nowra Airbnb Room Capacity Analysis (2026): Bedroom Distribution
Distribution of Listings by Number of Bedrooms
Room Capacity Insights for Nowra
- The dominant room capacity in Nowra is 3 bedrooms listings, making up 35% of the market. This suggests a strong demand for properties suitable for families or small groups.
- Together, 3 bedrooms and 2 bedrooms properties represent 60.0% of the active Airbnb listings in Nowra, indicating a high concentration in these sizes.
- A significant 45.0% of listings offer 3+ bedrooms, catering to larger groups and families seeking more space in Nowra.
Nowra Vacation Rental Guest Capacity Trends (2026)
Distribution of Listings by Guest Capacity
Guest Capacity Insights for Nowra
- The most common guest capacity trend in Nowra vacation rentals is listings accommodating 8+ guests (30%). This suggests the primary traveler segment is likely larger groups.
- Properties designed for 8+ guests and 2 guests dominate the Nowra STR market, accounting for 55.0% of listings.
- 45.0% of properties accommodate 6+ guests, serving the market segment for larger families or group travel in Nowra.
- On average, properties in Nowra are equipped to host 5.0 guests.
Nowra Airbnb Booking Patterns (2026): Available vs. Booked Days
Available Days Distribution
Booked Days Distribution
Booking Pattern Insights for Nowra
- The most common availability pattern in Nowra falls within the 271-366 days range, representing 50% of listings. This suggests many properties have significant open periods on their calendars.
- Approximately 90.0% of listings show high availability (181+ days open annually), indicating potential for increased bookings or specific owner usage patterns.
- For booked days, the 31-90 days range is most frequent in Nowra (45%), reflecting common guest stay durations or potential owner blocking patterns.
- A notable 10.0% of properties secure long booking periods (181+ days booked per year), highlighting successful long-term rental strategies or significant owner usage.
Nowra Airbnb Minimum Stay Requirements Analysis
Distribution of Listings by Minimum Night Requirement
1 Night
5 listings
25% of total
2 Nights
7 listings
35% of total
4-6 Nights
1 listings
5% of total
30+ Nights
7 listings
35% of total
Key Insights
- The most prevalent minimum stay requirement in Nowra is 2 Nights, adopted by 35% of listings. This highlights the market's preference for shorter, flexible bookings.
- A significant segment (35%) caters to monthly stays (30+ nights) in Nowra, pointing to opportunities in the extended-stay market.
Recommendations
- Align with the market by considering a 2 Nights minimum stay, as 35% of Nowra hosts use this setting.
- If feasible, allowing 1-night stays, especially midweek or during low season, could capture last-minute bookings, as only 25% currently do.
- Explore offering discounts for stays of 30+ nights to attract the 35% of the market seeking extended stays.
- Adjust minimum nights based on seasonality – potentially shorter during low season and longer during peak demand periods in Nowra.
Nowra Airbnb Cancellation Policy Trends Analysis (2026)
Super Strict 60 Days
1 listings
5% of total
Super Strict 30 Days
1 listings
5% of total
Flexible
4 listings
20% of total
Moderate
3 listings
15% of total
Firm
9 listings
45% of total
Strict
2 listings
10% of total
Cancellation Policy Insights for Nowra
- The prevailing Airbnb cancellation policy trend in Nowra is Firm, used by 45% of listings.
- A majority (55.0%) of hosts in Nowra utilize Firm or Strict policies, indicating a market where hosts prioritize booking security.
Recommendations for Hosts
- Consider adopting a Firm policy to align with the 45% market standard in Nowra.
- Using a Strict policy might deter some guests, as only 10% of listings use it. Evaluate if potential revenue protection outweighs possible lower booking rates.
- Regularly review your cancellation policy against competitors and market demand shifts in Nowra.
Nowra STR Booking Lead Time Analysis (2026)
Average Booking Lead Time by Month
Booking Lead Time Insights for Nowra
- The overall average booking lead time for vacation rentals in Nowra is 37 days.
- Guests book furthest in advance for stays during October (average 58 days), likely coinciding with peak travel demand or local events.
- The shortest booking windows occur for stays in June (average 14 days), indicating more last-minute travel plans during this time.
- Seasonally, Winter (48 days avg.) sees the longest lead times, while Summer (22 days avg.) has the shortest, reflecting typical travel planning cycles.
Recommendations for Hosts
- Use the overall average lead time (37 days) as a baseline for your pricing and availability strategy in Nowra.
- For October stays, consider implementing length-of-stay discounts or slightly higher rates for bookings made less than 58 days out to capitalize on advance planning.
- During June, focus on last-minute booking availability and promotions, as guests book with very short notice (14 days avg.).
- Target marketing efforts for the Winter season well in advance (at least 48 days) to capture early planners.
- Monitor your own booking lead times against these Nowra averages to identify opportunities for dynamic pricing adjustments.
Popular & Essential Airbnb Amenities in Nowra (2026)
Amenity Prevalence
Amenity Insights for Nowra
- Essential amenities in Nowra that guests expect include: TV, Smoke alarm, Washer, Heating, Air conditioning, Iron. Lacking these (any) could significantly impact bookings.
- Popular amenities like Free parking on premises, Hangers, Hot water are common but not universal. Offering these can provide a competitive edge.
Recommendations for Hosts
- Ensure your listing includes all essential amenities for Nowra: TV, Smoke alarm, Washer, Heating, Air conditioning, Iron.
- Prioritize adding missing essentials: Washer, Heating, Air conditioning, Iron.
- Consider adding popular differentiators like Free parking on premises or Hangers to increase appeal.
- Highlight unique or less common amenities you offer (e.g., hot tub, dedicated workspace, EV charger) in your listing description and photos.
- Regularly check competitor amenities in Nowra to stay competitive.
Nowra Airbnb Guest Demographics & Profile Analysis (2026)
Guest Profile Summary for Nowra
- The typical guest profile for Airbnb in Nowra consists of primarily domestic travelers (89%), often arriving from nearby Sydney, typically belonging to the Post-2000s (Gen Z/Alpha) group (50%), primarily speaking English or Spanish.
- Domestic travelers account for 88.5% of guests.
- Key international markets include Australia (88.5%) and United Kingdom (4.2%).
- Top languages spoken are English (68%) followed by Spanish (8%).
- A significant demographic segment is the Post-2000s (Gen Z/Alpha) group, representing 50% of guests.
Recommendations for Hosts
- Target domestic marketing efforts towards travelers from Sydney and New South Wales.
- Tailor amenities and listing descriptions to appeal to the dominant Post-2000s (Gen Z/Alpha) demographic (e.g., highlight fast WiFi, smart home features, local guides).
- Highlight unique local experiences or amenities relevant to the primary guest profile.
- Consider seasonal promotions aligned with peak travel times for key origin markets.
Nearby Short-Term Rental Market Comparison
How does the Nowra Airbnb market stack up against its neighbors? Compare key performance metrics like average monthly revenue, ADR, and occupancy rates in surrounding areas to understand the broader regional STR landscape.
| Market | Active Properties | Monthly Revenue | Daily Rate | Avg. Occupancy |
|---|---|---|---|---|
| Berry | 118 | $5,709 | $559.76 | 40% |
| Dawes Point | 10 | $5,632 | $415.45 | 62% |
| Millers Point | 16 | $5,345 | $388.13 | 62% |
| Burrawang | 12 | $5,242 | $557.61 | 38% |
| Penrose | 13 | $5,227 | $681.36 | 40% |
| Exeter | 34 | $4,551 | $515.98 | 41% |
| Jaspers Brush | 15 | $4,452 | $445.36 | 34% |
| The Council of the Municipality of Kiama | 109 | $4,372 | $437.99 | 42% |
| Robertson | 46 | $4,320 | $396.04 | 39% |
| Brightwaters | 10 | $4,086 | $467.19 | 35% |